Consequent Encroachment
The 50% midpoint of a Fair Value Gap, used as the standard ICT-style entry level for FVG trades.
What it means
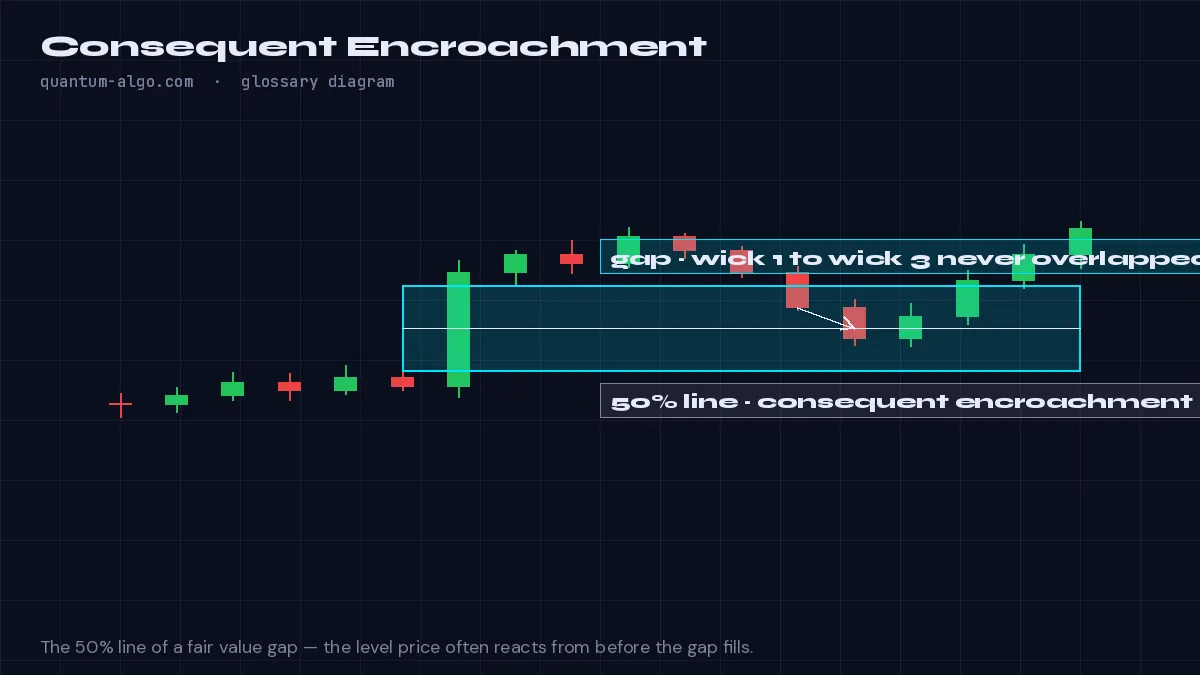
Consequent Encroachment (CE) is the 50% midpoint of a Fair Value Gap. It is the standard entry level for ICT-style FVG trades and is the most-cited single price-action level in modern SMC execution. The logic: when price returns to the FVG, the midpoint typically offers the optimal balance of fill probability (price often retraces to ~50% of the FVG before continuing) and risk-to-reward (entering halfway up the FVG keeps the stop tight).
Mathematically, CE is calculated as the average of the FVG's high and low boundaries. For a bullish FVG with a high of 1.1050 and a low of 1.1030, the CE is 1.1040. Traders place limit orders at CE and let price come to them, with stop-losses 1–3 ATR beyond the far edge of the FVG.
CE is most reliable on higher timeframes (1H+). On lower timeframes, FVGs are smaller and the difference between entering at CE versus at the boundary is often a few pips, while the noise around the level is much greater. Lower-timeframe FVG trading typically uses boundary entries with rejection-candle confirmation rather than passive CE limits.
The concept extends beyond FVGs: 'CE of the range' refers to the 50% midpoint of any defined range (e.g., the prior session range), and is used as a directional bias indicator. Price above CE of the range = bullish bias for the session; price below CE = bearish bias. This is the institutional 'fair value' anchor that explains why so many trades pivot from approximately the midpoint of the prior range.
How to identify it on a chart
- Draw the fair value gap from the wick of candle 1 to the wick of candle 3.
- Place a line at exactly 50% of that range — the consequent encroachment.
- Watch for rejection at the CE before full fill; a close through it weakens the gap.
Worked example
A bullish FVG spans 64,100–64,300; CE is 64,200. Price returns, wicks to 64,190 and closes above 64,300 — the CE held and the gap remains valid support.
See it on the chart, read it in depth
Frequently asked questions
Should I always enter FVG trades at the CE?
CE is the standard ICT entry, but conservative traders wait for a rejection candle at the FVG boundary instead. Aggressive traders enter at the near boundary for maximum R:R but accept lower fill rates. CE offers the best balance for most discretionary traders.
How do I calculate CE on a chart?
TradingView's measure tool can display the midpoint of any zone you draw. For automatic detection, Quantum Algo plots the CE on every detected FVG. Manually: average the FVG's high and low boundaries.
Does CE work on every timeframe?
Most reliably on 1H and above. On lower timeframes, the noise around CE often triggers stops before the move. Lower-timeframe FVG trades benefit more from boundary entries with rejection-candle confirmation than from passive CE limits.
Related terms
See Consequent Encroachment on your TradingView chart
Zeno reads Smart Money structure across timeframes and prints the entry, stop and targets — with a public record of every posted trade. The free indicators draw the concepts this page defines.