Funding Rate Trading: How Perpetual Funding Reveals Positioning
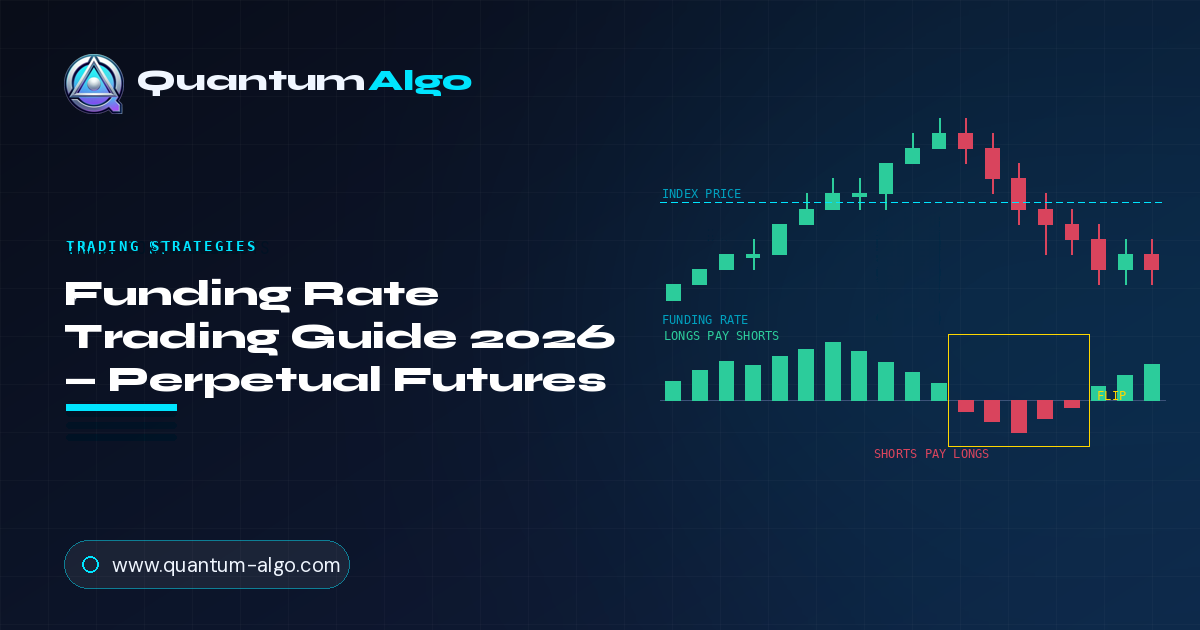
| Signal type | Positioning / sentiment (derivatives) |
| Directional bias | Contrarian at extremes, confirming in trend |
| Markets | Crypto perpetual futures (BTC, ETH, majors) |
| Typical baseline | +0.01% per 8h (≈10.95% annualised) |
| Confirmation | Open interest direction + market structure |
| Invalidation | Funding normalises while price holds its trend |
1. What Is a Funding Rate — And Why Perpetuals Need One
A funding rate is a recurring payment exchanged directly between long and short traders in a perpetual futures market. It is not a fee the exchange keeps. It is a transfer — one side of the book pays the other, every few hours, for as long as positions stay open.
The reason it exists comes down to a design problem. A traditional futures contract has an expiry date, and that expiry is what drags its price back to spot: on settlement day, the contract must converge with the underlying. A perpetual contract (a "perp") deliberately removes the expiry so traders can hold a leveraged position indefinitely. That solves one problem and creates another — without an expiry, nothing forces the contract price back toward the real market price of the asset.
Funding is the replacement mechanism. Instead of a hard convergence date, the market gets a continuous economic nudge: whenever the perpetual trades above the spot index, holding a long becomes expensive and holding a short pays you. Whenever the perpetual trades below the index, the incentive reverses. Traders arbitrage the difference, and the perp is tethered to spot by cost rather than by contract law.
Three consequences follow immediately, and they are the reason funding matters to you as a trader rather than as a piece of exchange trivia:
It is a real cost. If you hold a leveraged long through three funding settlements a day at +0.01% each, you are paying roughly 0.03% of your notional position size per day. On a 10x leveraged position that is 0.3% of your margin per day, before you have made a single trading decision. In an aggressively bullish market where funding runs at +0.10% per 8 hours, the same position bleeds about 3% of margin per day.
It is a positioning readout. Funding is not sentiment in the fuzzy survey sense. It is the price that leveraged traders are literally willing to pay to keep a directional bet on. When it goes strongly positive, longs are paying up. That is a measurable, timestamped fact about crowding, not an opinion.
It is a tradeable stream. Because funding is paid regardless of direction, a position that is hedged to zero market exposure can still collect it. That is the entire basis of the delta-neutral basis trade covered in section 6.
2. How the Funding Rate Is Actually Calculated
Most traders never look at the formula, which is exactly why most traders misread funding. The number on your screen is not a raw measure of how bullish the market is. It is the output of a specific calculation with a deliberate dead zone built into it, and understanding that dead zone tells you when funding is carrying information and when it is just sitting at its default.
The standard formula — first used by BitMEX and since adopted in near-identical form by Binance, Bybit, OKX, Hyperliquid and most other venues — is:
Premium Index (P)
A time-weighted measure of how far the perpetual is trading from the spot index, sampled continuously through the funding period (every few seconds on most venues) and then averaged. It is the component that carries all the actual market information — it rises when the perp trades at a premium and goes negative when it trades at a discount.
Interest Rate (I)
A fixed constant, conventionally 0.01% per 8-hour period (about 10.95% annualised). It represents the assumed cost difference between holding the quote currency and holding the base asset. It is not market-derived — it is a hard-coded number inherited from BitMEX's original design, and some pairs are set to 0% instead.
The clamp (±0.05%)
A damper that bounds the interest adjustment term. It stops the funding rate from whipsawing violently on brief price dislocations. Its side-effect is the "dead band" described below — the reason funding sits pinned at exactly 0.01% for long stretches of quiet market.
The cap / floor
A hard maximum on the funding rate per interval, set per contract and tied to the contract's maintenance margin at maximum leverage. Higher-leverage contracts get tighter caps. When funding pins to the cap, several exchanges shorten the settlement interval instead of letting the rate run further.
The dead band nobody tells you about
Work through the arithmetic and something useful drops out. As long as the average premium index (P) stays between −0.04% and +0.06%, the clamp exactly cancels the premium and the funding rate returns precisely the interest rate: 0.01%. Inside that band, funding tells you nothing at all. The perp is close enough to spot that the mechanism simply defaults.
This matters practically. A trader who sees "+0.01%" and concludes "the market is mildly bullish" has misread the chart. +0.01% is the resting state — the equivalent of a flat line. The information starts when funding leaves that band, because leaving the band means the premium index has pushed past the damper and the perpetual is genuinely dislocated from spot.
Interval normalisation — the most common misreading
Funding rates are quoted per settlement interval, and intervals differ across venues. Binance and Bybit settle most contracts every 8 hours. Hyperliquid settles every hour. Several exchanges now switch a contract to a shorter interval when funding hits its cap. A rate of 0.01% per 8 hours and a rate of 0.00125% per hour are the same annualised cost — but a trader comparing the two raw numbers side by side will conclude, wrongly, that one venue is eight times more expensive.
Always normalise before comparing. Multiply by the number of settlements per day, then by 365, to get an annualised figure. The baseline 0.01% per 8 hours becomes 0.03% per day and roughly 10.95% per year. That is the number to hold in your head, because it makes the cost of carrying leverage legible in the same units as any other yield.
3. Who Pays Whom — and Exactly When
The direction rule is simple and worth memorising in one line: positive funding means longs pay shorts; negative funding means shorts pay longs. The payment itself is:
That distinction is where most of the damage is done. Funding is charged on the size of your position, not the size of your deposit. Leverage multiplies the funding drag on your account in exactly the same proportion that it multiplies your directional exposure. A trader running 20x who is "only risking 5% of the account" is nonetheless paying funding on twenty times their margin.
The snapshot rule
On most centralised venues, funding is not accrued continuously. It is a snapshot: the exchange looks at who is holding what at the exact settlement timestamp, and transfers accordingly. Typical timestamps are 00:00, 08:00 and 16:00 UTC. Hold a position for seven hours and fifty-nine minutes and close it before the stamp, and you pay nothing. Open a position sixty seconds before the stamp and you pay the full interval.
This creates a small but real edge in trade timing. If you are scalping around a funding boundary with an expensive rate, closing before the snapshot and re-entering after it is a legitimate way to sidestep the charge — and conversely, deliberately being on the receiving side across the stamp is a legitimate way to collect it. Venues that pay funding hourly, such as Hyperliquid, flatten this effect considerably, which is one reason their funding profile behaves differently.
Work out what it actually costs you
Abstract percentages are easy to dismiss. Put your own numbers in and the drag becomes obvious — particularly the annualised column, which is where most traders realise they have been paying a double-digit yield to someone else all year.

Automate your trades. Let Quantum Algo trade for you.
Every signal executed on your own account — 24/7, hands-off.
4. Reading Funding as a Positioning Signal
Once you stop treating funding as a fee and start treating it as data, one question organises everything: who is paying, and how badly do they want to be there?
Price alone cannot answer that. A market can rise because spot buyers are accumulating, or because leveraged longs are piling into perpetuals. Those two rallies look identical on a candlestick chart and behave completely differently afterwards. The first has no forced sellers underneath it. The second is stacked with liquidation levels. Funding — read alongside open interest — is what separates them.
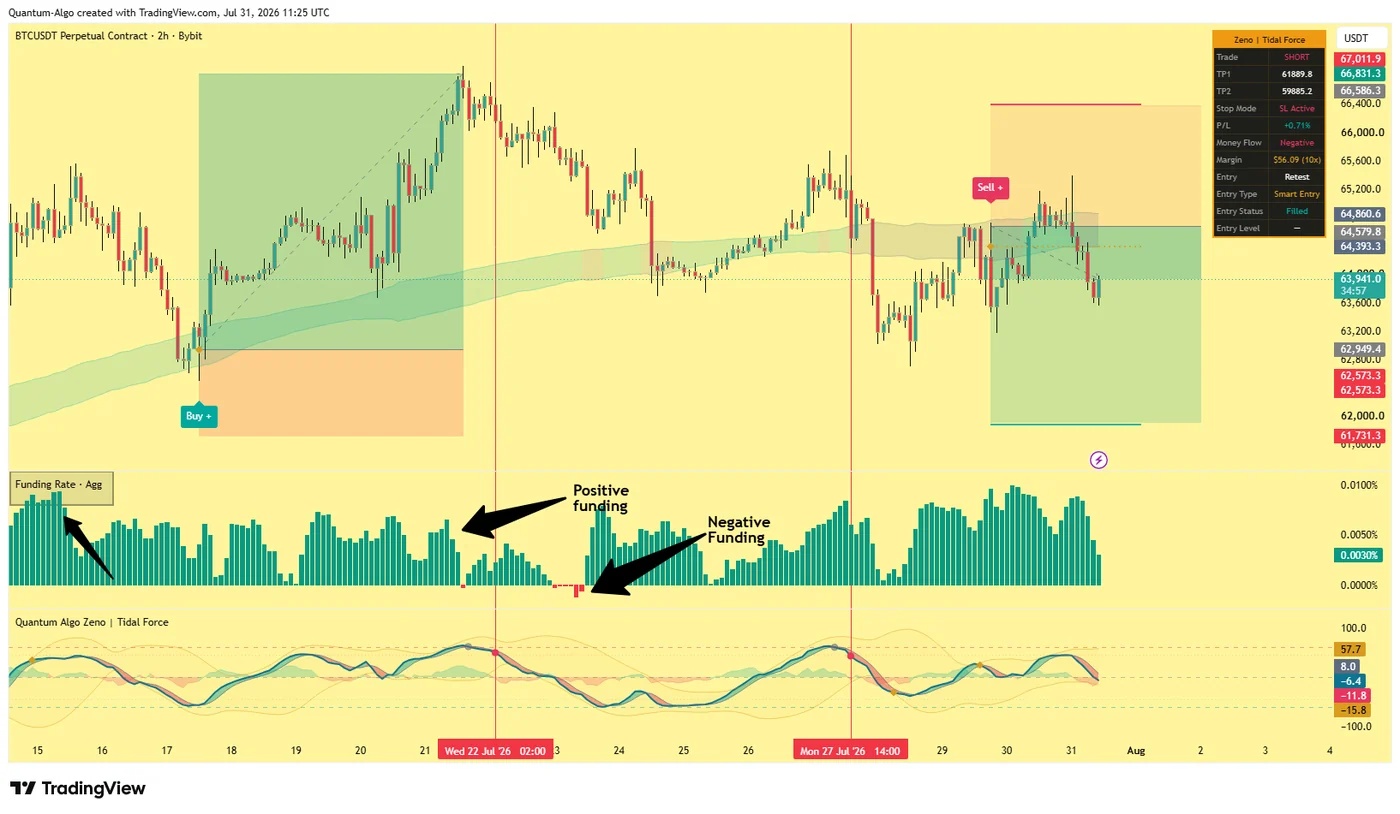
The chart above is worth studying slowly, because it shows the two regimes cleanly. Through the 17–21 July advance, funding runs persistently positive: longs are paying to hold, the perpetual is bid above the index, and the crowd is leaning one way. Then price rolls over and the histogram flips. Around 23–24 July a cluster of red bars appears — shorts are now paying longs, which means the perpetual has fallen below spot and bearish leverage has become the crowded trade. Price puts in its low within a few bars of that cluster and recovers.
That sequence is the single most useful pattern in funding analysis, and it generalises well beyond this one chart: negative funding tends to appear near local lows, not near highs. By the time shorts are willing to pay to stay short, the easy part of the move down is usually behind you.
The four regimes
| Funding | Open interest | What it means | Typical implication |
|---|---|---|---|
| Rising, positive | Rising | New leveraged longs entering and paying up | Trend intact but fuel is borrowed — squeeze risk builds |
| Falling toward zero | Falling | Longs closing or being liquidated | Positioning resetting; often a healthy pullback |
| Negative | Rising | New leveraged shorts entering and paying up | Bearish crowding — fuel for a short squeeze |
| Near zero (+0.01%) | Flat | Perp tracking spot, no crowd | No positioning edge — trade structure instead |
Two of those rows deserve extra attention because they are where traders get hurt.
Rising price with falling open interest is not accumulation — it is short covering. Positions are being closed, not opened. Rallies built on covering tend to stall once the shorts are done, because there is no new committed money behind them. When funding also normalises during such a move, you are watching a squeeze exhaust itself in real time.
Rising price with rising open interest and climbing funding is the opposite condition: genuinely new leveraged demand. It is the healthier configuration for continuation — right up until funding reaches a level where the cost of carry starts doing the selling for you.
Funding is venue-specific, and that is a feature
Each exchange computes funding from its own order book and its own index. A single venue's funding tells you about positioning on that venue. Aggregated funding — the kind shown in the chart above, and the kind published by data providers — smooths out venue quirks and is the better read on the market as a whole.
The divergences are informative in their own right. When one large venue prints deeply negative funding while the aggregate stays positive, that usually reflects a concentrated position or a localised dislocation rather than a market-wide view. Cross-venue funding spreads are the raw material of a whole class of arbitrage strategies, and even if you never trade them, noticing them stops you from over-reading a single exchange's number.
5. Funding Extremes, Squeezes and Liquidation Cascades
The reason extreme funding matters is mechanical, not psychological. Perpetual positions carry liquidation prices. When one side of the book is heavily crowded and heavily leveraged, the market above or below current price is stacked with forced orders that will execute regardless of what anybody thinks. Funding is the cleanest public proxy for that stacking.
Here is the sequence that repeats across every crypto cycle:
Crowding
Price trends. Leveraged longs pile in. Open interest and funding rise together. The perpetual trades at a growing premium to spot because perp buyers are more aggressive than spot buyers.
Carry pressure
Funding reaches a level where holding the position is expensive in its own right. Weaker hands begin closing simply to stop the bleed. Momentum flattens even without any bearish catalyst.
The trigger
A modest move against the crowd — often only 2–4% — reaches the first cluster of liquidation prices. Those liquidations are market orders. They push price further into the next cluster.
The cascade and reset
Open interest collapses, funding snaps toward zero or flips negative, and the move overshoots far beyond what the original catalyst justified. Positioning is now clean — which is precisely why such lows often hold.
Notice what the useful signal actually is. It is not "funding is high, therefore short." Funding can stay elevated for weeks in a strong trend, and traders who fade it early are the ones providing the liquidity that keeps the trend going. The signal is funding at an extreme, plus a failure of price to make further progress, plus a structural break. Crowding is the fuel; something else has to light it.
The inverse setup is arguably higher quality and less crowded, because it requires buying into fear. Deeply negative funding means shorts are paying to stay short — the market is so one-sided bearish that bears are subsidising bulls. When that coincides with price refusing to make a new low and a bullish structural shift, you have crowding, exhaustion and confirmation lining up on the long side.
Spot the exhaustion
Below: price on top, funding histogram beneath. Click the zone where the long side is most exposed — where crowding, cost and a stall in progress all line up.
Why "extreme" has no fixed number
Traders constantly ask what funding level counts as extreme. There is no universal answer, and anyone quoting one is selling certainty that does not exist. What counts as extreme is relative to that asset's own recent distribution. A rate of +0.05% per 8h is unremarkable for a low-liquidity altcoin perp and genuinely stretched for BTC. The workable approach is percentile-based: compare the current rate to its own trailing 30- or 90-day range, and treat the top and bottom deciles as your extremes.
Two practical guardrails go with that. First, funding at a cap is not a signal — it is a censored measurement, because the true premium may be far higher than the printed rate. Second, funding around scheduled events (large unlocks, index rebalances, listings) can be distorted by hedging flow that has nothing to do with directional conviction.
6. Five Ways to Trade Funding Rates
Funding supports several distinct approaches, and they are not variations on one idea — they have different risk profiles, different holding periods and different failure modes. Work out which one you are actually running before you size it.
Strategy 1 — Delta-neutral basis trade (cash-and-carry)
Buy the asset in the spot market and simultaneously short the same notional in the perpetual. Your directional exposure is approximately zero: if price rises, the spot leg gains and the perp leg loses by the same amount. What you are left holding is the funding stream. While funding is positive, the short perp leg receives it.
This is the closest thing in crypto to a yield product, and in periods of aggressive bullish leverage it has produced returns well above conventional fixed income. It is also where most of the institutional funding demand comes from, which is part of why funding tends to mean-revert: capital shows up to harvest it.
The risks are specific and worth stating plainly. Funding can flip negative, at which point you are paying rather than receiving. The short perp leg can be liquidated if it is not margined generously, even though the overall position is hedged — margin lives on one leg, gains on the other. You carry exchange and custody risk on two venues. And the spot–perp basis itself can move against you at entry or exit. Sizing the short leg with substantial excess margin is not optional here; it is the trade.
Strategy 2 — Fading funding extremes
Wait for funding to reach the top or bottom decile of its own trailing distribution, then take the contrarian side only after price confirms. Confirmation means something objective: a failure to make a new extreme, a sweep of the obvious liquidity followed by rejection, and a break of the short-term structure in your direction.
The discipline that makes this work is refusing to trade on the funding reading alone. Extreme funding identifies where the vulnerability is. It says nothing about when. Traders who skip the confirmation requirement discover that a crowded trend can stay crowded far longer than their margin lasts.
Strategy 3 — Funding-confirmed trend continuation
The mirror image, and less discussed. In a healthy trend, you actively want to see moderately positive funding with rising open interest — it confirms that new money is committing rather than that shorts are merely covering. Use funding here as a filter rather than a trigger: take your normal structural longs, but stand down when a rally is running on collapsing open interest and normalising funding, because that combination is a squeeze finishing rather than a trend beginning.
Strategy 4 — Accumulating into negative funding
Sustained negative funding on a major asset is historically uncommon and tends to cluster around capitulation. The approach is to scale into spot exposure while funding remains negative, treating each negative print as evidence that bearish leverage is still crowded, and to stop adding once funding normalises. This is a position-trading approach measured in weeks, and it demands spot exposure rather than leverage — the whole point is to be the participant who cannot be liquidated.
Strategy 5 — Funding-aware position management
The least glamorous and the most universally applicable: let funding influence how you carry trades you were taking anyway. Concretely — prefer spot or dated futures over perps when funding is expensive and your thesis is measured in weeks; take partial profit ahead of a settlement stamp when the rate is punitive; treat the daily funding cost as part of your required edge, because a swing position paying 0.1% per day needs to clear that hurdle before it makes you anything.
7. Where to Read Funding Rates
You have three practical sources, and they answer different questions.
The exchange itself gives you the number that will actually be charged to your account, along with the countdown to the next settlement and the contract's specific cap. This is the authoritative source for anything involving real money — never size a carry trade off a third-party figure without checking the venue.
Aggregators publish funding across venues side by side, along with open interest and long/short ratios. This is where you go for the market-wide read and for spotting cross-venue divergences.
Your charting platform is where funding becomes usable in the flow of actual analysis, because it puts the rate on the same time axis as price and structure. On TradingView, aggregated funding can be plotted in a lower panel underneath the perpetual chart — exactly as in the chart in section 4 — so that a funding flip and a structural break are visible in the same glance rather than in two different browser tabs.
A few setup details make a real difference:
Use the perpetual, not spot
Chart the perpetual contract (for example BTCUSDT.P) rather than the spot pair when analysing funding, so the price you are looking at is the same instrument the funding applies to. The premium between them is exactly what funding is responding to.
Match the timeframe to the interval
Reading 8-hourly settlements on a 1-minute chart produces noise. Higher timeframes — 2H, 4H and daily — align better with the settlement cadence and make regime changes legible.
Add open interest
Funding without open interest is half a picture. Plotting both in the lower panel is what lets you distinguish new crowding from a positioning reset — the single most valuable distinction in this entire guide.
Watch the zero line, not the value
Because of the dead band, the meaningful events are crossings and clusters, not absolute levels. Mark the zero line clearly and pay attention to sustained excursions rather than single prints.
One caution about backtesting. Historical funding data is often incomplete, revised, or missing for delisted contracts, and venues have changed their formulas and settlement intervals over time. A strategy backtest that assumes a constant 8-hour interval across several years will misprice reality. If funding income or cost is material to the strategy's edge, source the funding history from the venue's own API rather than a convenience dataset.
8. Test Your Knowledge
Seven questions covering funding mechanics, interpretation and strategy.
9. Combine Funding With Smart Money Concepts
Funding tells you where positioning is crowded. Smart Money Concepts tell you where the structure will break and where the liquidity that crowd represents is going to be taken. They answer adjacent questions, which is why they combine unusually well.
The practical confluence is straightforward. Extreme positive funding tells you leveraged longs are stacked; their stop-losses sit below recent swing lows, forming a pool of sell-side liquidity. A sweep of that pool followed by a market structure shift is the mechanism by which crowding turns into a move. Funding identifies that the fuel exists; structure tells you it has been lit.
• Buy/sell signals with built-in SL and TP — structural entries with risk defined before you click
• Tidal Force momentum confirmation — the oscillator shown in the section 4 chart
• Market structure mapping — BOS and CHoCH confirming when crowding starts unwinding
• Multi-timeframe confluence scoring — so an 8-hourly funding regime is read on a matching timeframe
• ATR-based risk management — position sizing that accounts for carry as well as volatility
The pairing to internalise is this: never take a trade because funding is extreme, and never ignore extreme funding when you are already in a position. The first is a way to get run over by a trend. The second is a way to be surprised by a cascade you could have seen building.
Frequently Asked Questions
A funding rate is a periodic payment exchanged directly between long and short traders in a perpetual futures market. When the rate is positive, longs pay shorts; when it is negative, shorts pay longs. Its purpose is to keep the perpetual contract price anchored to the spot index, replacing the convergence that an expiry date provides in traditional futures. The exchange takes no cut — it is a peer-to-peer transfer.
The standard formula is F = P + clamp(I − P, −0.05%, +0.05%), where P is the time-weighted average premium index (how far the perpetual traded from the spot index) and I is a fixed interest rate component, conventionally 0.01% per 8-hour period. The clamp bounds the adjustment so the rate cannot swing wildly on brief dislocations. A side effect is that whenever the premium index sits between −0.04% and +0.06%, the funding rate returns exactly 0.01%.
Neither on its own. Positive funding means leveraged longs are paying to hold their positions, which confirms bullish crowding. Moderately positive funding alongside rising open interest is consistent with a healthy trend. Extremely positive funding indicates crowding that makes the market vulnerable to a long squeeze — but only once price also stops making progress and structure breaks. Funding identifies where risk is concentrated, not when it will be released.
A negative funding rate means the perpetual is trading below the spot index and shorts are paying longs. It indicates that bearish leverage has become the crowded side. Sustained negative funding on a major asset is relatively uncommon and tends to cluster near local lows and capitulation events, because by the time shorts are willing to pay to stay short, most of the selling has usually happened.
Funding is charged on your position notional, not your margin, and is typically settled three times a day at 00:00, 08:00 and 16:00 UTC. At the baseline rate of 0.01% per 8 hours, a $10,000 position costs about $1 per settlement, $3 per day, or roughly 10.95% annualised. At 10x leverage that is around 0.3% of your margin every day. In aggressively bullish conditions where funding runs ten times higher, the same position can bleed several percent of margin per day.
On most centralised exchanges funding is a snapshot taken at the settlement timestamp, so a position closed before the stamp and reopened after it pays nothing for that interval. You can also take the receiving side, hold spot or dated futures instead of perpetuals, or run a delta-neutral position that collects funding rather than paying it. Venues that settle hourly, such as Hyperliquid, largely remove the timing effect.
Funding rate arbitrage, also called the cash-and-carry or basis trade, means buying an asset in the spot market and shorting the same notional in the perpetual. Directional exposure is close to zero, so the position earns the funding stream while funding is positive. The real risks are funding flipping negative, liquidation of the short leg if it is thinly margined, exchange and custody risk across two venues, and adverse movement in the spot–perp basis at entry or exit.
There is no universal threshold. What counts as extreme is relative to the asset's own recent distribution — +0.05% per 8h is unremarkable for a thin altcoin perpetual and genuinely stretched for BTC. The workable method is percentile-based: compare the current rate to its trailing 30- or 90-day range and treat the top and bottom deciles as extremes. Note that a rate pinned at its contract cap is a censored measurement, not a signal, because the true premium may be considerably higher than the printed number.
More guides
References & Related Guides
More in this topic
- Day Trading Crypto: A Market With No Sessions, a Clock That Still Matters, and the Trades That Fit It
- What Is Notional Value in Trading? (Notional vs Margin vs Risk + Calculator)
- Trading Profit Calculator for Forex, Crypto and Algorithmic Trading
- Open Interest Explained 2026 — Complete Guide
- Liquidation in Trading 2026 — Magnets & Purges
- Breakout Probability: Complete Trading Guide (2026)
- Day Trading Strategies 2026 — The Complete Profitable Guide
- Grid Trading Strategy: The Complete Guide (2026)
- Institutional Trading Strategy 2026: Trade Like Banks
- Mean Reversion Trading 2026 — Complete Strategy Guide
- Position Sizing: The Complete Guide (2026)
- Range Trading Strategy: Complete Guide (2026)
- Risk Management in Trading 2026 — Complete Guide
- Swing Failure Pattern (SFP): The Complete Guide (2026)
- Swing Trading Strategies 2026 — Complete Position Guide
- Trend Trading Strategy: The Complete Guide (2026)
- Scalping Trading Strategy: Complete Guide (2026)
Core reading
- Leverage Trading: The Complete Guide (2026)
- Liquidity Trading Guide 2026 — Raids & Kill Zones
- Liquidity Sweep Trading: Stop Hunts Explained (2026 Guide)
- Order Flow Trading 2026 — Read the Footprint of Institutions
- Crypto Trading for Beginners: Complete Guide (2026)
- BOS & CHoCH: Complete Market Structure Guide 2026
- All Premium Guides
- Quantum Algo on TradingView
- Public Verified Track Record