Trading Profit Calculator for Forex, Crypto and Algorithmic Trading
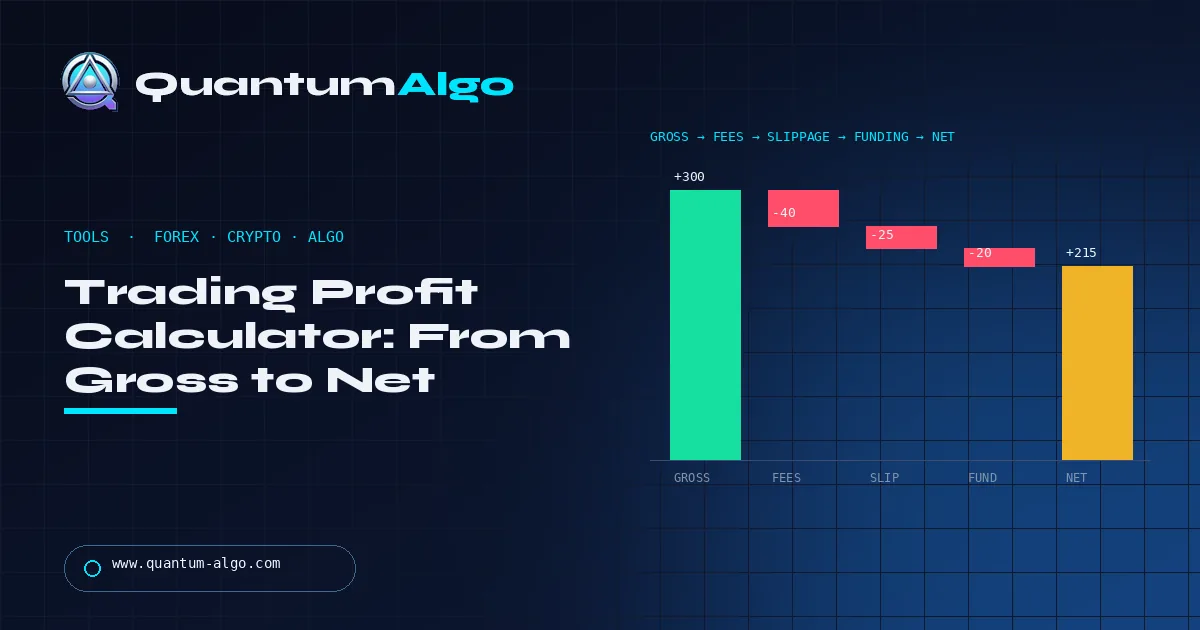
Trading profit = (exit − entry) × quantity × contract multiplier, then minus every cost: entry and exit fees, spread, slippage, funding or swap, and conversion. The calculator below shows gross and net side by side, plus return on capital, return on risk and the breakeven win rate — because a strategy that only works gross is not a strategy.
I stopped trusting “profit calculators” the day one told a subscriber his 2R trade netted 2R — after fees and a two-tick slippage it was 1.6R, and over a hundred trades that gap is the difference between a positive and a negative expectancy. This page is the calculator I wanted: forex, crypto spot and perpetuals, and algorithmic fills, with every assumption visible. Quantum Algo’s ledger is published net of the same frictions, which is why the numbers survive verification.
Indicators that prove themselves in public.
One engine, four precision tools — the Gold (XAU) Scalper, the institutional Gravity Zone, the Zeno momentum Oscillator, and Zeno Stocks for equities.
Why must a profit calculator show its assumptions?
A trading profit calculator is only useful when it distinguishes a mathematical price difference from the cash result that reaches the account. Forex and crypto products have different units, contract sizes, fee schedules, funding mechanisms, and settlement conventions. An algorithm adds another layer: order timing, partial fills, latency, and code behavior.
A profit calculator therefore has to show gross P&L, estimated trading costs, net P&L, percentage return on capital, and reward-to-risk. It should not present a single large profit number without identifying the assumptions behind it.
What is the trading profit formula?
For a long position:
gross P&L = (exit price − entry price) × quantity × contract multiplier
For a short position:
gross P&L = (entry price − exit price) × quantity × contract multiplier
For spot crypto, quantity may be coins and the multiplier is usually 1. For a futures contract, quantity may be contracts and the multiplier defines the cash value of one price unit. For forex, the pip-value method may be easier to communicate, but the underlying price-difference formula remains valid when units and currency conversion are correct.
How do you calculate net profit after costs?
net P&L = gross P&L − entry fee − exit fee − spread cost − slippage cost − funding/swap − conversion cost
Fees can be percentage-of-notional, per contract, or a mixture. Funding can be positive or negative. Spread cost is not always a separate line item at a broker because it is embedded in execution prices; a calculator should still make the assumption visible.
Forex example: 50,000 EUR/USD
Buy 50,000 EUR/USD at 1.0800 and exit at 1.0850. The move is 50 pips. With a 0.0001 pip size, gross P&L is 50,000 × 0.0050 = $250 in a USD account. If the entry and exit spread assumption totals 0.8 pip, subtract $4. If commission is $3 per side, subtract $6. Before swap, estimated net P&L is $240.
The result changes if the account is in EUR or if the broker charges commission per million notional. A good calculator should ask for account currency and fee model rather than assuming USD.
Crypto spot example: 0.40 BTC
Buy 0.40 BTC at $62,000 and sell at $64,500. Gross P&L is 0.40 × $2,500 = $1,000. If the exchange charges 0.10% on both sides, estimate entry and exit fees from each notional value. If the position was funded with borrowing, subtract interest; if it was a perpetual future, subtract or add funding payments according to the funding rate and holding interval.
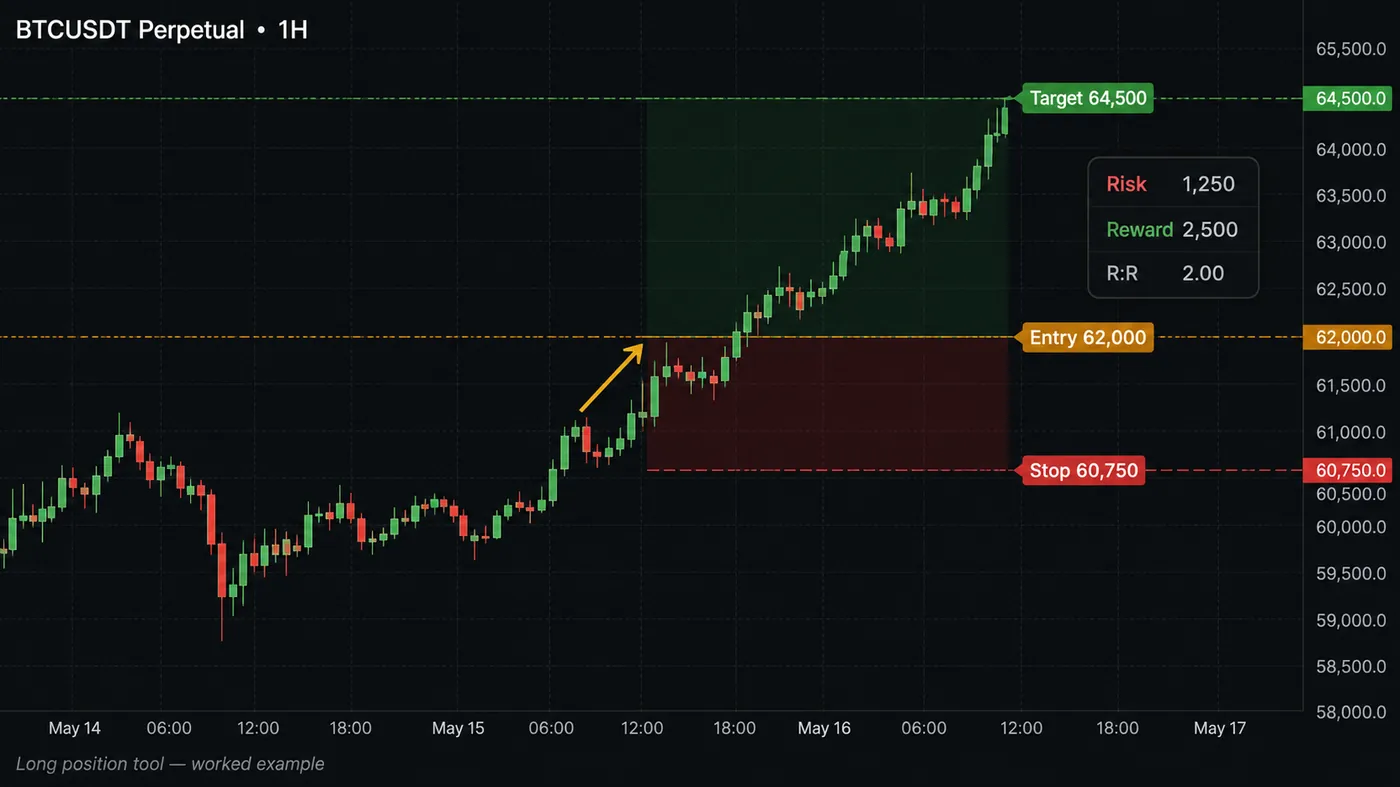
Crypto prices trade continuously, and the displayed last price may differ from the fill. Use bid/ask or a slippage assumption for planning.
Algorithmic-trading example: 100 shares
An algorithm buys 100 shares at $50 and exits at $51.20. Gross P&L is $120. The backtest must then model commission, estimated slippage, spread, and the fill timing. If the signal is calculated at the close but the order is filled at the next bar’s open, the result is not the same as filling at the signal close. TradingView’s strategy documentation explains that broker-emulator settings, order timing, slippage, and commissions affect simulated results.
Return on capital vs return on risk: which matters?
Return on capital is:
net P&L ÷ capital committed × 100
Return on initial risk is:
net P&L ÷ initial cash risk
These are different. Leverage can make return on capital look large while the account is exposed to a small change in price. Always show the cash risk and the notional value alongside percentage return.
How do costs change reward-to-risk?
If the stop is 30 pips and the target is 60 pips, the nominal reward-to-risk is 2:1. After costs, it may be lower. A good calculator should use net target profit divided by net stop loss, with both calculations using the same contract and conversion assumptions.
| Output | Formula |
|---|---|
| Gross profit | Favorable price move × quantity × multiplier |
| Gross loss | Adverse price move × quantity × multiplier |
| Net profit | Gross profit − all costs |
| Return on capital | Net profit ÷ capital committed |
| Reward-to-risk | Net target ÷ net stop |
| Breakeven move | Total costs ÷ value per price unit |
What is expectancy, and why is it the number that matters?
An algorithmic trading calculator should support a batch of trades. A useful first metric is expectancy: expectancy = (win rate × average win) − (loss rate × average loss). Use net, cost-adjusted wins and losses. A strategy with a 40% win rate can be positive if its average win is sufficiently larger than its average loss; a strategy with a 70% win rate can lose money if losses are large or costs are ignored. Report the distribution, not just the average. Median trade, worst day, maximum losing streak, and tail losses show whether the mean is being carried by a few outliers.
How do you build an equity curve and measure drawdown?
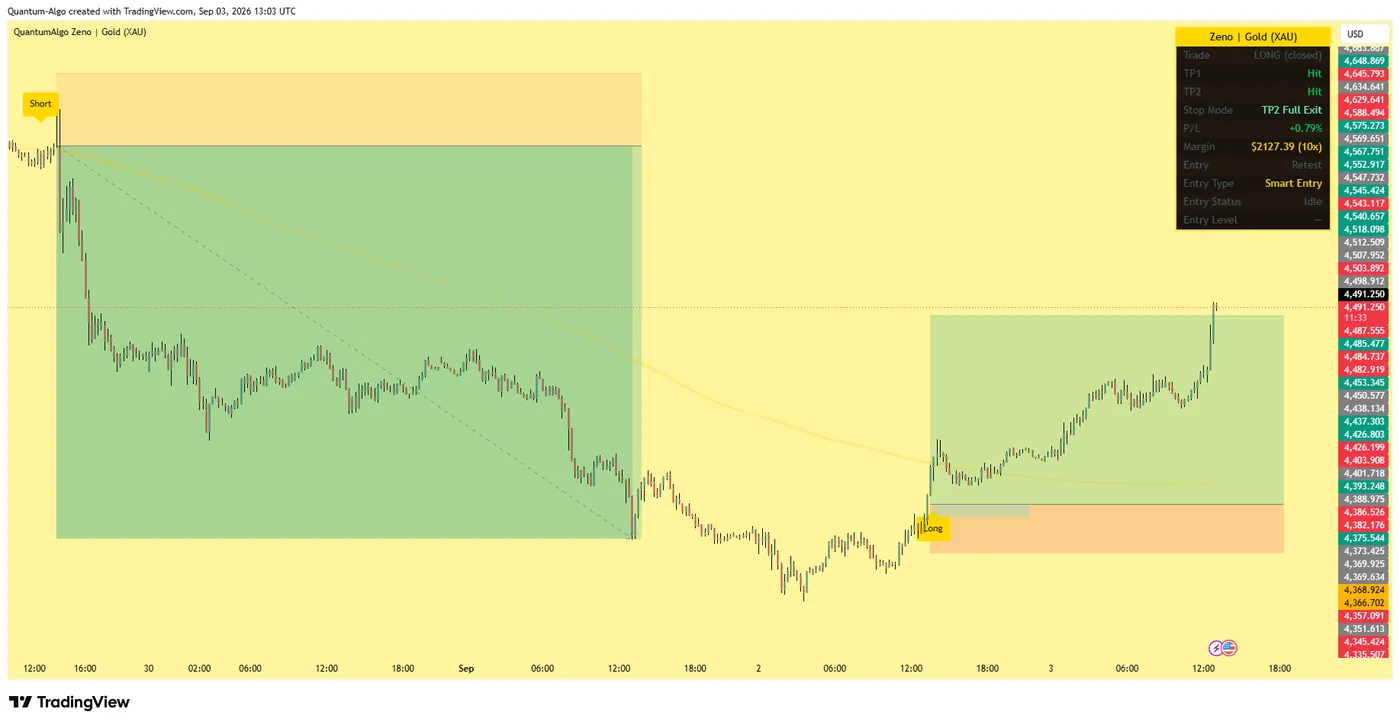
The calculator can turn a sequence of net trade results into an equity curve. Drawdown is the decline from a previous equity peak to a subsequent trough. Show maximum drawdown, average drawdown, recovery time, and the number of trades needed to recover. A backtest that produces a high return with a drawdown the trader cannot tolerate is not a usable plan.
For position sizing, run the same strategy at several risk fractions. A 0.25% risk model and a 2% risk model may have the same percentage expectancy but radically different drawdowns and risk of ruin. The tool should make this visible without implying that larger risk is better.
Why run a Monte Carlo test on your trade results?
Historical order is one possible sequence. A simple Monte Carlo test shuffles or resamples net trades to estimate how drawdown and losing streaks could vary. It does not create new market data or guarantee a probability distribution for the future. It is a stress test for sequence risk. Include a warning that resampling assumes the historical trade sample is representative and that regime changes can break that assumption.
How do funding, swaps and carrying costs work?
Forex swaps are commonly applied at a broker-defined rollover time. Crypto perpetual funding may be charged several times per day. Futures incur financing through the contract structure and roll. A holding-period input should therefore be part of the calculator. If the rate is unknown, allow a manual estimate and display it prominently.
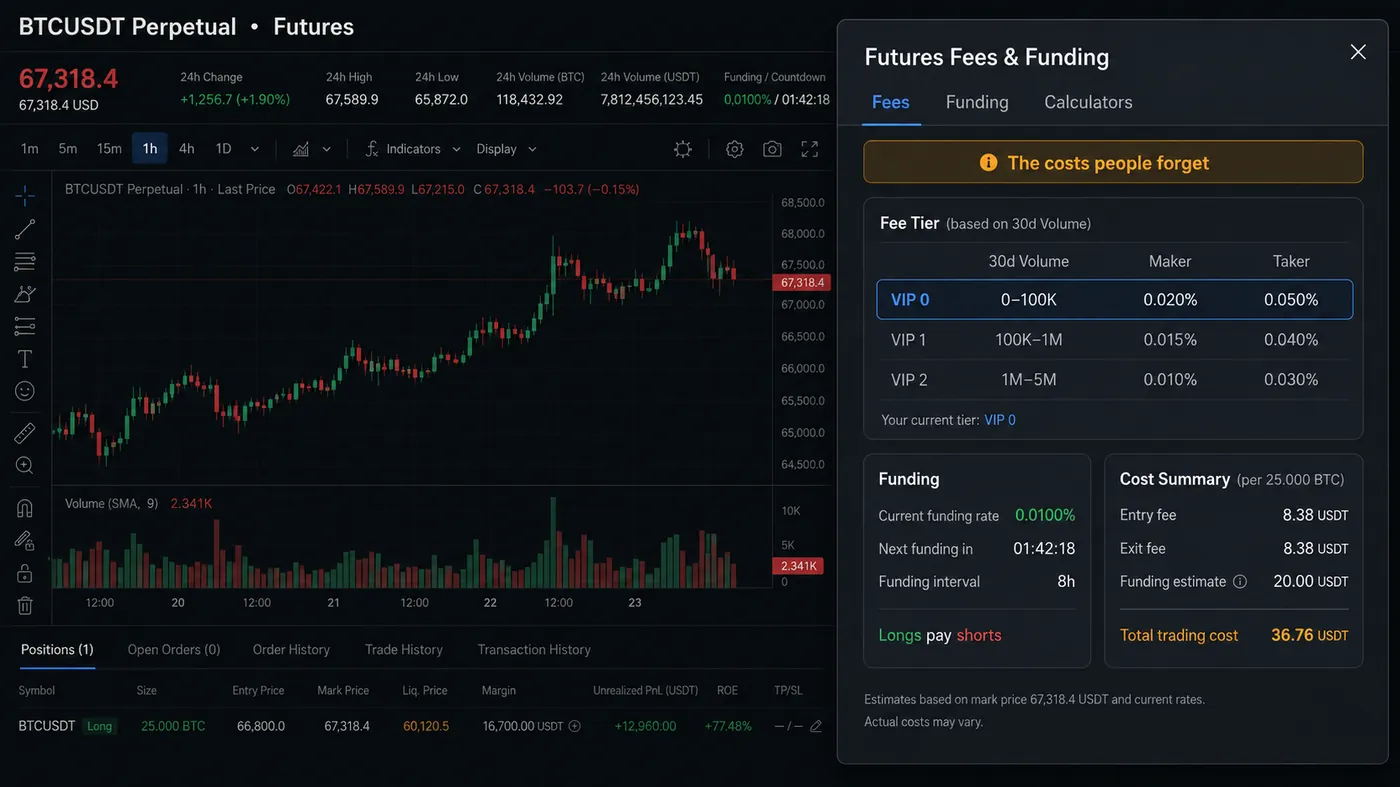
For a long crypto perpetual, a positive funding rate may mean longs pay shorts; for a short, the sign reverses. The exact convention depends on the venue. A calculator should ask the user for the signed rate and the interval rather than hard-code a universal rule.
Why a scenario table beats one profit figure
| Scenario | Entry | Exit | Quantity | Gross | Costs | Net |
|---|---|---|---|---|---|---|
| Base | Assumed | Assumed | Planned | Formula | Normal costs | Net estimate |
| Worse fill | Same signal | 1 tick worse each side | Same | Lower | Higher slippage | Stress net |
| Wider spread | Same | Same | Same | Same | +spread | Stress net |
| Partial fill | Mixed | Mixed | Filled only | Sum fills | Per-fill fees | Net realized |
A scenario table is more informative than one expected-profit figure. It helps readers see whether a strategy has enough margin to survive normal execution friction.
What is the breakeven win rate?
Ignoring costs, the breakeven win rate for a fixed reward-to-risk ratio R is 1 ÷ (1 + R). At a 1:2 risk-to-reward ratio, the theoretical breakeven is 33.3%. Once spread, fees, slippage, and funding are included, the required win rate is higher. A good calculator should display both theoretical and cost-adjusted thresholds.
How do you calculate the break-even price?
For a long spot position, break-even is the entry price plus total costs divided by quantity and multiplier. For a short, it is entry price minus that amount. In practice, fees may depend on notional, so solve iteratively or calculate fees at the expected exit. A simplified estimate is adequate for education, but a production tool should use the exchange’s fee schedule.
Which profit-calculation mistakes are most common?
- Confusing notional with capital: a leveraged trade can control more value than the cash posted.
- Using last price instead of executable bid/ask: this understates entry and exit friction.
- Ignoring funding: crypto perpetuals can pay or receive funding repeatedly.
- Mixing pips and points: price-unit conventions differ by product.
- Forgetting partial fills: each fill can incur a fee and different slippage.
- Backtesting at the signal close: the live order may fill later.
- Showing gross only: net results are what matter for a decision.
- Applying a universal tax rate: tax treatment is jurisdiction-specific.
Gross P&L is a price difference; net P&L is what reaches the account after fees, spread, slippage, funding and conversion. Judge trades by return on risk after costs and strategies by expectancy per trade, remember that costs raise the breakeven win rate, and run a scenario table (base, worse fill, wider spread, funding shock) before you trust any single profit number.
◆ Interactive check
Do you calculate net, or just gross?
Questions traders ask about profit calculators
Leverage increases the notional exposure available for a given margin, so it can increase both profit and loss. It does not create an edge or reduce risk.
Yes. Percentage fees usually apply to both sides, while some brokers charge per side or round turn. Enter the broker’s schedule.
Only if you add the option’s contract multiplier, premium, and assignment/settlement rules. Do not use a simple spot formula for options without those fields.
Check bid/ask, fee tier, conversion rate, contract multiplier, funding, rounding, and the exact fill prices.
Pips moved × pip value (in your account currency) gives gross profit. Convert the quote-currency result at the current rate when it differs from your account currency, then subtract spread, commission and swap. Our pip value calculator handles the conversion step.
Gross = (exit − entry) × coins. Fees = (entry price + exit price) × coins × fee rate when both sides are charged the same tier. Add slippage per side and any funding paid on perpetuals, then subtract everything from gross.
Most edges that survive costs sit between 1.3R and 2.5R average net reward-to-risk. Quantum Algo’s public ledger reports 75% wins across 160 closed signals; the relevant number is expectancy per trade after costs, not the best trade.
Check bid/ask versus last price, the fee tier and whether commission is per side or round turn, the contract multiplier, funding or swap timestamps, conversion rate and the exact fill prices. Rounding rarely explains a large gap; fills usually do.
Futures work if you enter the contract multiplier (e.g. $50 per point for ES). Options need the premium, contract multiplier and settlement rules, so a spot formula is not enough — use the multiplier field only for linear products.
Yes. QuantumBot executes Zeno’s signals on your own exchange account with the position size you define, and the fills, fees and funding are the real ones from the exchange — which is why the published ledger is net, not theoretical.
References & Related Guides
Read next
- Monte Carlo Simulation for Trading: Drawdown, Risk of Ruin and Position Size
- What Is Notional Value in Trading? (Notional vs Margin vs Risk + Calculator)
- Pip Value Calculator for All Forex Pairs
- Trading Calculator: Position Size & Risk
- Risk Reward Ratio Calculator
- What Is Slippage in Trading?
- Funding Rate Trading Guide
- Leverage Trading: Complete Guide
- Backtesting Trading Strategies
- Trading Journal: Complete Guide
Authoritative sources
- CME Group: calculating futures profit or loss
- Wikipedia: expected value (expectancy)
- SEC: margin — borrowing money to pay for stocks
- Binance: fee schedule (maker/taker)
- Bybit: introduction to funding rates