Trend Trading
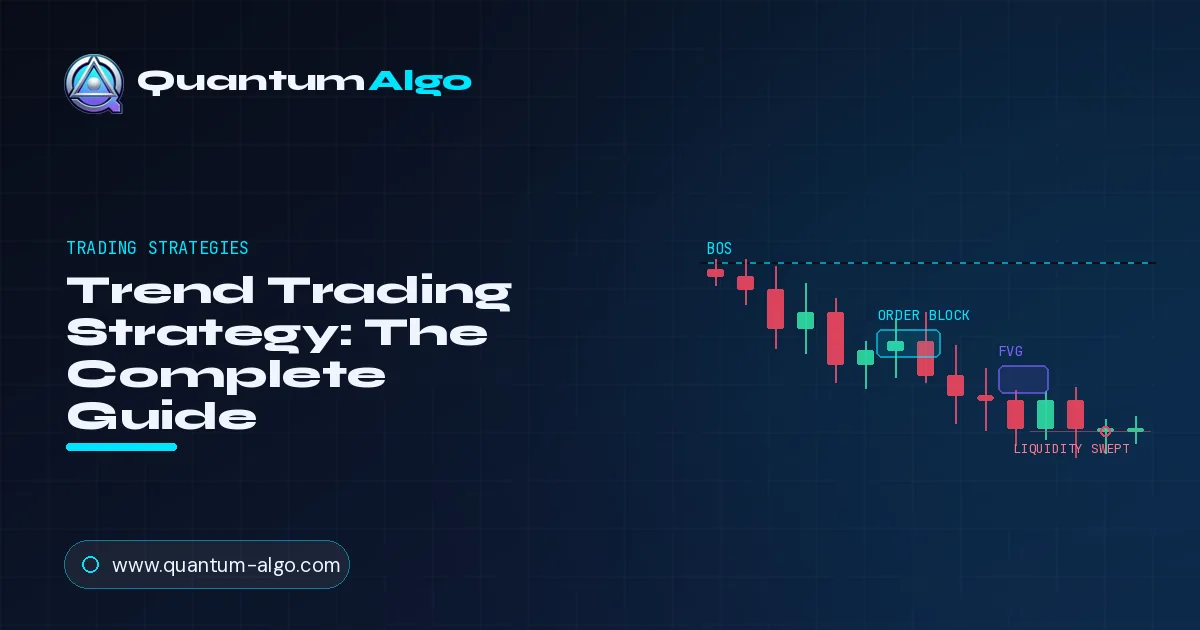
Trend trading is a strategy that identifies the market's dominant direction and trades with it until the trend structure breaks, instead of predicting tops and bottoms. An uptrend is higher highs and higher lows; a downtrend is lower highs and lower lows. Trend traders enter on pullbacks, confirm strength with moving averages or ADX, and let winners run.
What is trend trading?
Trend trading, often used interchangeably with trend following, is one of the most enduring and profitable approaches to markets. Its premise is beautifully simple: identify the direction the market is already moving, and trade in that direction until it stops. Rather than trying to pick tops and bottoms — guessing when a move will reverse — the trend trader accepts the trend as it is and aims to ride the bulk of it.
This rests on one of the three pillars of technical analysis: that price moves in trends, and a trend in motion is more likely to continue than to reverse. The trend trader exploits this tendency directly. In an uptrend, they look to buy; in a downtrend, they look to sell; and they hold the position as long as the trend’s structure remains intact.
The philosophy is famously captured in the trader’s adage ‘the trend is your friend.’ What makes trend trading distinctive is its acceptance of uncertainty: the trend follower does not need to know how far a move will go or exactly when it will end.
They simply commit to staying with the trend, cutting losses quickly when they are wrong, and letting winners run when they are right — a discipline that, applied consistently, can produce a small number of outsized gains that outweigh many small losses.
Is the market in an uptrend, a downtrend or a range?
Before you can trade with the trend, you have to correctly identify which of three states the market is in. This is the single most important skill in trend trading, because the entire strategy depends on it. Use the interactive tool below to see the structure that defines each state.
The definitions come down to market structure — the sequence of swing highs and lows. An uptrend is a series of higher highs and higher lows; a downtrend is a series of lower highs and lower lows; a range is sideways oscillation between horizontal support and resistance with no clear progression. This distinction is not academic: trend-following strategies thrive in trends and get chopped to pieces in ranges.
A trader who applies pullback-buying logic to a choppy range will suffer a string of small losses as price whipsaws back and forth. Correctly recognising that the market is ranging — and either switching to a range strategy or simply standing aside — is as important as recognising a trend. The first question a trend trader asks on any chart is therefore not ‘where do I enter?’ but ‘is there even a trend to trade?’
How do you measure the strength of a trend?
Not all trends are equal. A strong, orderly trend is a trend trader’s dream; a weak, choppy one is a trap. Beyond simply reading structure, several tools help gauge how much conviction is behind a trend and whether it is worth committing to.
Moving averages are the classic trend gauge: when price is trading above a rising moving average, the trend is up, and the slope of the average reflects the trend’s momentum. Many trend traders use two moving averages and treat the shorter staying above the longer as confirmation of a healthy uptrend.
The ADX is purpose-built to measure trend strength regardless of direction: a high and rising ADX signals a strong trend worth following, while a low ADX warns that the market is directionless and trend strategies will struggle. Tools like the Supertrend combine trend direction and volatility into a single visual signal.
The key insight is that these indicators are best used to filter — to confirm that a strong, tradeable trend exists before you look for an entry — rather than as standalone signals. A trend trader who only engages when structure and a strength filter agree avoids the single biggest drain on trend strategies: getting repeatedly chopped up trying to follow a trend that is not really there.
Trend trading tools at a glance
| Tool | What it shows | How trend traders use it |
|---|---|---|
| Swing structure | Higher highs and lows, or lower highs and lows | Defines the trend; a break warns it is ending |
| Moving averages | Average price and the slope of that average | Price above a rising average confirms an uptrend |
| ADX | Trend strength regardless of direction | Filter: high and rising means a trend worth following |
| Supertrend | Trend direction combined with volatility | A single visual read of the current direction |
| Fibonacci retracement | How deep a pullback has run into the prior leg | Marks where a pullback entry may hold |
| Momentum divergence | New price highs that momentum fails to confirm | Early warning that the trend may be exhausting |
◆Use these to filter and confirm structure, not as standalone signals.
Why is buying pullbacks the best trend entry?
Once a healthy trend is confirmed, the question becomes when to enter. The worst approach is to chase — buying after a big up-move, right before a pullback. The best approach, and the heart of trend trading, is to buy the pullback: wait for price to retrace against the trend to a logical support, then enter as it resumes in the trend direction.
Pullback entries are superior for two reasons. First, they give you a far better price — you buy the dip rather than the peak — which means a tighter stop and a better reward-to-risk. Second, they let the market prove the trend is still intact: if the pullback holds at a higher low and price turns back up, the uptrend has confirmed itself. The art is in identifying where the pullback is likely to end.
- Wait for the retracement. Let price pull back against the trend rather than chasing the extension.
- Identify the support. Look for the pullback to reach a logical level — a rising moving average, a Fibonacci retracement, a prior structure level, or an order block.
- Wait for confirmation. Enter as price shows it is resuming the trend — a bullish rejection candle, a minor structure shift back up, or a break of the pullback’s minor trendline.
- Place the stop below the higher low. Your invalidation is a break of the higher low; if price makes a lower low, the uptrend structure is damaged.
This pullback-entry method aligns naturally with Smart Money Concepts, where the pullback into a discount order block within an uptrend is a textbook high-probability long.
How do you ride a trend without exiting too early?
Entering well is only half of trend trading; the real money is made in the management. The defining challenge — and the hardest psychological test in trading — is holding a winning position long enough to capture the meat of the trend, resisting the constant temptation to take a small profit too early.
The professional approach is to let the trend’s own structure dictate the exit. Rather than setting a fixed target and closing the whole position, trend traders often trail their stop behind each new higher low (in an uptrend), so the position stays open as long as the trend keeps making higher lows and is only closed when that structure breaks. This lets a single trade ride an entire multi-leg move.
A common refinement is to take partial profit at a logical level — banking some gains and reducing risk — while letting a ‘runner’ portion continue with a trailing stop to capture any extended move. The mantra that governs all of this is ‘cut losses short, let winners run.’ Trend following is often a low-win-rate strategy: you may lose on more trades than you win, taking many small losses when trends fail to materialise.
It is profitable because the winners, ridden properly, are far larger than the losers. This is why the discipline to hold a winner — and to trail rather than prematurely exit — is the single most important habit a trend trader can build.
What are the signs that a trend is over?
Every trend eventually ends, and knowing how to recognise the change is what protects your profits and keeps you from overstaying. The trend trader does not try to predict the exact top or bottom — that is a fool’s errand — but instead watches for objective evidence that the trend’s structure has broken.
The clearest signal is a break of market structure. In an uptrend defined by higher highs and higher lows, the first warning is a failure to make a new higher high, followed by a break below the most recent higher low. That sequence — a change of character in Smart Money terms — is the market telling you the uptrend’s structure has been violated.
Other confirming signs include momentum divergence (price making new highs while momentum fades), a decisive break of a long-standing trendline or moving average, and a sharp expansion in volatility after a long, orderly trend, which often marks exhaustion.
The practical response is not necessarily to reverse and trade the other way immediately — the first break of structure can be a deep pullback rather than a full reversal — but to tighten stops, take profit on remaining trend positions, and stand aside until a new trend establishes itself. Protecting the gains a trend has given you is just as important as capturing them in the first place.
How do you align trend trades across timeframes?
Trends exist on every timeframe, and they are nested inside one another — an uptrend on the daily chart is made up of smaller uptrends and downtrends on the hourly. This fractal nature is both the great opportunity and the great trap of trend trading, and managing it is what separates coherent trend traders from confused ones.
The essential principle is alignment. The most powerful, lowest-risk trend trades occur when timeframes agree: the higher timeframe defines the dominant trend and your bias, and you use a lower timeframe to time entries in that same direction.
When the daily is in an uptrend, you drop to the 4-hour or 1-hour to find pullback entries to go long — you do not short the lower-timeframe pullbacks, because that means fighting the dominant daily trend. The classic beginner error is to see a downtrend on the 5-minute chart and short it, oblivious to the raging daily uptrend that is about to reassert itself and stop them out.
The fix is always to establish the higher-timeframe trend first and trade only in its direction on the lower timeframe. This top-down alignment does more than improve your win rate; it keeps you positioned with the largest force in the market rather than against it, which is the entire point of trend trading.
When a lower-timeframe entry aligns with a higher-timeframe trend, you get a tight entry on a move backed by the weight of the bigger picture.
What are the strengths and weaknesses of trend trading?
Trend trading is one of the most proven approaches in markets, but it is not effortless money, and understanding its trade-offs helps you apply it with realistic expectations. Its strengths are significant. It captures the largest moves — a single well-managed trend trade can outperform dozens of small scalps. It aligns you with the market’s dominant force rather than against it, which is inherently higher-probability.
It requires less precise timing than reversal trading, since you are joining an established move rather than calling a turn. And its ‘let winners run, cut losses short’ structure produces the positive skew — occasional large wins — that underpins many of the most successful trading careers in history.
Its weaknesses are just as real. Trend trading performs poorly in ranging, choppy markets, which can persist for long stretches and generate a demoralising series of small losses. It is often a low-win-rate strategy, which is psychologically difficult — you must endure being wrong more often than right, trusting that the winners will more than compensate. Entries are, by design, not at the absolute bottom or top, so you give up some of every move.
And the discipline it demands — holding winners through pullbacks, cutting losers without hesitation, standing aside in ranges — runs directly against human instinct, which is to take profits quickly and hold losers hoping they recover. The traders who succeed with trend following are those who accept these trade-offs and build the discipline to follow the rules through the inevitable losing streaks, because the strategy’s edge only materialises over a long series of trades.
What trend trading mistakes should you avoid?
- Trading trends in a range. Applying pullback-buying logic to a choppy, directionless market produces a string of small losses. Confirm a real trend exists first.
- Fighting the trend. Trying to short a strong uptrend or buy a strong downtrend — picking tops and bottoms — is the fastest way to lose. Trade with the dominant force.
- Chasing the move. Entering after a large extension, rather than waiting for a pullback, means a worse price, a wider stop, and buying right before a retracement.
- Taking profits too early. Grabbing small wins destroys the strategy’s math, which depends on letting winners run to outweigh the losers. Trail behind structure instead.
- Ignoring the higher timeframe. Trading a lower-timeframe trend against the dominant higher-timeframe trend is a classic trap. Always align with the bigger picture.
- Overstaying after structure breaks. Refusing to exit when the trend clearly changes character hands back hard-won profits. Respect the break of structure.
◆ Test Your Knowledge
Trend Trading with Quantum Algo
Trend trading is simple in theory and hard in practice, because the biggest edge — staying with the trend and exiting when structure breaks — requires reading structure objectively. Quantum Algo’s Smart Money Concepts tools mark every higher low, lower high and break of structure in real time, so you can hold winners with confidence and step aside the moment the trend genuinely turns.
Related guides
◇ Frequently Asked Questions
Trend trading, or trend following, is a strategy that identifies the market's dominant direction and trades in that direction until the trend ends. Instead of predicting tops and bottoms, it rides the bulk of a sustained move, buying uptrends and selling downtrends.
They are largely the same and often used interchangeably. Both trade in the direction of the prevailing trend and hold until it reverses. 'Trend following' sometimes emphasises longer-term, systematic approaches, but the core philosophy is identical.
Read market structure: an uptrend makes higher highs and higher lows, a downtrend makes lower highs and lower lows, and a range oscillates sideways between support and resistance. Moving averages and the ADX help confirm the trend's direction and strength.
Buying pullbacks. Rather than chasing an extended move, wait for price to retrace to a logical support in an uptrend and enter as it resumes upward. This gives a better price, a tighter stop, and confirmation that the trend structure is still intact.
The clearest signal is a break of market structure — in an uptrend, a failure to make a new higher high followed by a break below the last higher low. Momentum divergence, a break of a major moving average, and volatility spikes also warn of a trend ending.
Because many attempted trend trades fail when a trend does not materialise, producing small losses, and because ranges chop up trend entries. It remains profitable because the winners are ridden much larger than the losers, giving a positive overall expectancy.
Let the trend's structure guide the exit rather than a fixed target. Trail your stop behind each new higher low in an uptrend so the position stays open while the trend continues, often taking partial profit along the way and letting a runner capture extended moves.
Moving averages show direction and momentum through their slope, the ADX measures trend strength regardless of direction, and tools like the Supertrend combine direction and volatility. They are best used as filters to confirm a tradeable trend exists before entering.
Yes. Trends exist on every timeframe and are nested within each other. The most reliable approach aligns them: establish the dominant trend on a higher timeframe and time entries on a lower timeframe in that same direction, never against it.
Because its discipline runs against human instinct. People take profits too early, hold losers hoping they recover, chase extended moves, and try to pick tops and bottoms against the trend. Success requires cutting losses fast and letting winners run through pullbacks.
References & Related Guides
More in this topic
- Backtesting Trading Strategies — Complete Guide
- What Are the Best Indicators for Day Trading?
- What Are the Best Indicators for Scalping?
- What Are the Best Indicators for Swing Trading?
- Best TradingView Strategy — The Definitive Guide
- Breakout Probability: Complete Trading Guide
- Breakout Trading Strategy: Complete Guide
- Day Trading Strategies — The Complete Profitable Guide
- Gap Trading Strategy: Complete Guide
- Grid Trading Strategy: The Complete Guide
- Institutional Trading Strategy: Trade Like Banks
- Position Sizing: The Complete Guide
Core reading
- BOS & CHoCH: Complete Market Structure Guide
- Order Blocks Trading: Complete Guide
- Best TradingView Indicators — Complete Guide
- Risk Management in Trading — Complete Guide
- Candlestick Patterns Guide — Engulfing, Pinbar & More
- All Premium Guides
- Quantum Algo on TradingView
- Public Track Record