AI Chart Analyzer: A Structured Smart Money Read of Any Chart, and What an Analyzer Can Actually See
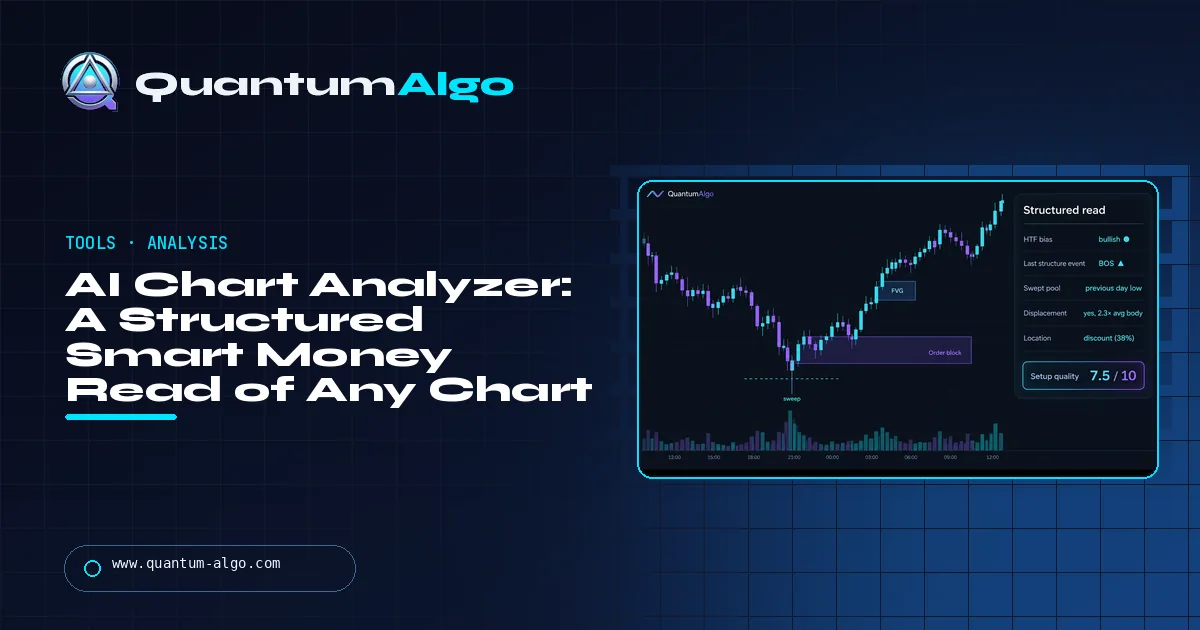
An AI chart analyzer is only worth using if it reads the chart in a trader's order (higher-timeframe bias, structure event, swept liquidity, displacement and imbalance, location and target) with a yes, a no or a number for each. This page's analyzer does that from eight questions, scoring setups out of ten: A-grade at 7.5+, no trade under 4.
"AI chart analyzer" is what people search when they want a second opinion on a chart before they click. Most of what answers that search names a candlestick pattern and calls it analysis. This page gives you the real thing: the five-part structured read an experienced Smart Money trader runs on every chart, a tool that builds it from eight questions and scores the setup, and a clear account of what vision-model analyzers can and cannot see.
Indicators that prove themselves in public.
One engine, four precision tools — the Gold (XAU) Scalper, the institutional Gravity Zone, the Zeno momentum Oscillator, and Zeno Stocks for equities.



What can an AI chart analyzer actually do?
An AI chart analyzer is a tool that takes a chart — as a screenshot, a data feed or a set of answers about it — and returns a structured reading: the trend, the levels, the setup, sometimes a trade plan. The good ones are checklists with a language model or a rules engine behind them; the bad ones are image classifiers that name a candlestick pattern and call it analysis. The difference is whether the tool reads the chart in the order a trader would — structure, then liquidity, then displacement, then location and target — or starts from whatever shape it recognises.
This page does three things. It explains what a structured Smart Money read consists of, so you can judge any analyzer, including the ones that upload screenshots to a vision model. It gives you a working analyzer: eight questions about the chart in front of you, a written read and a setup score, built on the same rules Zeno uses on the chart. And it is honest about the limits — what an analyzer can see, what it cannot, and why the score is a filter rather than a signal. If you came here from an "AI trade analyzer" search expecting a prediction, the can AI predict the stock market answer is the place to start.
What goes into a structured Smart Money read?
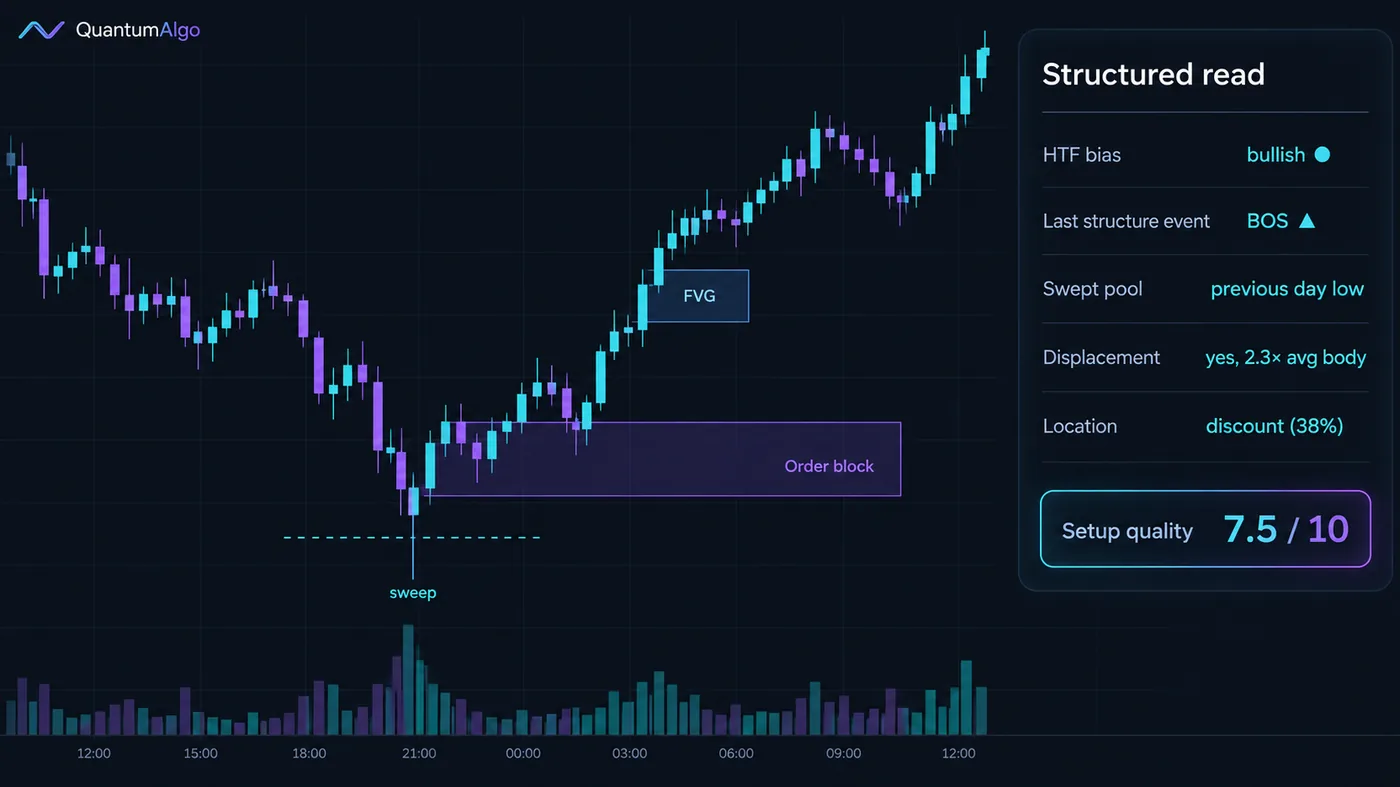
Every experienced Smart Money trader runs the same read on every chart, and it takes about eight seconds once it is habit. Written out, it has five parts, in this order:
- Higher-timeframe bias. One timeframe above the entry chart: is the sequence of swings making higher highs and higher lows, lower highs and lower lows, or neither? This decides the only direction you will trade. Everything else is conditional on it.
- Last structure event. On the entry chart, was the last decisive move a break of structure with the bias (continuation) or a change of character against it (a pause, or at an extreme, a reversal)? If neither has happened, there is no setup yet.
- Liquidity. Was an obvious pool just swept — the previous day's or session's extreme, equal highs or lows — or only a minor swing (which is inducement), or nothing? A move without a sweep is a breakout, and breakouts without stops behind them fail more often.
- Displacement and imbalance. Did a candle with a body at least twice the recent average leave a fair value gap or come from an untested order block? That candle is the confirmation and it creates the entry reference.
- Location and target. Is price in discount for a long or premium for a short, and how far is the opposing pool from a stop beyond the sweep, in R? Location decides the size; the target decides whether the trade is worth taking at all.
A read that reports those five things with a yes, a no or a number for each is an analysis. A read that says "bullish engulfing, RSI oversold, consider a long" is a description. The difference is the whole value of the tool.
In what order should an analyzer read a chart?
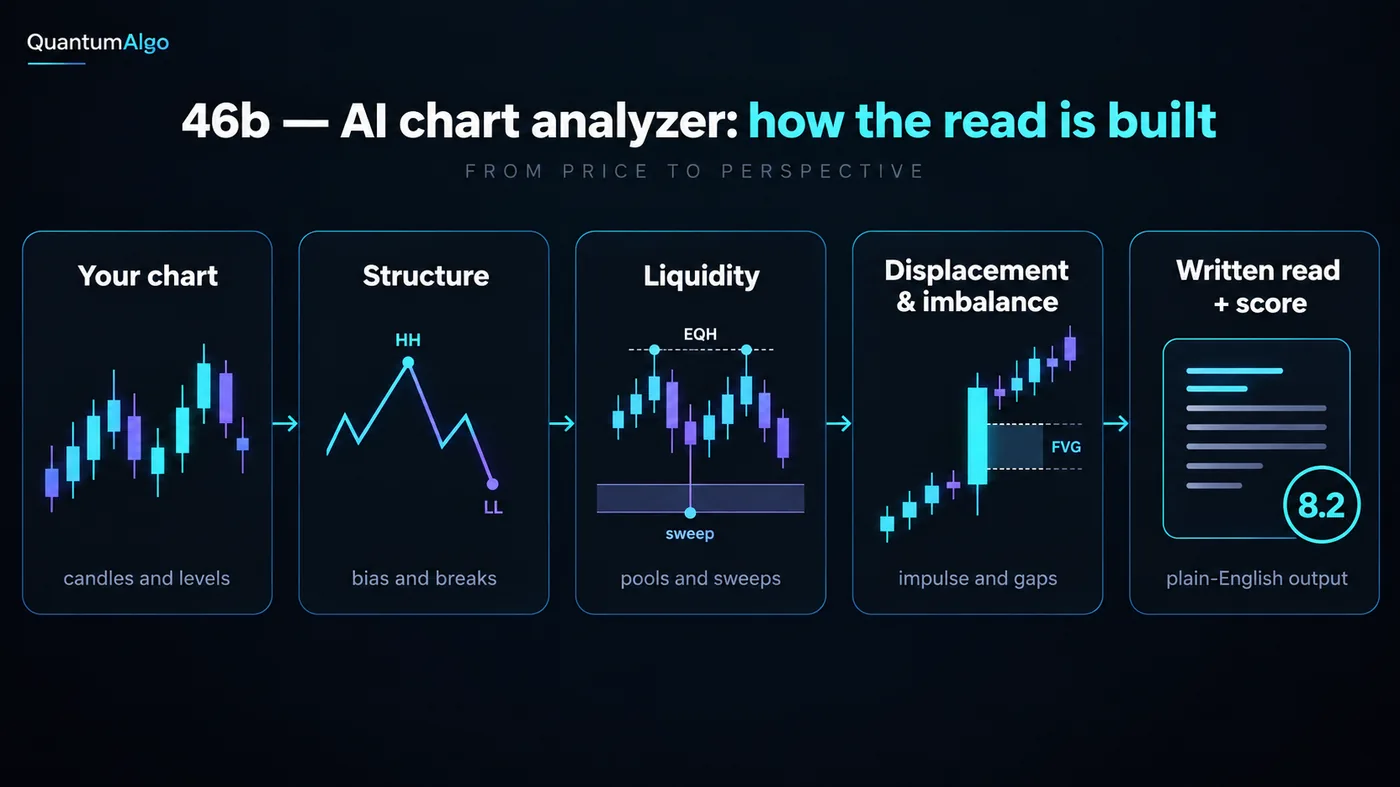
The analyzer below is a rules engine, not a vision model: you answer the eight questions from the chart, it applies the same weights a disciplined trader would, and it writes the read. That is deliberate. A screenshot uploaded to a general-purpose vision model can identify a trend and a few levels, but it cannot reliably tell a sweep from a breakout, or displacement from a news spike, because those depend on candle bodies relative to recent averages and on what happened three candles earlier — things a picture shows badly and a trader reads instantly. Asking you for the eight facts and doing the reasoning transparently produces a better read than guessing them from pixels, and it teaches the read at the same time.
The weights are simple and visible in the result: bias and a swept pool count most, displacement and the structure event next, location, session and reward-to-risk after that. A perfect chart scores ten. Most good trades score seven to eight; most losing trades, honestly scored, would have come in under six. That is the point of scoring before entering rather than after.

Automate your trades. Let Quantum Algo trade for you.
Every signal executed on your own account — on your account, with the plan you define.
Chart analyzer
Look at the chart you are about to trade and answer from it — the higher-timeframe bias, the last structure event, where price sits in the range, what was swept, how big the displacement candle was, what it left behind, the session and the distance to the opposing pool. The read updates as you answer.
What does each setup score grade mean?
| Score | Grade | What it means | What to do |
|---|---|---|---|
| 7.5 – 10 | A | Bias, sweep, displacement and an entry reference all present, in the right location and session, with a target worth the stop | Full size; limit at the gap midpoint or block edge, stop beyond the sweep, half off at the first pool |
| 6 – 7.4 | B | One piece missing or borderline — no sweep, a partial displacement, no fresh imbalance, or the wrong location or session | Half size, or wait for the missing piece (a deeper retrace, the killzone, a cleaner candle) |
| 4 – 5.9 | C | Two or more pieces missing, or both the sweep and the displacement absent | Watch. Set an alert at the level that would complete the read |
| Under 4 | — | The read fails on bias, liquidity or displacement | No trade, whatever the candle pattern looks like |
Scores are a filter, not a signal. An A-grade setup still loses a third of the time — that is what a 60–65% win rate at 2R means — and the score's job is to stop you taking the C-grade ones that turn a profitable method into a losing one. Log the score with every trade and, after fifty, compare the results by grade. The journal guide has the column for it.
What can vision models see on a chart screenshot?
Several products now let you upload a chart image and return an "AI analysis". Tested on the same charts, they are good at three things — naming the trend, marking obvious horizontal levels, and describing the last few candles — and unreliable at the four things a Smart Money read depends on: whether a level was swept or broken (needs the close relative to the level and what followed), whether a candle is displacement (needs the average body over the previous twenty candles), whether a gap is fresh or already filled (needs the sequence), and where price sits in the higher-timeframe range (needs a timeframe the screenshot does not show). They also cannot see volume unless it is on the image, and they will confidently invent a reading for a chart with no setup at all, because they are built to answer, not to abstain.
That is why the analyzer on this page asks rather than looks. If you use an upload tool, use it for the first two steps — bias and levels — and run the last three yourself. The how to use AI for trading guide covers prompting a model to do a structured read properly, and the AI indicators guide covers what "AI" means on a TradingView indicator, which is usually a lot less than the name.
Reference data
| Item | Value |
|---|---|
| The five parts of a structured read | HTF bias · last structure event · swept pool · displacement and imbalance · location and target |
| Displacement threshold | Candle body ≥ 2× the 20-bar average body, closing in the top or bottom quarter |
| Sweep vs breakout | Sweep: through the level by a small margin and back inside within 1–3 candles; breakout: keeps going, retests from the other side |
| Inducement | A minor swing taken before the real pool — entering on it makes you the liquidity |
| Location | Long in discount (lower half of the HTF range), short in premium |
| Minimum target | ≥ 2R to the opposing pool for full size; 1.3–2R half size; under 1.3R pass |
| Score weights | Bias 2 · structure 2 · sweep 2 · displacement 1.5 · location 1.5 · imbalance 1 · target 1 · session 0.5 (of 12, scaled to 10) |
| Expected outcome by grade | A: ~60–65% at 2R+ · B: ~50% · C and below: negative expectancy |
Worked example: the same chart, two reads
EUR/USD, 5-minute, 08:25 UTC. A vision-model upload returns: "Bullish trend on the 5-minute; support at 1.0840; a bullish engulfing candle suggests upside continuation; consider a long with a stop below 1.0835 and a target at 1.0870." Plausible, and wrong in the way that costs money — the 5-minute "trend" is two candles old, 1.0840 is the Asian range low that was just swept, and the engulfing candle is the displacement that matters, but nothing in the read says so.
The structured read of the same chart: HTF bias (1-hour) bullish, higher lows since the previous day. Last structure event: a 5-minute break of structure at 08:20 when the displacement candle closed above the last lower high at 1.0846. Liquidity: the Asian range low at 1.0840 and yesterday's low at 1.0831 were both swept at 08:15. Displacement: nineteen pips, three times the average body, leaving a gap from 1.0841 to 1.0845. Location: discount of the daily range. Session: London killzone. Target: the Asian high at 1.0862, 1.25R from a stop at 1.0826, then yesterday's high at 1.0879, 2.3R. Score 8.5, A-grade. Entry: limit at 1.0843, the gap midpoint. The trade is the same one the upload suggested; the read is the reason to take it at full size, and the reason you would have known not to on a day when the sweep was missing.
What mistakes do traders make with chart analyzers?
- Taking the analyzer's trade plan without the structural read that justifies it. A plan without a sweep and displacement behind it is a guess with a stop.
- Trusting a screenshot model on sweeps and displacement. It cannot measure candle bodies against a recent average or see the sequence.
- Running the analyzer on the entry chart for the bias. Bias comes from one timeframe up, always.
- Scoring after the trade. The score exists to stop the C-grade entries; it is worthless in hindsight.
- Treating an A-grade score as a promise. It is a 60–65% proposition with a 2R target, not a certainty.
- Letting a candle-pattern name override a missing piece. "Bullish engulfing" is a description of one candle; displacement is a measurement.
- Running the read outside the killzones and wondering why the sweeps fail.
The analyzer, Zeno and the free indicators
The eight questions are the eight things Zeno marks on the chart automatically — bias from the higher-timeframe structure, the last break or change of character, the swept pool, the displacement candle and the gap or block it left, the premium-discount position and the session — on confirmed candles, so the read does not change after the fact. The analyzer is the read written out; Zeno is the read drawn. The free SMC engine marks structure and order blocks if you want to run the questions against a chart before subscribing, and the session indicator answers the killzone question. The Smart Money Concepts guide is the long form of every line in the read.
Analyse the chart in the right order — bias, structure, liquidity, displacement, location — and write down a yes, a no or a number for each. The analyzer does that from eight answers and scores the result; A-grade setups are taken at full size, B at half, C are watched, and anything under four is not a trade however the candles look. Let uploads find the trend and the levels; do the measuring yourself, and log the score so the journal can tell you which grades pay.
◆ Interactive check
Do you know what an analyzer should check first?
Questions traders ask about AI chart analysis
A tool that takes a chart — as an image, a data feed or a set of answers about it — and returns a structured reading of trend, levels and setup, sometimes with a trade plan. The useful ones are rules engines or language models that follow a trader's checklist in order; the rest are pattern classifiers that name a candle shape. Judge one by whether it reports bias, the last structure event, the swept pool, displacement and location separately, each with a yes, a no or a number.
Partly. Vision models can name the trend, mark obvious horizontal levels and describe the last few candles. They are unreliable at whether a level was swept or broken, whether a candle is displacement relative to the recent average, whether a gap is fresh, and where price sits in the higher-timeframe range, because those depend on sequence, averages and a timeframe the image does not show. Use uploads for the first two steps and measure the rest yourself.
It asks eight questions about the chart in front of you — higher-timeframe bias, last structure event, position in the range, what was swept, the displacement candle's size against the 20-bar average, what it left behind, the session and the distance to the opposing pool — applies fixed weights, and writes a five-part Smart Money read with a score out of ten. It runs entirely in your browser; nothing is uploaded.
Full size at 7.5 or above (A-grade), half size or wait at 6 to 7.4 (B), watch with an alert at 4 to 5.9 (C), and no trade under 4. A-grade setups still lose about a third of the time at a 2R target; the score removes the low-grade entries that turn a positive method negative, it does not predict any single trade.
No. A signal tells you to buy or sell; a read tells you what is on the chart and how complete the setup is. The read can produce a trade plan — entry at the gap midpoint, stop beyond the sweep, target at the opposing pool — but only after the structural checks pass. Treat any analyzer that outputs a plan without showing the checks as a signal service with a new name.
Any that expose the checklist: what timeframe the bias came from, which level was swept, how displacement was measured. General-purpose language models with a well-written prompt do a reasonable structured read from a description of the chart; screenshot tools are best for trend and levels. The most reliable "analyzer" remains an indicator that measures on confirmed candles — displacement, sweeps, structure — because it does not guess.
Yes. The five-part read is market-agnostic: structure, liquidity, displacement and location behave the same on EUR/USD, NQ, BTC and a large-cap stock. What changes is the session question — London and New York killzones for forex, futures and crypto; the first and last ninety minutes of the cash session for stocks.
The measurable parts — structure breaks, sweeps, displacement, gaps, premium and discount — are exactly what Zeno and the free SMC engine mark on the chart on confirmed candles. The judgement parts — whether the sweep was of a pool that matters, whether the location justifies the size — are what the analyzer's questions make you answer. Automate the measurement; keep the judgement.
Because bias read from the entry chart flips several times a day and produces the classic mistake of shorting a 5-minute lower low inside a 1-hour uptrend. One timeframe up — 1-hour for a 15-minute entry, 4-hour for a 1-hour entry — is the timeframe whose structure the entry chart is retracing within.
A sweep goes through the level by a small margin, fills the stops beyond it, and comes back inside within one to three candles, usually followed by displacement the other way; a breakout keeps going and retests the level from the other side. The read treats a sweep as the fuel for a reversal or continuation and a breakout as a level to retest — the same candle, two different trades.
References & Related Guides
Read next
- Can AI Predict the Stock Market?
- How to Use AI for Trading
- AI Trading Indicators on TradingView
- Smart Money Concepts Explained
- Displacement Trading
- Liquidity Sweep Trading
- Higher Timeframe Bias
- Premium vs Discount
- Trading Journal Guide
- Institutional Order Flow (Academy)
- Free SMC Engine
- Zeno — the premium engine
Primary sources
- Quantum Algo: Smart Money Concepts explained
- Quantum Algo: displacement trading guide
- Quantum Algo: liquidity sweep trading guide
- Quantum Algo: can AI predict the stock market?