SMT Divergence
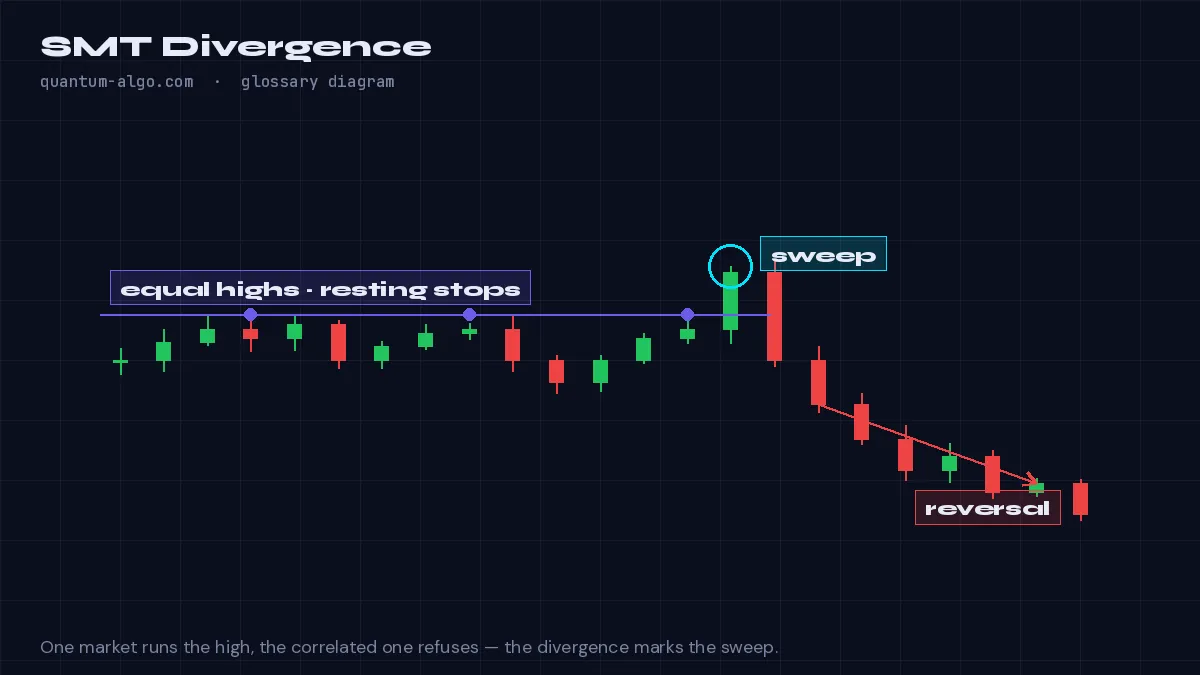
SMT divergence is when two correlated markets fail to confirm each other — one makes a new high or low and the other does not — signalling that the move is a liquidity run rather than genuine strength, and a reversal is likely.
What it means
SMT divergence (Smart Money Technique) compares two instruments that normally move together — EURUSD and GBPUSD, ES and NQ, BTC and ETH — at a swing point. If one prints a higher high while its pair prints a lower high, the market that made the new extreme has most likely run liquidity rather than expressed real demand. The divergence is the tell that smart money is on the other side.
The logic is institutional: large participants cannot lift every correlated market at once, so a run through one market's high that the other refuses to follow is engineered rather than organic. ICT teaches SMT as a confirmation for reversals at killzone highs and lows; Smart Money Concepts traders use it as a filter on liquidity sweeps.
SMT is a timing tool, not a standalone trade. It is strongest when it appears at a higher-timeframe point of interest — an order block, a fair value gap, the top of a dealing range — and when the divergent leg is itself a liquidity sweep with displacement away from it.
How to identify it on a chart
- Put two correlated charts side by side on the same timeframe.
- At a swing high or low, check whether both made the new extreme.
- If one did and the other did not, the divergence is on; wait for a change of character in the non-confirming market.
Worked example
ES prints a new session high at 09:45; NQ fails to exceed its 09:15 high. Both then close below their 5-minute higher lows — the SMT flagged the ES high as a liquidity run, and the short in either index targets the session low.
See it on the chart, read it in depth
Frequently asked questions
Which pairs work for SMT divergence?
Highly correlated pairs: EURUSD/GBPUSD, ES/NQ, BTC/ETH, DXY against any major (inverse), gold and silver. The correlation must be real for the divergence to mean anything.
Is SMT the same as regular divergence?
No. Regular divergence compares price with an oscillator on one chart; SMT compares two prices on two charts. Both signal non-confirmation, but SMT reads a second market rather than a derived indicator.
How often does SMT fail?
Frequently in strong trends, where the leading market keeps running while the laggard catches up later. Trade it only with structure confirmation and inside a higher-timeframe context.
Can an indicator detect SMT automatically?
Yes — a script can request the correlated symbol and compare swing highs and lows; our SMT divergence guide covers the logic and the free scripts that implement it.
Related terms
See SMT Divergence on your TradingView chart
Zeno reads Smart Money structure across timeframes and prints the entry, stop and targets — with a public record of every posted trade. The free indicators draw the concepts this page defines.