The Repainting Scam
Scroll through TradingView's public indicator library and you'll find hundreds of indicators claiming 85%, 90%, even 95% accuracy. The charts look incredible — nearly every signal is a perfect entry. Most of them are repainting. And most users don't know the difference until they've already lost money.
What Repainting Actually Means
A repainting indicator changes its past signals after the fact. In real time, it might show a buy signal on candle 50. But by candle 55, it recalculates and moves that signal to candle 48 — a better entry. The historical chart now shows a "perfect" entry that never actually existed when you were trading. Some indicators go further: they delete losing signals entirely and only show winners on the historical chart.
How to Test Any Indicator
The Replay Test (most reliable): Open TradingView Replay on any date. Play forward bar by bar. Screenshot every signal as it appears. Exit Replay. Compare your screenshots to the current chart. If any signals moved, disappeared, or new ones appeared — it repaints.
The Real-Time Test: Add the indicator to a live chart. Take screenshots every hour for a full trading day. The next day, compare your screenshots to the chart. Any changes = repainting.
The Settings Test: Check if the indicator has a "Repaint" toggle in settings. Some developers include this option. If the setting exists, the indicator definitely can repaint.
Why Non-Repainting Matters for Backtesting
If an indicator repaints, every backtest result is a lie. The signals shown on the historical chart are not the signals that existed in real time. This means win rates, profit factors, and R-multiples are all inflated. A repainting indicator showing 80% win rate might actually perform at 40-50% in live trading.
Quantum Algo is verified non-repainting. Every signal confirms on candle close and never changes. Our published backtests represent actual real-time performance — independently verifiable using Replay mode.
How Repainting Indicators Deceive You
A repainting indicator retroactively modifies its historical signals based on new price data. On a historical chart, it appears to have called every major turn perfectly — creating an illusion of extraordinary accuracy. But in real-time trading, the signals you see on the current candle may shift, disappear, or change direction once that candle closes and new data arrives. You enter a trade based on a signal that subsequently vanishes from the chart, leaving you in a position that the indicator no longer supports.
The most insidious form of repainting is delayed confirmation repainting. The indicator shows a signal on bar N, but the signal only becomes permanent after bar N+2 or N+3 confirms it. On historical charts, this appears as a timely signal on bar N. In real time, by the time the signal is confirmed on bar N+3, the optimal entry is long gone and the risk-to-reward ratio has deteriorated significantly. Vendors who advertise "90% accuracy" almost always use this delayed confirmation mechanism — the signals are technically accurate, but only in hindsight.
Testing for Repainting: A Step-by-Step Protocol
You can test any indicator for repainting using a simple protocol that takes less than five minutes. Step 1: Add the indicator to a live chart on any active market (crypto works well because it trades 24/7). Step 2: Screenshot the chart, noting the position and direction of the most recent signals, particularly the signal on the current (unclosed) candle. Step 3: Wait for 2–3 candles to close. Step 4: Compare the current chart with your screenshot. If any signals have moved, changed color, or disappeared, the indicator repaints.
A more thorough test uses TradingView's bar replay feature. Activate bar replay, advance candle by candle through a period of price action, and note each signal as it appears on the most recent candle. Then compare these notes with the final chart after all candles have closed. Any discrepancies confirm repainting. This bar-replay method catches even subtle forms of repainting that the screenshot method might miss, including delayed-confirmation repainting where signals appear to shift by just one or two candles.
Why Genuine Non-Repainting Indicators Have Lower Advertised Win Rates
A non-repainting indicator must commit to its signal at the moment the candle closes — no retroactive adjustments allowed. This means the signal is generated with incomplete information about what comes next, which naturally produces a lower win rate than a repainting indicator that has the benefit of hindsight. A 55–65% win rate on a non-repainting indicator is genuinely excellent and reflects a real statistical edge. Do not be discouraged by these seemingly modest numbers — they represent the actual, tradeable performance you will experience in live markets.
The real measure of an indicator's value is not its win rate alone but its expectancy: (win rate × average win) – (loss rate × average loss). A non-repainting indicator with 55% wins averaging 2R and 45% losses averaging 1R produces an expectancy of (0.55 × 2) – (0.45 × 1) = 0.65R per trade. Over 100 trades, that is 65R of profit — an exceptional result that no repainting indicator can honestly claim to replicate in live trading.
Building a Complete Non-Repainting Trading System
A non-repainting indicator provides reliable signals, but transforming those signals into a complete trading system requires additional rules for context, entry timing, risk management, and trade management. The system architecture should include: Signal generation (the non-repainting indicator identifies a potential setup on candle close), Structural filter (only trade signals that align with the higher-timeframe trend direction), Confluence check (does the signal coincide with an order block, FVG, or other institutional level?), Position sizing (calculate lot size based on the structural stop distance and your per-trade risk percentage), and Exit rules (partial take-profit at the first structural target, trail the remainder).
Crucially, the system must be backtested exclusively on non-repainting data. This means you cannot use the indicator's historical signals for your backtest — those signals are only valid if you verified them in real time or through bar replay. The only honest way to backtest a non-repainting system is to walk through historical data using TradingView's bar replay, recording each signal as it appears on the live edge candle, then tracking its outcome. This forward-testing approach gives you the true, unbiased performance statistics that reflect what you will experience in live trading.
Combining Non-Repainting Signals with SMC Framework
The most effective use of a non-repainting indicator is as a confirmation layer within a broader SMC framework rather than as a standalone signal generator. Your primary analysis uses SMC structural concepts to identify high-probability zones (order blocks, FVGs, liquidity levels). The non-repainting indicator then provides an objective, binary confirmation at those zones: either the indicator agrees with your structural thesis (take the trade) or it disagrees (skip the trade).
This combined approach captures the best of both worlds: the contextual depth of SMC structural analysis plus the objectivity and repeatability of a mechanical indicator signal. The SMC framework ensures you are only looking at zones with genuine institutional significance. The non-repainting indicator ensures you are not entering based on subjective pattern interpretation that may be colored by hope, fear, or recency bias. Together, they create a robust decision-making framework that is both intellectually sound and psychologically manageable.
Key Takeaways
Understanding non-repainting indicators on TradingView provides a meaningful addition to your trading toolkit, but the real value emerges only when you integrate these concepts with a structured methodology like Smart Money Concepts. No single indicator, pattern, or analytical concept produces consistent profitability in isolation. The concepts covered in this guide become powerful when they serve as one layer in a multi-confirmation system that includes higher-timeframe directional bias, institutional zone identification, and disciplined risk management.
The most important practical step is to backtest before you trade live. Take the concepts from this guide and apply them to historical price data using TradingView's bar replay feature. Walk through at least 50 setups, recording the entry, stop, target, and outcome for each. This backtesting exercise accomplishes two things: it builds your pattern recognition for the specific setup types discussed in this article, and it gives you empirical data on the setup's actual performance — win rate, average R:R, and maximum drawdown — that you can use to make informed decisions about incorporating it into your live trading plan.
Your Next Steps
Now that you have a solid understanding of building reliable trading systems with verified non-repainting tools, the next step is implementation. This week, dedicate 30 minutes per day to chart markup practice focused specifically on the concepts covered in this guide. Use the daily and 4-hour charts of your primary trading assets. Mark every relevant setup you can find, then track how price interacts with those levels over the next few sessions. This deliberate practice builds the visual pattern recognition that eventually becomes automatic during live trading.
After two weeks of chart markup practice, begin incorporating these setups into your demo trading or your live trading with minimal position sizes. Start with your single highest-conviction setup type and trade only that setup for 30 consecutive trades. After 30 trades, review your journal data: which setups produced the best R:R? Which sessions were most productive? Which assets showed the cleanest patterns? Use this data to refine your approach, eliminate underperforming variants, and concentrate on the specific combinations that your data shows work best for your trading style and market.
Finally, remember that mastery is a journey measured in months and years, not days and weeks. The traders who achieve lasting success are the ones who commit to continuous improvement through consistent practice, honest self-assessment, and evidence-based refinement. Every session of chart markup, every journaled trade, and every weekly review compounds your skill and brings you closer to the level of unconscious competence where profitable trading becomes second nature. Stay patient, stay disciplined, and trust the process.
In summary, the non-repainting verification should be the first test you apply to any indicator, before evaluating features, win rate claims, or pricing. A repainting indicator provides an illusion of accuracy that collapses in live trading. A non-repainting indicator provides honest, real-time signals that can be backtested, validated, and traded with confidence. This single criterion — does the indicator repaint? — separates tools that help you from tools that deceive you. Never skip this test, regardless of how impressive the marketing or how many positive reviews the indicator has received.
What a Non-Repainting Indicator Looks Like
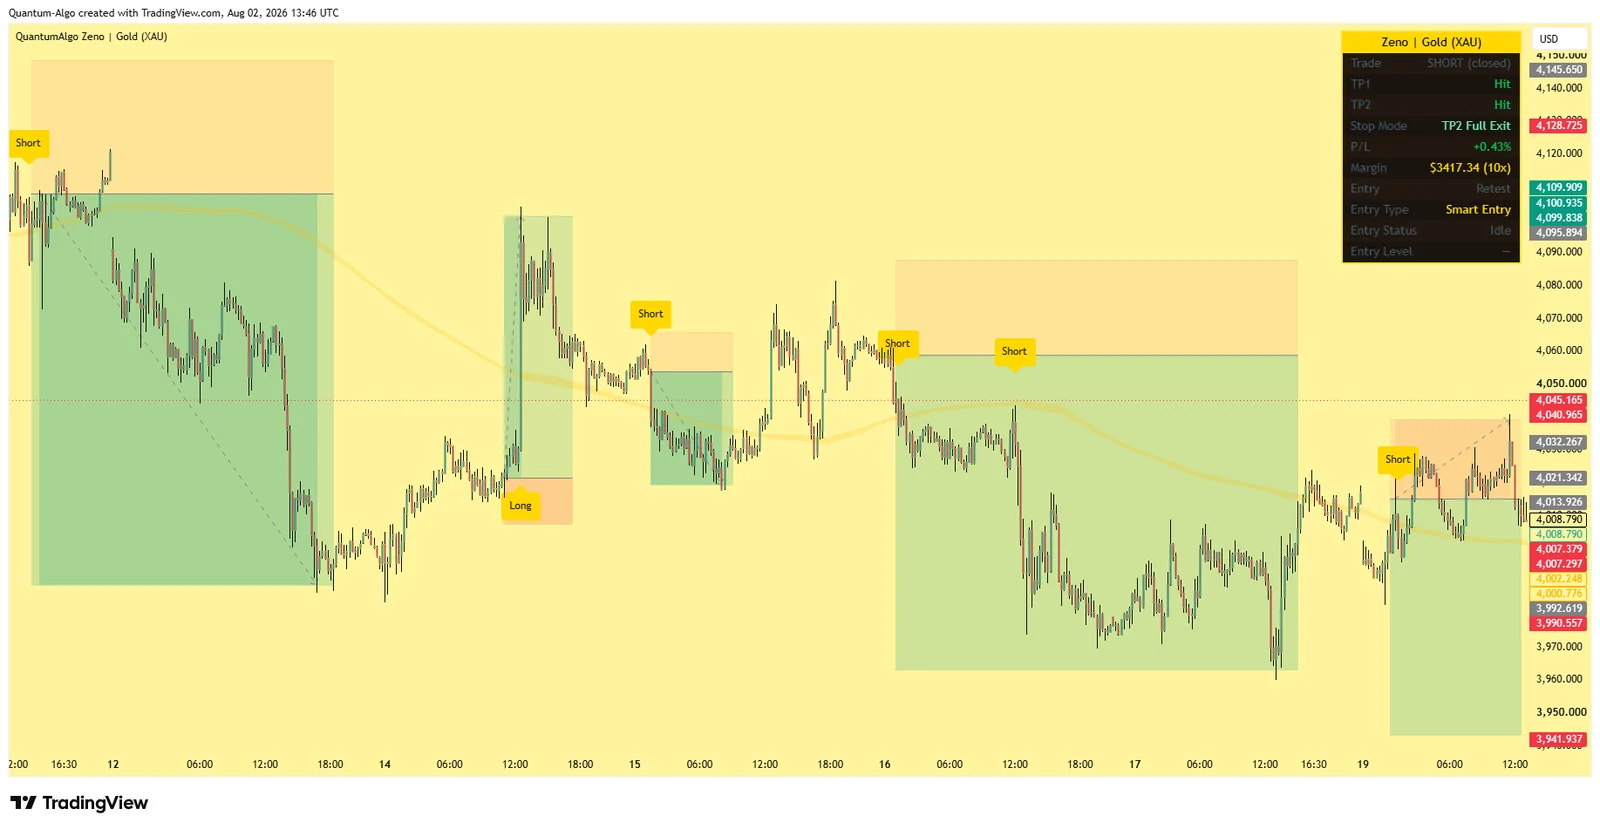
Claims are cheap. What matters is whether historical signals still sit where they were printed — with their stops and targets intact — long after the bar closed. Below is Zeno on gold, showing completed trades whose levels were drawn at signal time and never moved.
Repainting vs non-repainting, on the same candle
A repainting indicator evaluates the live bar and revises itself until close. A non-repainting one waits for the close, so what you saw in real time is what history keeps.
The Five-Minute Repaint Audit
You do not need to read Pine Script to catch most repainting tools. Five checks, done in order, will expose the overwhelming majority.
1. The replay test
Use TradingView's bar replay and step forward candle by candle. Note where signals appear in real time, then compare against the finished chart. Any difference is repainting.
2. The screenshot test
Capture the last twenty signals today, revisit in a week. Arrows and levels must be pixel-identical. This catches tools that only revise older history.
3. The refresh test
Reload the chart mid-session. If signals on the current bar rearrange after a refresh, the tool is evaluating the live bar rather than the close.
4. The perfection test
Signals landing at exact tops and bottoms with almost no losers are a red flag, not a selling point. Real edges are messy and include losing trades.
5. The source test
Open-source scripts can be read and verified. Closed, invite-only tools with spectacular claims and no public ledger deserve the most scepticism.
6. The ledger test
Ask for timestamped calls published before outcomes were known. A public record that includes losses is far stronger evidence than any backtest image.
| Warning sign | What it usually means |
|---|---|
| 90%+ advertised win rate | Repainting, curve fitting, or cherry-picked history |
| Arrows always at exact extremes | The signal is being placed after the outcome is known |
| No losing trades visible anywhere | Losers have been redrawn out of history |
| Backtest images only, never live calls | Nothing has been tested where it can be checked |
| Repaint question deflected or ignored | The answer would cost the sale |
Verify before you trust — including us
Run the replay test on our indicator, then read the public track record with every trade timestamped, wins and losses included.
See the live track record → Explore the indicator