Every year, traders search for the best TradingView indicator — and every year, they find the same recycled lists promoting whoever pays the most affiliate commissions. This review is different. We tested each tool on live charts across forex, crypto, and gold over 3 months and compared them on what actually matters: signal quality, accuracy, features, and value for money.
Before the reviews, the #1 pick on three live charts — gold on the 15-minute, Bitcoin on the 2-hour, NAS100 on the 4-hour — exported straight from TradingView.



Indicators that prove themselves in public.
One engine, four precision tools — the Gold (XAU) Scalper, the institutional Gravity Zone, the Zeno momentum Oscillator, and Zeno Stocks for equities.
What Makes a TradingView Indicator "Best"?
Before comparing specific tools, let's define the criteria. A great TradingView indicator should be non-repainting (signals don't change after the fact), provide multi-timeframe context (not just signals on one chart), include risk management tools (stop loss and take profit levels), and work across all markets (crypto, forex, stocks, commodities). Most importantly, it should give you an edge that free built-in indicators like RSI and MACD don't provide.
1. Quantum Algo — Best for Smart Money Concepts
| Indicator | No Repaint | MTF | Risk Mgmt | Backtest | Education | Price |
|---|---|---|---|---|---|---|
| Quantum Algo ★ Pick | ✓ | ✓ | ✓ | ✓ | ✓ 80 lessons | $19/mo |
| LuxAlgo | ✓ | ✓ | ◐ | ✓ AI | ✗ | $39/mo |
| Zeiierman | ✓ | ◐ | ◐ | ✗ | ✗ | $95/mo |
| Infinity Algo | ✓ | ✓ | ◐ | ◐ | ◐ | $49/mo |
| TradingCanyon | ✓ | ✗ | ✗ | ✗ | ✗ | $25/mo |
| MarketCipher | ✓ | ✗ | ✗ | ✗ | ✗ | $50/mo |
| Free SMC Script | ◐ | ✗ | ✗ | ✗ | ✗ | Free |
Why price matters: The most expensive indicator isn't the best one. Zeiierman charges $95/mo and MarketCipher charges $50/mo for oscillators with no SMC analysis. Value isn't about cost — it's about what you get per dollar.
Individual Reviews
2. LuxAlgo
From $39/moLuxAlgo has evolved from an indicator provider into a full AI algorithmic trading platform. Their Quant feature lets you build custom indicators with AI, and the AI Backtesting Assistant tests millions of strategy combinations.
✓ AI strategy builder
✓ Multi-platform
✓ 150K+ community
✓ 250+ free scripts
✗ Overwhelming for beginners
✗ SMC not primary focus
3. Zeiierman
From $95/moZeiierman offers 80+ premium indicators as a single package. Their SMC indicator is well-regarded in the community, and they distinguish themselves by not using pivot points for market structure detection — instead focusing on true order flow mechanics.
✓ Strong SMC implementation
✓ 16+ years experience
✓ Video tutorials
✗ No AI features
✗ No free tier or trial
✗ Less intuitive website
4. Infinity Algo
From $49/moInfinity Algo positions itself as an AI-powered indicator with adaptive signal sensitivity. Their V3 update added order blocks, structure detection, and a multi-timeframe dashboard.
✓ Clean modern interface
✓ 7,000+ active traders
✓ Walk-forward optimization
✗ Less established community
✗ Limited education
5. TradingCanyon
From $25/moTradingCanyon offers simple buy/sell signal indicators at a competitive price. Their 7-day free trial lets you test before committing. Straightforward — no complex SMC analysis.
✓ Simple to use
✓ Works on all markets
✗ No education
✗ No MTF context
6. MarketCipher
From $50/moMarketCipher is an oscillator-based system that combines multiple momentum indicators into a single lower-panel display. Popularized by crypto traders — fundamentally different, lagging approach.
✓ Popular in crypto
✓ Combined oscillators
✗ No SMC analysis
✗ No MTF panel
✗ Expensive for what it offers
7. Free SMC Script (LuxAlgo)
FreeThe most-liked community indicator on TradingView. Provides basic BOS/CHoCH detection, order blocks, and FVGs at no cost. Great starting point, but you'll outgrow it quickly.
✓ Basic SMC functionality
✓ Community-maintained
✗ No alerts or backtesting
✗ Laggy on lower TFs
✗ No MTF panel

Automate your trades. Let Quantum Algo trade for you.
Every signal executed on your own account — on your account, with the plan you define.
How to Actually Evaluate a TradingView Indicator
The TradingView indicator marketplace is flooded with options, and marketing claims can make it difficult to distinguish genuine tools from overhyped products. Before committing to any paid indicator, run it through a structured evaluation framework. Start with the repainting test: add the indicator to a chart, note the current signals, then switch to a different timeframe and back. If signals have changed or disappeared, the indicator repaints and its historical performance is fabricated. This alone eliminates the majority of unreliable tools.
Next, evaluate the signal-to-noise ratio. An indicator that generates 20 signals per day on a 15-minute chart is not giving you an edge — it is giving you noise. High-quality indicators produce fewer, more selective signals with clear entry and exit criteria. Ask yourself: does this indicator tell me exactly when to enter, where to place my stop, and where to take profit? If it only provides vague directional bias without actionable levels, it is a visualization tool, not a trading system.
Finally, test the indicator on multiple asset classes and timeframes. An indicator that works beautifully on BTC 1-hour but fails on EUR/USD or SPX 4-hour is likely curve-fitted to a specific market condition rather than built on universal market principles. The best indicators are methodology-agnostic — they detect genuine structural patterns (like order flow, momentum divergences, or volatility shifts) that manifest across all liquid markets.
Free vs Paid Indicators: The Real Trade-Offs
TradingView's community script library contains thousands of free indicators, and some are genuinely excellent. Open-source scripts from established community developers often provide solid moving averages, RSI variants, volume profiles, and basic structure tools. For traders who are still learning and developing their methodology, free indicators provide more than enough analytical power to study price action and test ideas.
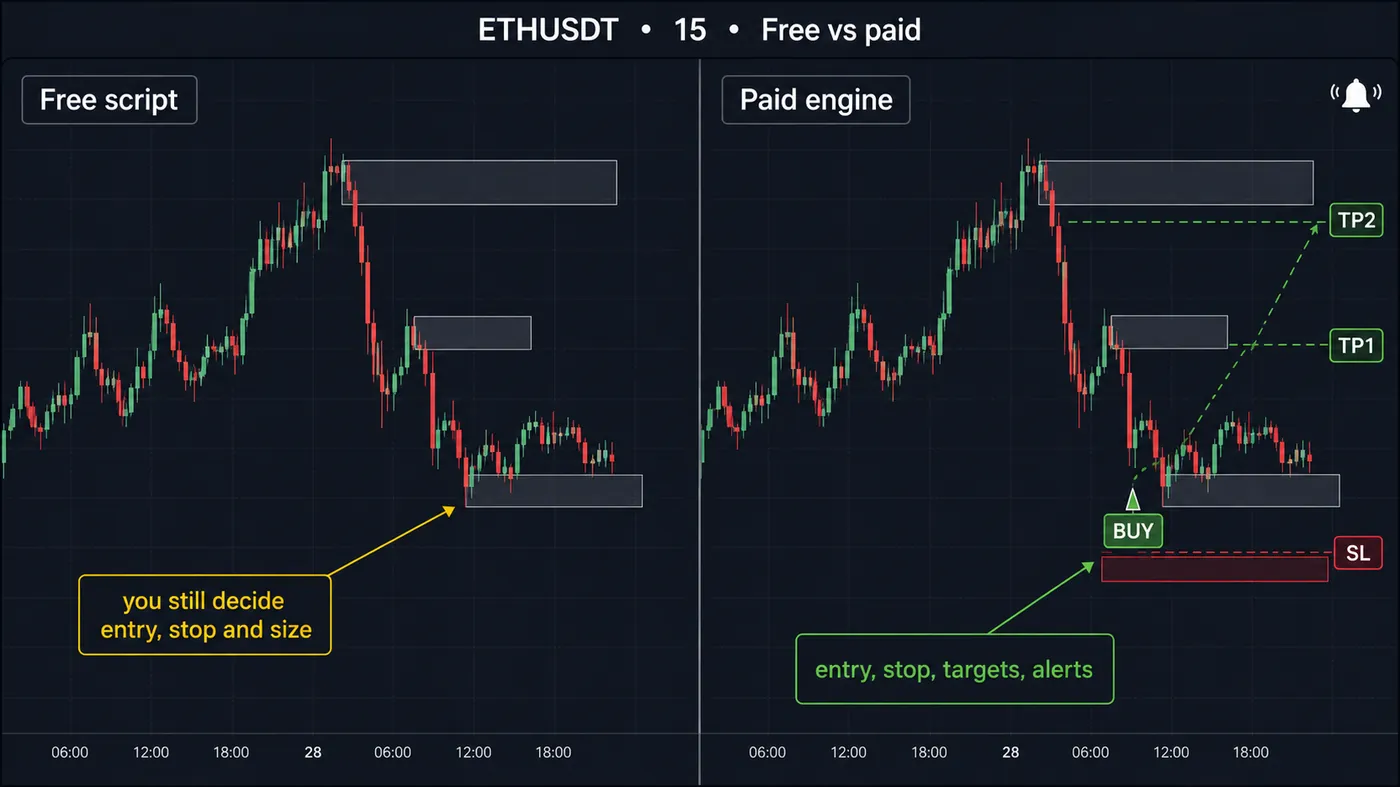
Paid indicators justify their cost when they save you significant time, combine multiple analytical layers into a single tool, or provide proprietary signal logic that you could not replicate yourself. The value proposition of a paid indicator like Quantum Algo or LuxAlgo is not that they show you something impossible to see otherwise — it is that they automate and systematize the detection of complex patterns (multi-timeframe order blocks, filtered FVGs, institutional zones) that would take a manual trader hours of analysis per chart.
The most important question is not "free vs paid" but rather "does this tool improve my consistency?" If you find yourself making disciplined, high-quality decisions with free tools, adding paid indicators may offer diminishing returns. But if your analysis is inconsistent, time-consuming, or emotionally influenced, a well-built paid indicator that enforces systematic rules can be worth many times its subscription cost in improved trade quality.
Indicator Stacking: When More Is Less
A common trap, especially among newer traders, is running five or six indicators simultaneously and waiting for all of them to align. This approach sounds logical — more confirmation should mean higher probability — but in practice it leads to analysis paralysis and missed opportunities. The issue is that most popular indicators (RSI, MACD, Stochastic, Bollinger Bands) are derived from the same underlying data: price and volume. Stacking correlated indicators does not add independent confirmation; it just adds visual noise.
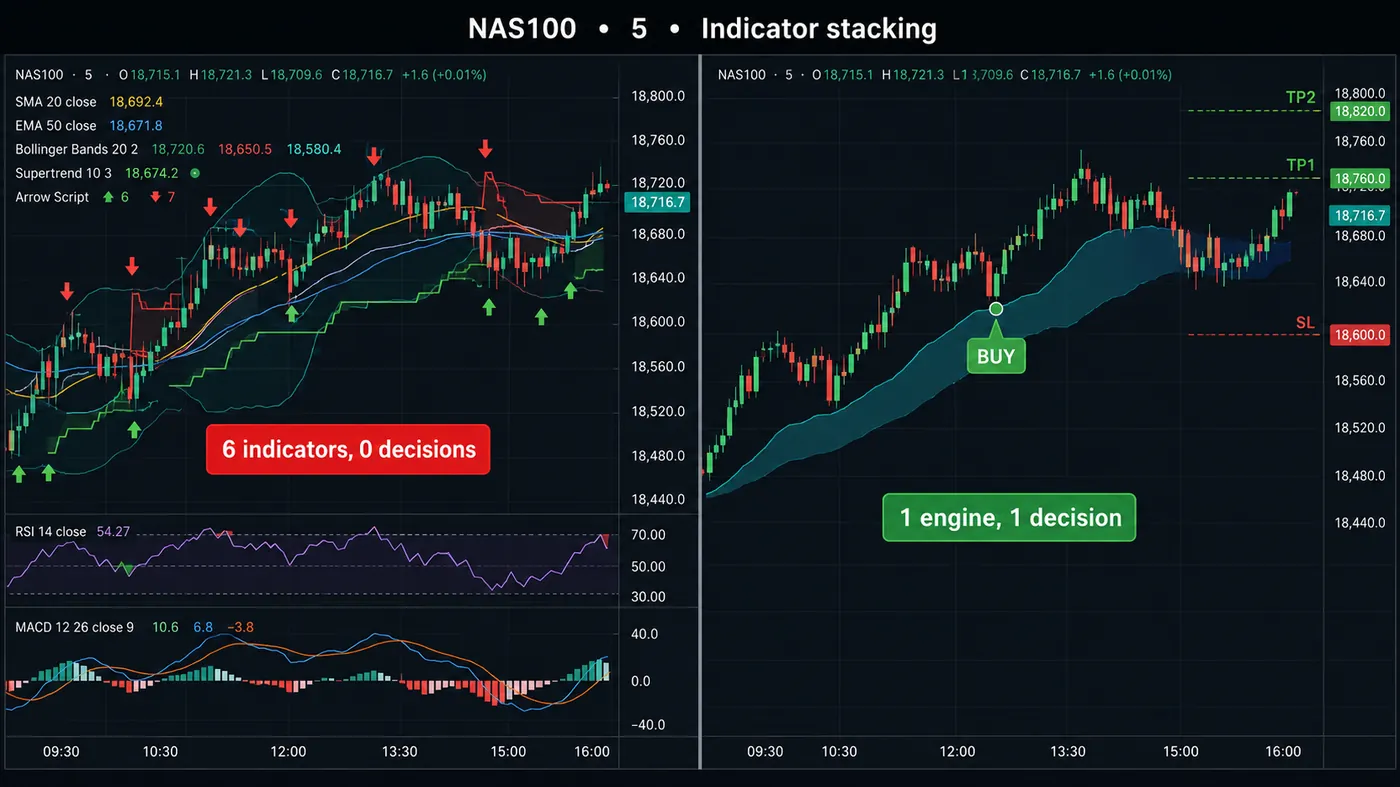
A more effective approach is to use indicators that analyze different dimensions of price behavior. Combine a structural indicator (like SMC order blocks) with a momentum indicator (like RSI or the WaveTrend oscillator) and a volatility indicator (like Bollinger Band width or the Squeeze Momentum). Each of these three categories measures something fundamentally different about the market, so their agreement represents genuine multi-dimensional confluence rather than redundant confirmation from correlated data.
Key takeaway: Combine a structural indicator + a momentum indicator + a volatility indicator. Three different dimensions of data = genuine confluence, not noise.
Why Non-Repainting Matters More Than Win Rate
Many indicator vendors advertise impressive win rates: 85%, 90%, even 95% accuracy. These numbers are almost always calculated on repainting signals — signals that change retroactively to match what actually happened. A repainting indicator can always show perfect historical results because it has the benefit of hindsight. In real-time trading, the signals you see on the current candle may disappear or move once that candle closes.
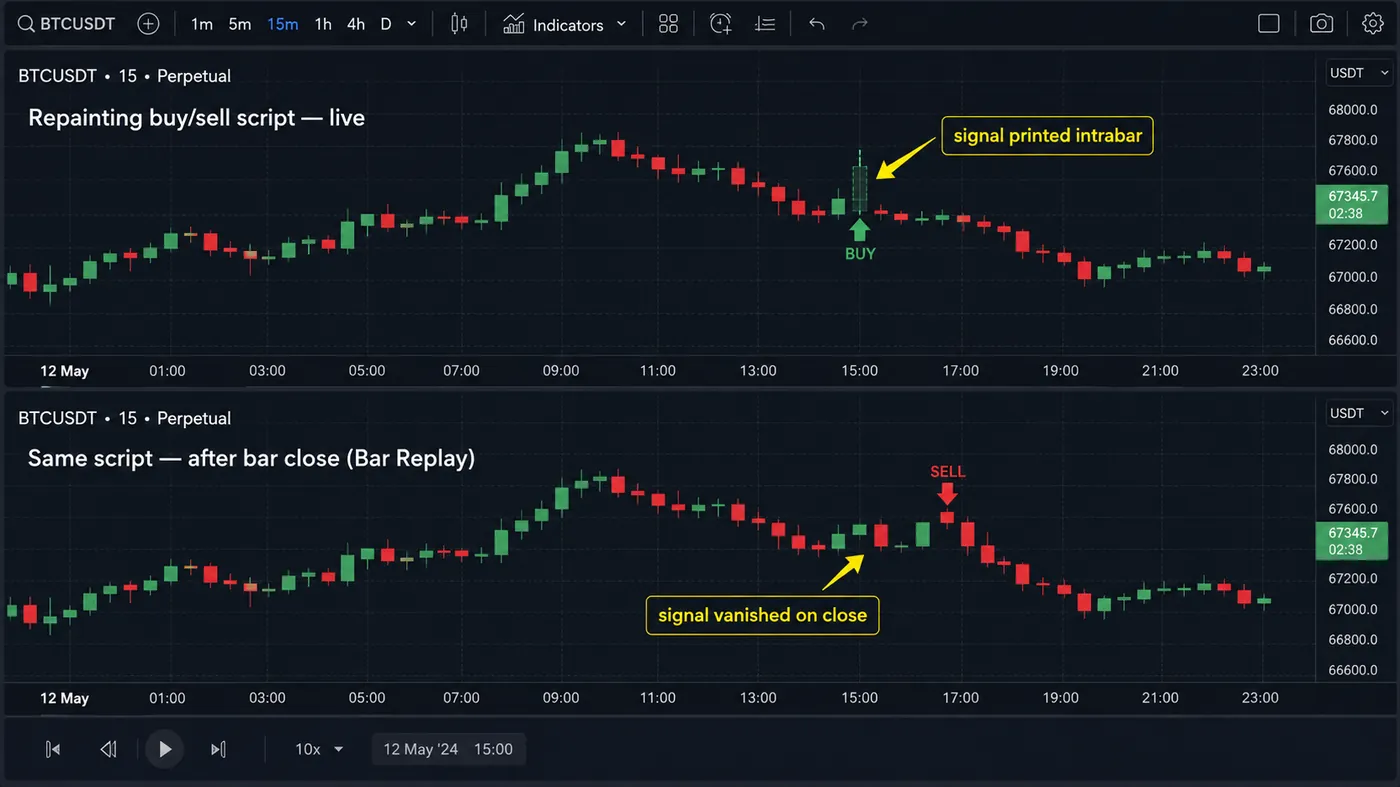
This is why the non-repainting guarantee should be the first thing you verify before evaluating any other metric. A non-repainting indicator with a 55% win rate and a 1:2 risk-to-reward ratio is infinitely more valuable than a repainting indicator claiming 90% accuracy. The honest 55% win rate reflects the actual statistical edge you will experience in live trading. With proper risk management, a 55% win rate at 1:2 R:R produces consistent profitability over time.
The repainting test alone eliminates the majority of unreliable tools. Add the indicator, note the signals, switch timeframe and back. If signals changed — it repaints. Walk away.
Backtesting Any Indicator Properly
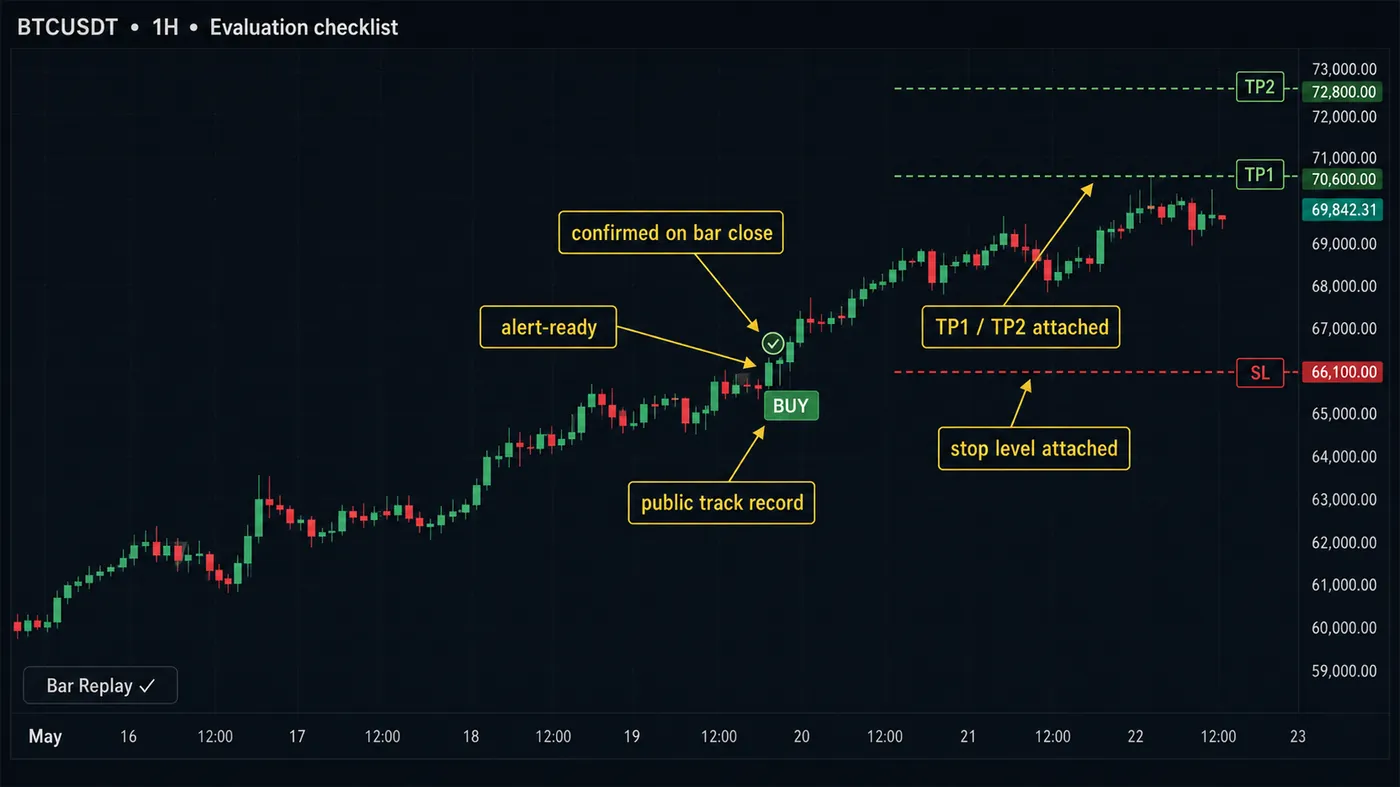
Before committing real money to any indicator's signals, run a proper backtest. TradingView's strategy tester is the easiest starting point — if the indicator includes a built-in strategy, apply it to the asset and timeframe you plan to trade and examine the results over at least 200 trades. Look at the profit factor (total profit ÷ total loss), maximum drawdown, and average trade duration. A profit factor above 1.5 with a maximum drawdown under 20% is a solid foundation.
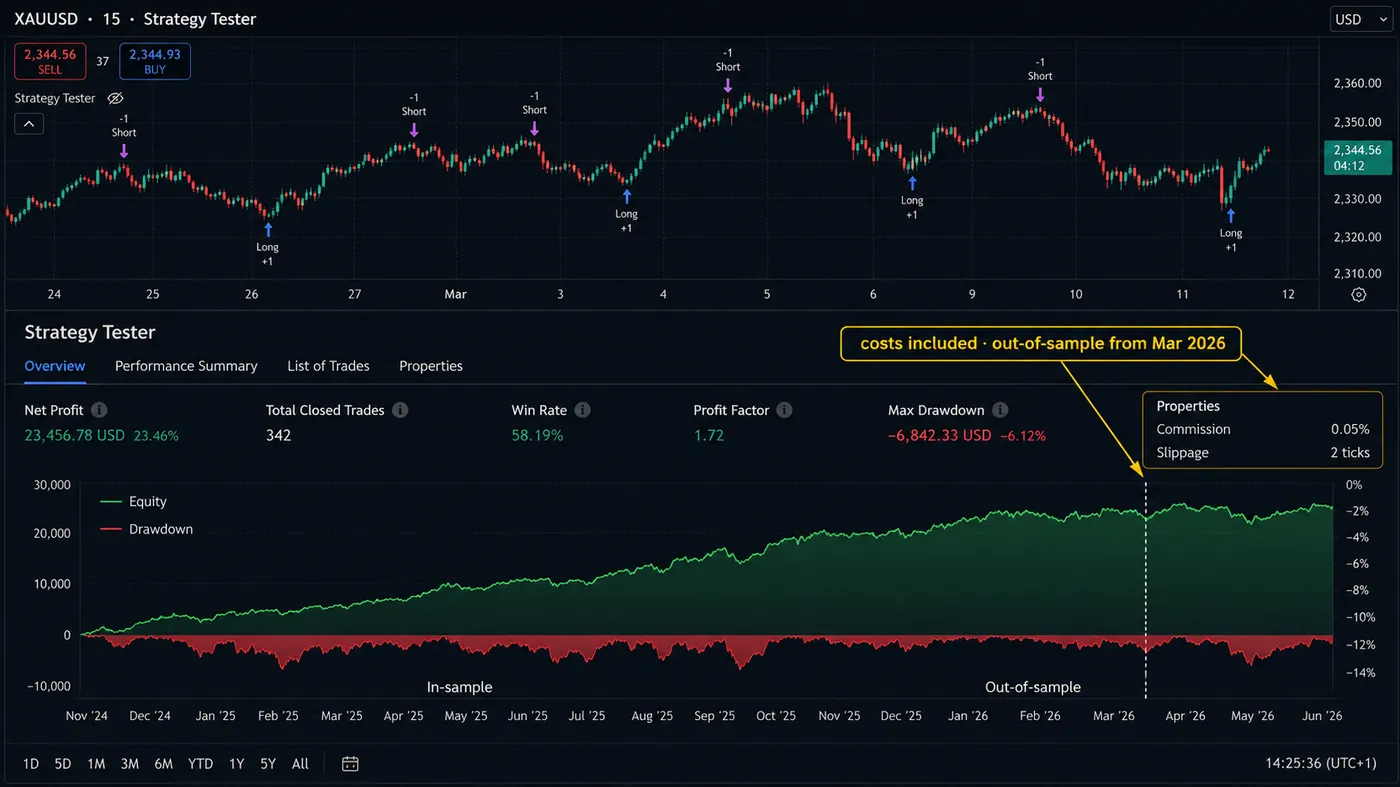
If the indicator does not include a strategy tester, use TradingView's bar replay feature to manually walk through historical signals. Start from 6–12 months ago and advance candle by candle, noting each signal's entry, stop, and target as if you were trading it live. Record every trade in a spreadsheet. This manual process is more time-consuming than automated backtesting, but it gives you a visceral understanding of how the indicator performs across different market conditions — trends, ranges, high-volatility events, and quiet periods.
The most important backtesting principle is to include losing periods in your sample. Any indicator will look profitable if you cherry-pick a strong trending period. Stress-test the signals during choppy, sideways markets and during sharp reversals. If the indicator produces consistent signals with manageable drawdowns during unfavorable conditions, you can trust it to perform when market conditions inevitably turn against you in live trading.