Ultimate Oscillator: Formula, Settings, Divergence Signals and How to Trade It
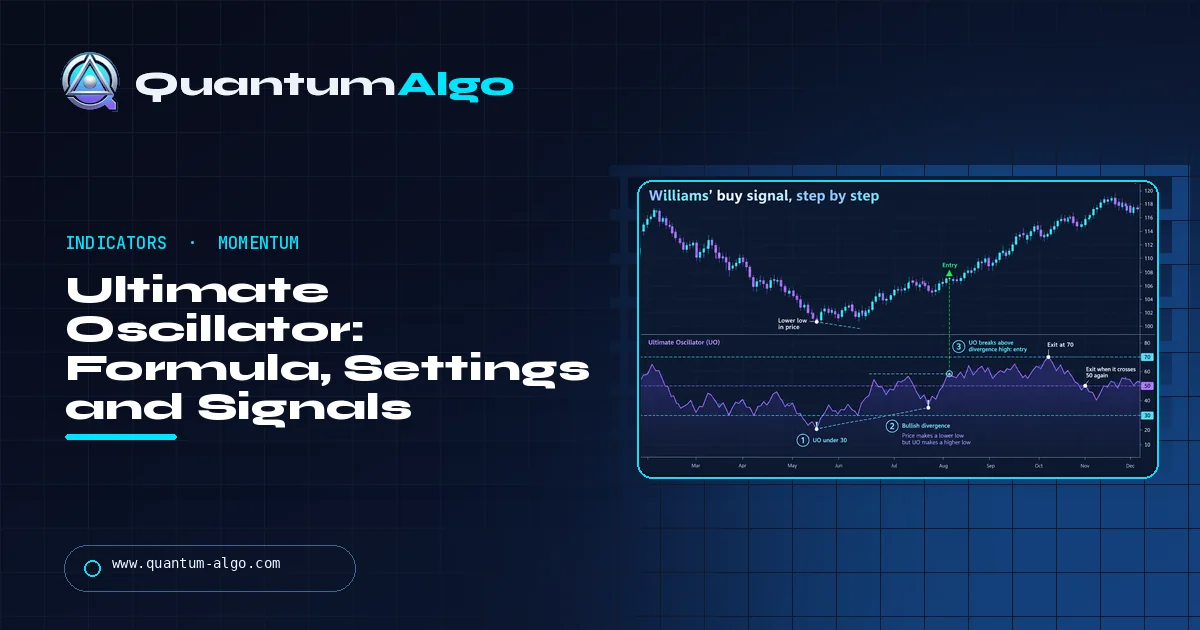
The Ultimate Oscillator (UO) is a momentum oscillator from Larry Williams that blends buying pressure over three lookbacks, usually 7, 14 and 28 bars, weighted 4 : 2 : 1, into one line from 0 to 100. Its main signal is not a simple overbought or oversold reading: Williams buys a bullish divergence whose low is under 30, once the UO rises above the divergence high, and sells the mirror image above 70.
Most momentum oscillators measure one window, which makes them twitchy on short settings and slow on long ones. Larry Williams built the Ultimate Oscillator in 1976 to fix that by averaging three windows at once. The result is smoother than a fast RSI and quicker than a slow one, and it comes with a strict three-step entry rule that most traders skip. This guide covers the formula, the rules, the settings that make sense on different markets and a calculator for your own data.
Indicators that prove themselves in public.
One engine, four precision tools — the Gold (XAU) Scalper, the institutional Gravity Zone, the Zeno momentum Oscillator, and Zeno Stocks for equities.
What is the Ultimate Oscillator?
The Ultimate Oscillator (UO) is a momentum indicator that measures how much of each bar's range was captured by buyers, averaged over three lookback periods at once. It moves between 0 and 100, with 30 and 70 as the usual oversold and overbought lines and 50 as the centreline.
Larry Williams designed it in 1976, and it was published in Technical Analysis of Stocks & Commodities in 1985. His complaint about single-period oscillators was simple: a short period gives too many false signals, a long one gives signals too late. Blending three periods, weighted towards the shortest, keeps the line responsive without letting one or two noisy bars dominate it.
The name oversells it; it is not the "ultimate" anything. But it is a well-built oscillator, it handles gaps better than many (it uses the prior close in its range), and it comes with one of the most specific entry rules of any classic indicator.
How is the Ultimate Oscillator calculated?
There are four steps. For each bar:
- Buying pressure (BP) = close − the lower of today's low and yesterday's close.
- True range (TR) = the higher of today's high and yesterday's close − the lower of today's low and yesterday's close.
- For each lookback, sum BP and sum TR, then divide: Average7 = ΣBP(7) ÷ ΣTR(7); likewise for 14 and 28 bars.
- UO = 100 × [(4 × Average7) + (2 × Average14) + Average28] ÷ 7.
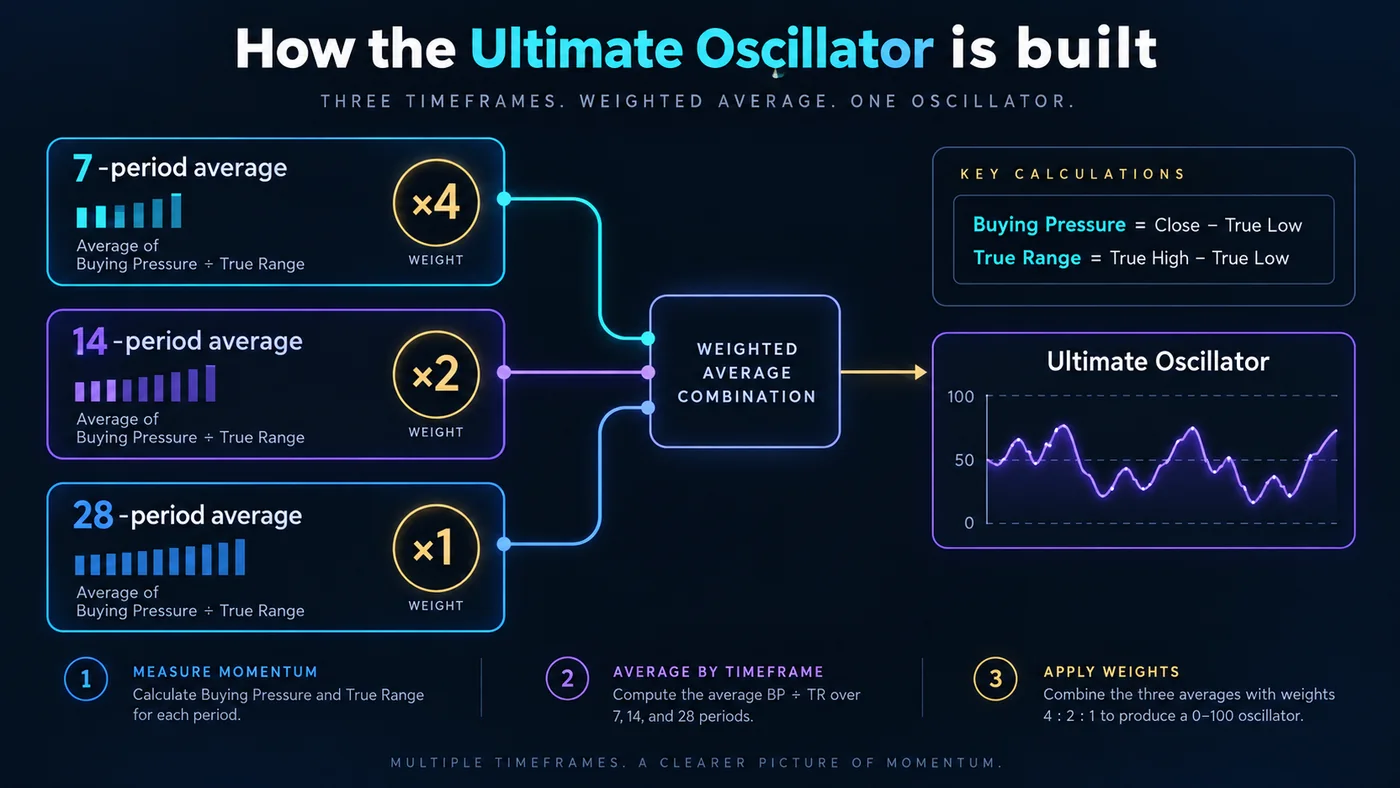
Each average is a ratio between 0 and 1: the share of the range that buyers "won" over that window. A close at the top of the true range every day gives a ratio near 1; a close at the bottom gives a ratio near 0. Because the weights add up to 7, dividing by 7 keeps the result on the same 0–1 scale before multiplying by 100.
The weighting matters. The 7-bar window carries four times the influence of the 28-bar window, so the UO reacts mostly to recent bars, while the longer windows stop a single spike from swinging it from one extreme to the other.
| Input | Default | Weight | Role |
|---|---|---|---|
| Short period | 7 | 4 | Responsiveness |
| Medium period | 14 | 2 | Balance |
| Long period | 28 | 1 | Context; filters noise |
What are Larry Williams' buy and sell rules?
Williams did not intend the UO to be traded on simple crosses of 30 or 70. His buy rule has three conditions, and all three must be met:
- A bullish divergence forms: price makes a lower low while the UO makes a higher low.
- The low of that divergence (the first UO low) is below 30.
- The UO then rises above the high it made between the two lows. That break is the entry.
The sell rule is the mirror: a bearish divergence (price higher high, UO lower high), the first UO high above 70, and the entry when the UO falls below the low between the two highs.
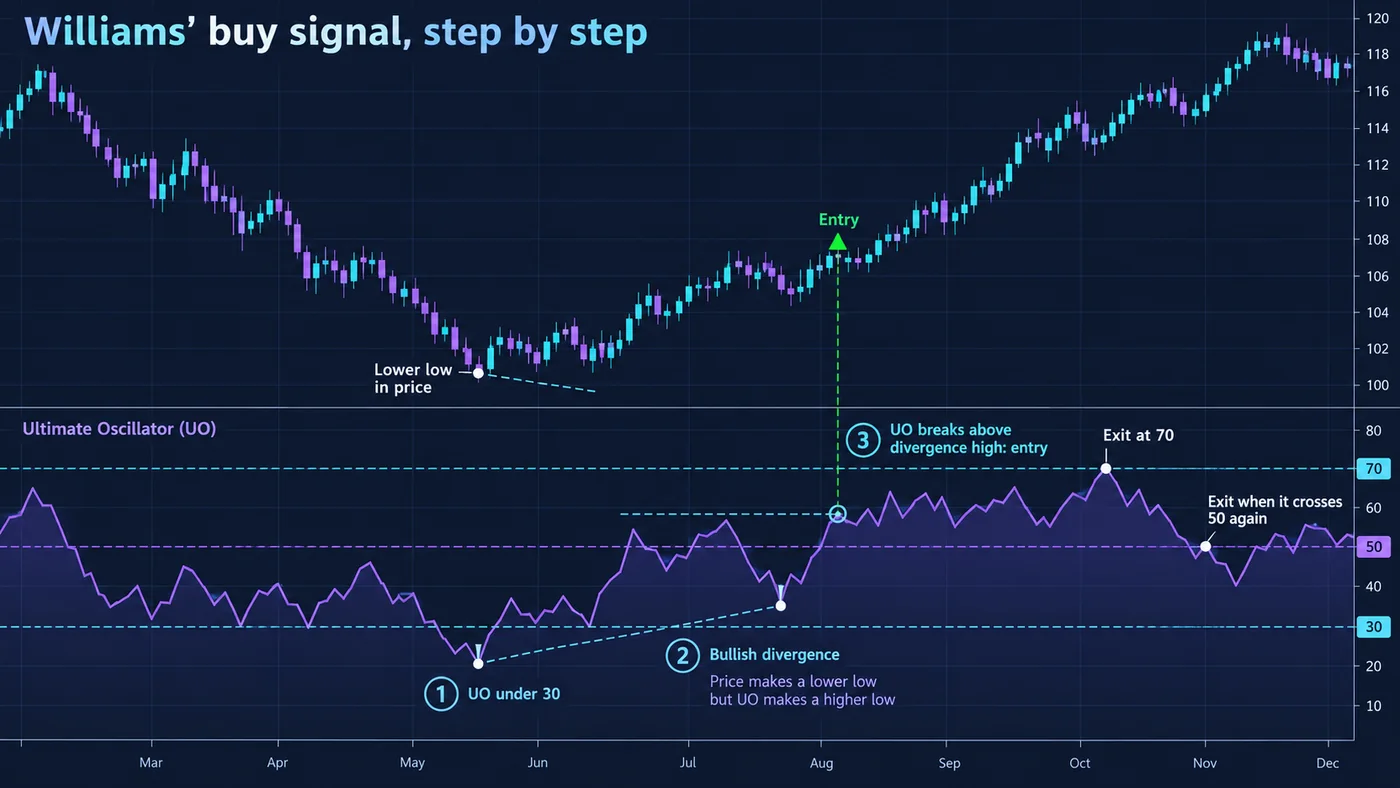
The rule is strict on purpose. Oversold readings happen constantly in a downtrend, and buying every dip under 30 is how oscillators lose money. Requiring a divergence and then a break of the divergence high means you only act when downside momentum has visibly weakened and then turned. You will take fewer trades, and that is the point.
For exits, common choices are a move above 70, the UO crossing back below 50 after a run, or price reaching a structural target. These are practitioner conventions rather than part of Williams' original entry rule, so pick one and test it. For the general mechanics of divergence, see the divergence trading guide.
What are the best Ultimate Oscillator settings?
The default 7/14/28 is a sensible starting point on any timeframe because the three windows keep a fixed 1 : 2 : 4 relationship. If you change them, keep that ratio so the weighting still makes sense.
| Use | Periods | Notes |
|---|---|---|
| Default (most markets) | 7 / 14 / 28 | Williams' original; the reference everyone else uses |
| Faster: intraday, scalping | 5 / 10 / 20 | More signals and more noise; pair with a trend filter |
| Slower: swing and position trades | 10 / 20 / 40 | Fewer, later signals; reaches 30 and 70 less often |
| Crypto, 24/7 markets | 7 / 14 / 28 on 1H–4H | Avoid very low timeframes where wicks distort true range |
Some traders also widen the thresholds in strongly trending markets, for example using 25 and 75, because the UO can stay between 30 and 70 for a long time in a steady trend. Whatever you choose, change one thing at a time and judge it on a sample of trades, not one chart.
How do you trade the Ultimate Oscillator?
Three practical approaches, from strictest to loosest:
1. The Williams divergence setup
Trade only the full three-step signal above. It works best at the end of a pullback inside a larger trend, for example a bullish divergence under 30 while price is above a rising 200-period moving average. Put the stop below the price low of the divergence.
2. Centreline trend filter
Use 50 as a bias filter: only take long setups from your main method while the UO is above 50, and shorts while it is below. This uses the UO as a momentum check rather than a trigger.
3. Pullback timing in a trend
In an established uptrend, a dip of the UO towards 30–40 followed by a turn back up marks the end of a pullback. It is looser than Williams' rule, so combine it with a price level: support, an order block or a fair value gap.
In every case the oscillator answers when, not where. The location (the level you are buying from and the stop beyond it) should come from price structure.
Ultimate Oscillator calculator
Paste high, low and close values, oldest first, or load one of the samples. The calculator works out buying pressure and true range for each bar, the three averages and the Ultimate Oscillator for the latest bar, and explains what the reading means under Williams' rules. You can change the three periods.
How does the Ultimate Oscillator behave on different markets?
The formula is the same everywhere, but the market's character changes what the readings mean.
| Market | Typical behaviour | Practical adjustment |
|---|---|---|
| Large-cap stocks (daily) | Overnight gaps are captured by the prior-close true range; signals are clean | Default 7/14/28; trade divergences in the direction of the weekly trend |
| Forex majors (1H–4H) | Long ranges keep the UO between 35 and 65 for days | Use 50 as a bias filter and save the divergence rule for session extremes |
| Gold (15M–1H) | Sharp news spikes push the UO to extremes briefly | Ignore extremes printed on a single news bar; wait for the next close |
| Crypto (4H) | Persistent trends; the UO can hold above 60 or below 40 for long periods | Consider 25/75 thresholds and require a structure break with the divergence |
| Index futures (5M–15M) | Opening volatility distorts the first bars | Skip signals from the first 30 minutes of the cash session |
Whatever the market, the same discipline applies: the UO tells you that momentum has changed, and price structure tells you whether the change happened somewhere worth trading. A divergence at a higher-timeframe support level is a setup; the same divergence in the middle of a range is noise. Before trusting any setting, run it over a few months of your own market and count how many full three-step signals it produced and how they resolved. With the strict rule you may only see a handful per month on one instrument, which is normal.
Ultimate Oscillator vs RSI vs stochastic
| Indicator | Measures | Lookbacks | Classic signal | Main weakness |
|---|---|---|---|---|
| Ultimate Oscillator | Close vs true range (buying pressure) | Three, weighted | Divergence under 30 / above 70, then a break | Few signals with the strict rule |
| RSI | Average gains vs losses | One (14) | 30/70, divergence, failure swings | Stays overbought in strong trends |
| Stochastic | Close vs the high–low range | One plus smoothing | %K/%D cross at 20/80 | Very fast; many whipsaws |
| Williams %R | Close vs the high–low range | One (14) | −20 / −80 extremes | Same as a raw stochastic |
The UO's distinctive feature is the blend of windows. It is generally smoother than a 14-period stochastic and reaches its extremes less often than a fast RSI, which suits the divergence rule. If you already use RSI, the UO rarely adds much on the same chart; pick one momentum tool and learn it well.
What mistakes do traders make with the Ultimate Oscillator?
- Buying every reading under 30. In a downtrend the UO can sit near 30 for weeks. Wait for the divergence and the break of its high.
- Calling any wiggle a divergence. The first low of a bullish divergence must be under 30. A divergence between 45 and 50 is not Williams' signal.
- Ignoring the trend. Counter-trend divergence trades fail more often. Use a higher-timeframe trend filter.
- Changing the periods without keeping the ratio. 7/14/28 works because each window doubles the last. Arbitrary sets lose that balance.
- Treating 50 as a signal. A cross of 50 is a bias change, not an entry.
- No price-based stop. The oscillator cannot tell you where you are wrong; the swing low or high of the divergence can.
Reference data
| Item | Detail |
|---|---|
| Creator | Larry Williams (1976); published in Stocks & Commodities (1985) |
| Type | Bounded momentum oscillator, 0–100 |
| Inputs | High, low, close (uses the prior close) |
| Default periods | 7, 14, 28 with weights 4, 2, 1 |
| Levels | 30 oversold · 50 centreline · 70 overbought |
| Buy rule | Bullish divergence, first low under 30, entry on a break of the divergence high |
| Sell rule | Bearish divergence, first high above 70, entry on a break of the divergence low |
| On TradingView | Built-in indicator "Ultimate Oscillator" (fast 7, middle 14, slow 28) |
How does the Ultimate Oscillator fit with Quantum Algo's indicators?
The UO is a timing tool: it says when momentum has turned, not where price should turn. Quantum Algo's approach puts location first. The free Quantum Algo indicators on TradingView mark structure, liquidity and divergences, which gives you the levels a UO signal should line up with. Zeno, the premium engine from Quantum Algo (QuantumAlgo), combines momentum with structure in its own oscillator and prints buy and sell signals with an entry, a stop and two targets, every one of them logged on the public track record.
The Ultimate Oscillator blends buying pressure over 7, 14 and 28 bars, weighted 4 : 2 : 1, into one 0–100 line. Larry Williams' signal is not a plain oversold cross: it is a divergence whose first extreme is beyond 30 or 70, confirmed when the UO breaks the divergence high or low. Use it to time entries at price levels you have already chosen, keep the 1 : 2 : 4 period ratio if you change the settings, and put the stop at the price extreme of the divergence.
◆ Interactive check
Do you know the Ultimate Oscillator?
Questions traders ask about the Ultimate Oscillator
A momentum oscillator by Larry Williams that combines buying pressure over three lookbacks (7, 14 and 28 bars, weighted 4 : 2 : 1) into a single line from 0 to 100.
For each bar, buying pressure is the close minus the lower of the low and prior close, and true range is the higher of the high and prior close minus that same low. Sum each over 7, 14 and 28 bars, divide BP by TR for each window, then UO = 100 × (4·A7 + 2·A14 + A28) ÷ 7.
The default 7/14/28 works on most markets. Faster sets like 5/10/20 suit intraday trading; slower sets like 10/20/40 suit swing trading. Keep the 1 : 2 : 4 ratio.
Williams' rule: a bullish divergence (price lower low, UO higher low) whose first low is below 30, with the entry when the UO rises above the high between the two lows.
A bearish divergence (price higher high, UO lower high) whose first high is above 70, with the entry when the UO falls below the low between the two highs.
Neither is better in general. The UO blends three windows so it is smoother and reaches extremes less often; RSI uses one window. Use one momentum tool consistently rather than both.
It is the centreline. Above 50 momentum leans bullish, below 50 bearish. It is a bias filter, not an entry signal.
Yes. Use 1-hour to 4-hour charts or higher, where wicks distort true range less, and combine it with a trend filter.
No. It uses completed bars only. The value on the current, unfinished bar changes until the bar closes, like any indicator.
Yes. It is a built-in indicator named "Ultimate Oscillator" with fast, middle and slow lengths of 7, 14 and 28 by default.
References & Related Guides
Read next
- RSI Indicator
- Stochastic Oscillator
- Williams %R
- Divergence Trading
- Awesome Oscillator
- True Strength Index
- MACD Indicator
- Average True Range
- Best Indicator Combination
- Andrews Pitchfork
- Free TradingView indicators
- Zeno — the premium engine
- Coppock Curve Indicator