True Strength Index (TSI): Double-Smoothed Momentum, Read Properly
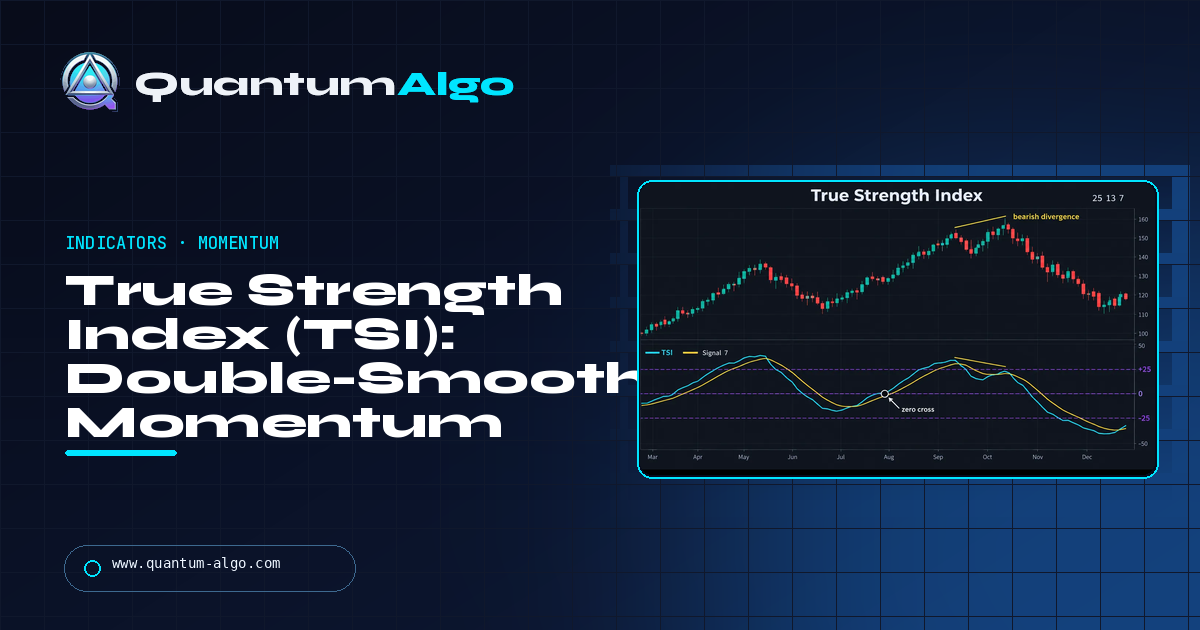
The True Strength Index (TSI) is a momentum oscillator that smooths each bar's price change twice — a 25-period EMA then a 13-period EMA — and divides it by the same double-smoothed absolute change, times 100, so it runs between about −100 and +100 and reads the same on any instrument. Above zero, smoothed momentum is up; the 7-period signal line gives the timing; ±25 marks extended, not overbought. Trade the signal-line cross only in the direction of the zero line and at a level, treat a higher price high against a lower TSI high as the warning, and expect it to lag reversals by several bars — it is closer to MACD than to RSI.
TSI is the oscillator I point people to when they complain that RSI is too jumpy and MACD means nothing across different charts, because it fixes both in one formula: smooth momentum twice, then normalise it. The cost is lag, and the lag is why it needs a filter. This page is the double-EMA chain, the defaults and what changes them, the zero line, the signal cross and the divergence, the comparison with MACD, RSI and Stochastic RSI, an ETHUSDT 4-hour pullback entry and the counter-trend cross the zero line removed, and where TSI still misleads. The calculator runs Blau's formula on pasted closes.
Indicators that prove themselves in public.
One engine, four precision tools — the Gold (XAU) Scalper, the institutional Gravity Zone, the Zeno momentum Oscillator, and Zeno Stocks for equities.



What the True Strength Index is
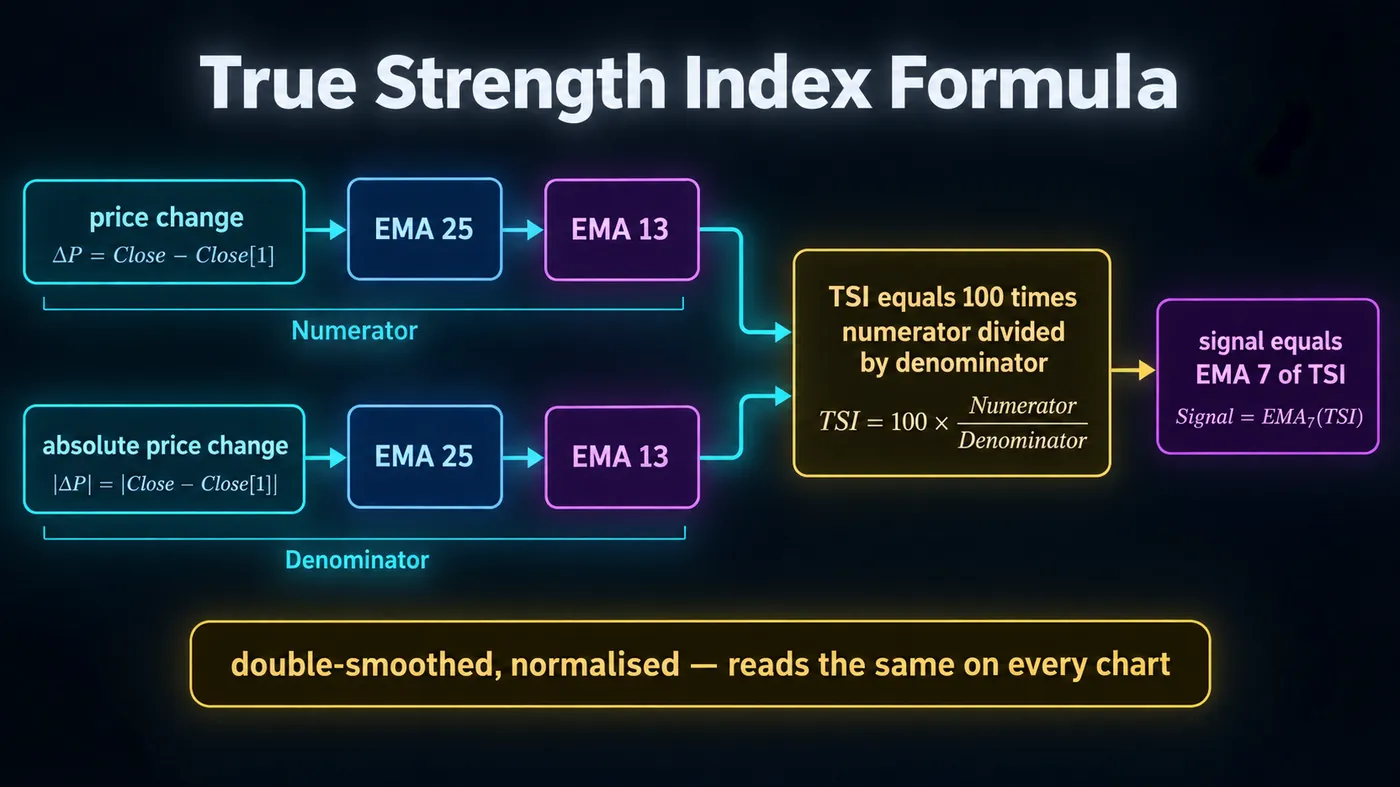
The True Strength Index is a momentum oscillator built from price change smoothed twice. Take each bar's change from the previous close, run a 25-period EMA over it and then a 13-period EMA over that; do the same with the absolute change; divide the first by the second and multiply by 100. The result moves between roughly −100 and +100, sits above zero when smoothed momentum is up and below when it is down, and carries a 7-period EMA signal line for timing. William Blau published it in Technical Analysis of Stocks & Commodities in 1991.
The double smoothing is the point. A single EMA of momentum is jittery; two in series remove most of the bar-to-bar noise while keeping the turn, because the second EMA is short. And dividing by the smoothed absolute change normalises the result across instruments — TSI at +30 means the same thing on ES and on a small cap — without the pinning problem that range-based oscillators have: TSI is not measuring where price sits inside a lookback window, so it does not sit at 100 for twenty bars in a trend the way Stochastic RSI does.
What it is not: fast. Two EMAs of 25 and 13 mean TSI turns several bars after price does; it is a trend-momentum tool, closer in temperament to MACD than to RSI. It is also unbounded in principle — the ±25 levels are conventions, not limits — and it says nothing about volume.
The formula
| Step | Formula | Default |
|---|---|---|
| 1. Momentum | close − prior close | — |
| 2. Double-smoothed momentum | EMA(EMA(momentum, long), short) | long 25, short 13 |
| 3. Double-smoothed absolute momentum | EMA(EMA(|momentum|, long), short) | 25, 13 |
| 4. TSI | 100 × step 2 ÷ step 3 | ≈ −100 to +100 |
| 5. Signal line | EMA(TSI, signal) | 7 |
| Levels | Zero (trend), ±25 (extended) | convention |
| Use | Long | Short | Signal | Note |
|---|---|---|---|---|
| Default (Blau) | 25 | 13 | 7 | Daily bars; TradingView's built-in defaults |
| Swing, daily and 4H | 25 | 13 | 7 | Keep it |
| Faster intraday | 13 | 7 | 5 | More crosses; use only with a level |
| Slower regime read | 40 | 20 | 10 | Fewer zero crosses; a trend filter, not a trigger |
| Crypto 4H | 25 | 13 | 9 | Longer signal line cuts whipsaw on 24-hour noise |
How to read it
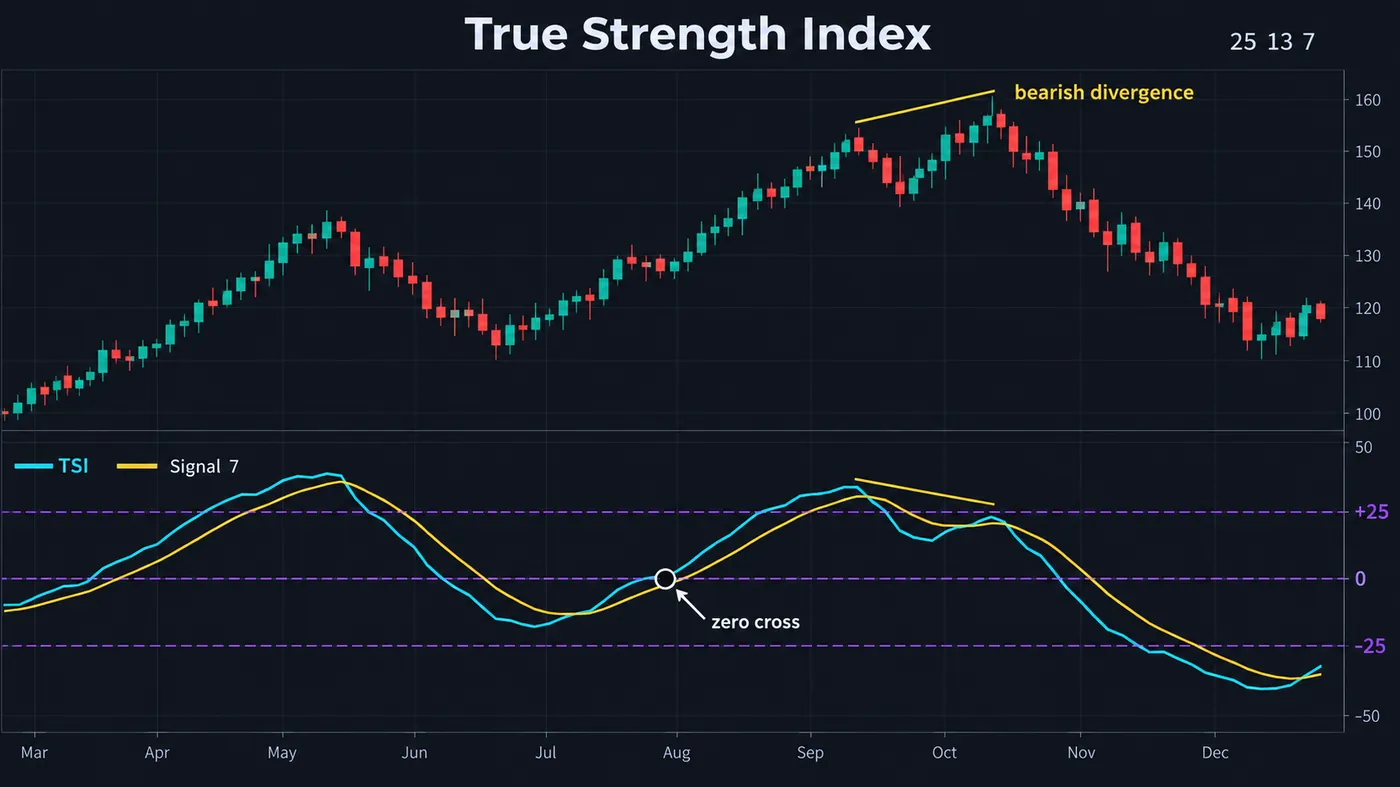
The zero line. TSI above zero means double-smoothed momentum is positive: the trend filter is up. Below zero, down. Because of the smoothing, zero crosses are infrequent and usually mark a real change in the direction of momentum — several bars after the price turn, which is the cost. Blau's simplest system was long above zero, short below.
The signal-line cross. TSI crossing above its 7-period EMA is the timing signal, and like MACD's it fires constantly in ranges. The version that works: take the cross only in the direction of the zero line — TSI above zero, cross up on a pullback — and at a level.
The ±25 zones. Not overbought and oversold in the RSI sense — TSI can sit at +40 for weeks in a strong trend — but extended. A signal cross down from above +25 is a pullback warning in an uptrend and the short trigger in a downtrend. Blau did not use fixed levels; they are a later convention and they vary by instrument.
Divergence. Price making a higher high while TSI makes a lower high is the reading that pays best, and it is more reliable on TSI than on faster oscillators because the double smoothing means the lower high was not made by a single quiet bar. It still fails in strong trends; confirm with the zero cross or a structure shift.

Automate your trades. Let Quantum Algo trade for you.
Every signal executed on your own account — on your account, with the plan you define.
How to trade it
- Take direction from the zero line. Above zero, longs only; below zero, shorts only. This removes the half of signal crosses that are counter-trend.
- Wait for a pullback in TSI toward zero without crossing it. In an uptrend, TSI falls from +30 to +8 and turns — momentum paused, trend intact.
- Enter on the signal-line cross at a level. TSI crossing back above its signal while price sits at an order block, a fair value gap or a prior swing. The cross without a level is a cross.
- Stop under the level. Not under an oscillator reading.
- Exit on the signal cross down from above +25, or on structure. The cross from the extended zone is the momentum exit; a close below the last higher low is the structure exit. Take whichever comes first.
- Treat a zero cross against you as the end. TSI dropping below zero while long is the filter turning; do not wait for the signal line.
TSI calculator
Paste closing prices and the tool runs the full chain — momentum, double EMA of momentum and of absolute momentum, TSI, signal line — and reports the zone, whether TSI crossed its signal or zero on the last bar, and what that combination means. The preloaded sample is an uptrend rolling over into a downtrend.
TSI versus MACD, RSI and Stochastic RSI
| Indicator | Built from | Bounded? | Speed | Pins in trends? | Where TSI differs |
|---|---|---|---|---|---|
| TSI | Double EMA of momentum ÷ double EMA of |momentum| | Practically ±100 | Medium | No | — |
| MACD | EMA 12 − EMA 26 of price | No — in price units | Medium | No | MACD is in price units and not comparable across instruments; TSI is normalised |
| RSI | Average gain ÷ average loss | 0–100 | Fast | Rarely | RSI is single-smoothed and noisier; TSI is smoother and slower |
| Stochastic RSI | RSI's position in its range | 0–100 | Very fast | Constantly | StochRSI pins at 0/100 in trends; TSI does not, because it is not range-based |
| SMI | Double-smoothed distance from the range midpoint | ±100 | Medium | Less than stochastics | SMI is Blau's other double-smoothed oscillator, on range position rather than momentum |
TSI and MACD are the closest pair: both are smoothed momentum with a signal line, both use the zero line as the trend filter. TSI's advantage is the normalisation — the same levels mean the same thing on every chart — and its double smoothing is a little cleaner at turns. MACD's advantage is the histogram, which TSI lacks. Running both is redundant.
Reference data
| Item | Value |
|---|---|
| Origin | William Blau, "True Strength Index", Technical Analysis of Stocks & Commodities, November 1991; Momentum, Direction and Divergence (Wiley, 1995) |
| Formula | 100 × EMA(EMA(Δclose, 25), 13) ÷ EMA(EMA(|Δclose|, 25), 13) |
| Signal line | EMA 7 of TSI |
| Range | ≈ −100 to +100; ±25 as the extended zones by convention |
| Reads as | Double-smoothed, normalised momentum |
| Primary signals | Zero line for direction; signal-line cross for timing (with the trend, at a level); divergence as the warning |
| Weakness | Lags reversals by several bars; signal crosses whipsaw in ranges; no volume |
| Closest relative | MACD (unnormalised); SMI (Blau's range-based sibling) |
| TradingView | Built-in "True Strength Index" (25, 13, 7) |
Worked example: ETHUSDT 4-hour, the pullback cross with the trend
ETHUSDT perpetual, 4-hour chart, TSI 25/13/7. A ten-day uptrend from 3,180 to 3,620 with TSI between +22 and +41 the whole way — never near zero, which is the trend filter saying longs only. On day eleven price pulled back to 3,470 over five candles; TSI fell from +38 to +11 and the signal line caught up to it. Price was sitting on a 4-hour bullish order block at 3,440–3,480. On the sixth candle TSI ticked to +13 and crossed above its signal at +12. Long at 3,488 on that close, stop under the block at 3,425, 63 of risk. No divergence anywhere on the chart; momentum had paused, not turned.
The move ran six days to 3,910. TSI climbed back to +44 and then crossed below its signal at +39 on a wide-range red candle — the momentum exit from the extended zone. Out at 3,842. 354 on 63 of risk, 5.6R. The structure exit (a close below the last 4-hour higher low at 3,760) would have come two days later at 3,748 for 4.1R; the signal cross from above +25 was the better exit this time and is not always.
The trade that was skipped on the same chart: three days before the entry, TSI crossed above its signal at −4 during a chop, below zero. Right cross, wrong side of the filter. Price went nowhere for two days and then fell 140 points. The zero line removed it.
Where the True Strength Index fails
Reversals. Two EMAs of 25 and 13 mean TSI is still positive for several bars after a top. The zero cross that ends a long trend can come 5% below the high. It is a momentum tool; the chart calls the reversal first.
Ranges. The signal-line cross fires every few bars around zero. Without the zero-line filter and a level, TSI in a range is a random signal generator, exactly like MACD.
Fixed levels. ±25 is a convention. On a low-volatility index TSI may never exceed ±20; on an altcoin it may live above +40 for a month. Read the extended zone against the instrument's own history.
Gaps and news bars. A single huge bar enters the momentum EMA and the absolute-momentum EMA together, so the ratio is muted — which is a strength — but it takes 25 bars to leave, so TSI can be biased for a month after a gap.
Short periods. A 13/7/5 TSI is an RSI with extra steps. If you want fast, use RSI; TSI's value is the smoothing.
Mistakes traders make with TSI
- Taking every signal cross. Filter by the zero line and require a level; that removes most of them.
- Reading +25 as overbought. It is extended; in a trend TSI lives there. The cross down from it is the read, not the level.
- Running TSI and MACD together. Same information, two panes.
- Shortening the periods to catch reversals. You lose the smoothing that is the point.
- Stopping out on the oscillator. The stop is under the level.
- Ignoring divergence because TSI is still positive. The divergence is the warning; the zero cross is the confirmation, and it comes late.
TSI and the free indicators
TradingView's built-in TSI is Blau's formula exactly. The library adds what the oscillator cannot see: the Order Blocks with Volume script gives the level the signal cross should land on, the Multi-Oscillator Divergence Scanner catches TSI-style divergences across several oscillators in one pane, and the MACD Matrix is the multi-timeframe version of the same momentum read. The premium engine, Zeno, prints buy and sell signals with a stop and targets; a Zeno buy signal on a pullback where TSI is positive and crossing its signal at an order block is the trade in the example above with the confirmation built in.
Momentum, smoothed twice, normalised once. Use zero for direction, the signal cross for timing only with the trend and at a level, and the divergence as the warning that the zero cross will confirm late. Keep 25/13/7, read ±25 against the instrument's own history, and do not run MACD beside it — they are the same read.
◆ Interactive check
Do you know what TSI smooths?
Questions traders ask about the True Strength Index
A momentum oscillator by William Blau (1991) that smooths each bar's price change with a 25-period EMA and then a 13-period EMA, divides the result by the same double-smoothed absolute change, and multiplies by 100. It runs between roughly −100 and +100 with a 7-period EMA signal line.
Momentum = close − prior close. Numerator = EMA(EMA(momentum, 25), 13). Denominator = EMA(EMA(|momentum|, 25), 13). TSI = 100 × numerator ÷ denominator. Signal = EMA(TSI, 7).
Blau's 25/13/7 on daily and 4-hour charts. For a slower regime read use 40/20/10; for faster intraday timing 13/7/5, with a level. On 4-hour crypto a 9-period signal line reduces whipsaw. Shortening the periods removes the smoothing that is TSI's point.
Take direction from the zero line — longs above, shorts below. Wait for TSI to pull back toward zero without crossing it, then enter on the signal-line cross in the trend direction at a level such as an order block. Stop under the level. Exit on the signal cross down from the extended zone or on a structure break, whichever comes first.
Both are smoothed momentum with a signal line and a zero-line trend filter. MACD is in price units, so +5 means different things on different charts; TSI is normalised by absolute momentum, so its levels are comparable everywhere. MACD has a histogram; TSI does not. They carry the same information and should not be run together.
Lagging on the zero cross, by several bars, because of the double smoothing. Its divergence — a lower TSI high against a higher price high — leads the zero cross and is the earliest read it gives.
Extended momentum by convention, not overbought and oversold in the RSI sense. TSI can stay above +25 for weeks in a strong trend. The useful event is the signal-line cross down from above +25, which marks a pullback in an uptrend or the short trigger in a downtrend.
On 4-hour and daily BTCUSDT and ETHUSDT charts with the zero-line filter and a level, yes — the worked example on this page is a 4-hour ETH trade. A 9-period signal line helps with 24-hour noise.
No. It is built from completed closes and EMAs of them; values do not change after the bar closes.
The TradingView built-in is exact. The library supplies the level (Order Blocks with Volume), the divergence coverage (Multi-Oscillator Divergence Scanner) and a multi-timeframe momentum read (MACD Matrix). Zeno, the premium engine, prints signals with stops and targets.
References & Related Guides
Read next
- MACD Indicator: Complete Guide
- RSI Indicator: Complete Guide
- Stochastic RSI
- Stochastic Momentum Index
- Divergence Trading
- Momentum Trading Strategy
- Order Blocks: Complete Guide
- Schaff Trend Cycle
- MACD Matrix (free indicator)
- Multi-Oscillator Divergence Scanner (free indicator)
- Divergence — glossary
- Zeno — the premium engine