Coppock Curve: The Long-Term Buy Signal Explained
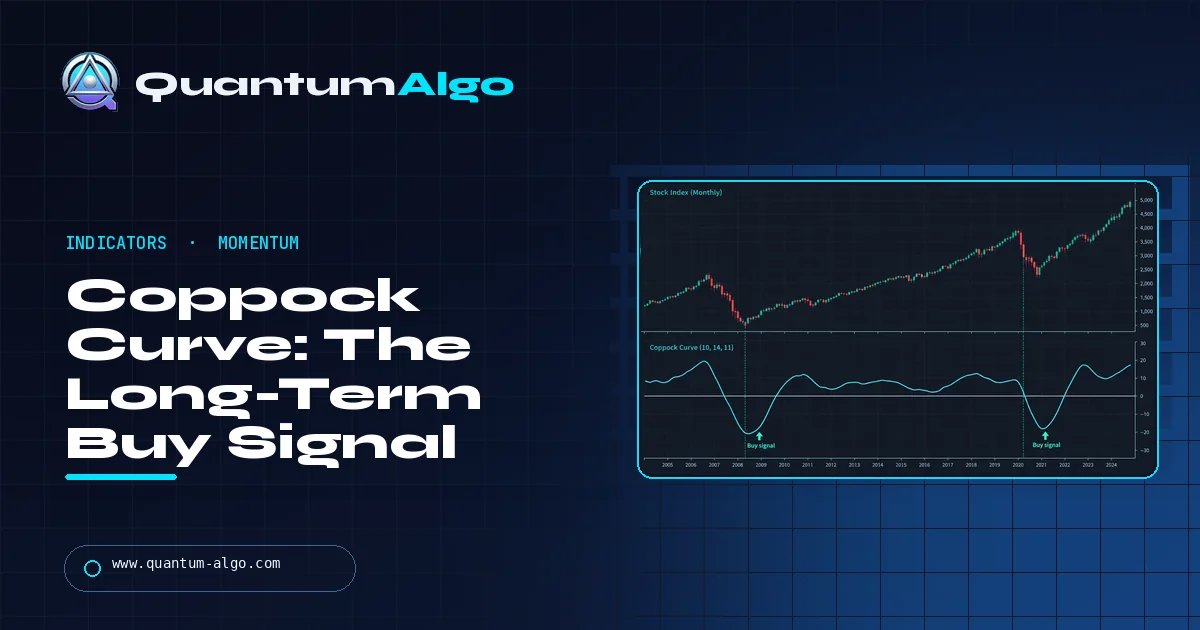
The Coppock Curve is a long-term momentum indicator created by Edwin Coppock and published in Barron's in 1962. On monthly data it adds the 14-month and 11-month rate of change of a stock index and smooths the sum with a 10-month weighted moving average. Its classic signal is a buy when the curve turns up from below zero, which has tended to appear after major bear markets have ended. It was designed for buy signals on broad indices only; it gives few signals, often late, and is best used as a slow confirmation that a market bottom is behind you, not to time trades.
Most momentum indicators are built for days and weeks. The Coppock Curve was built for decades. It looks at a stock index on monthly data, waits for a long decline to lose steam, and flags the turn. This guide explains where it came from, the formula, how the signal works, how traders adapt it to other timeframes and markets, and what its record really looks like. A calculator below builds the curve from your own monthly closes.
Indicators that prove themselves in public.
One engine, four precision tools — the Gold (XAU) Scalper, the institutional Gravity Zone, the Zeno momentum Oscillator, and Zeno Stocks for equities.
What is the Coppock Curve?
The Coppock Curve is a long-term momentum indicator designed to spot buying opportunities in broad stock indices after major declines. It was created by Edwin Sedgwick Coppock, an American economist and investment adviser, and first published in Barron's in October 1962.
Coppock's story is unusual. He was reportedly asked by the Episcopal Church for a way to identify long-term buying points, and he reasoned that markets "grieve" over losses much as people do. He asked church leaders how long mourning typically lasted, was told 11 to 14 months, and used those two periods in his formula. The anecdote is often repeated; what matters for traders is that the indicator measures how quickly long-term momentum is recovering after a slump.
It belongs to the family of momentum tools built from the rate of change, like MACD but on a far slower clock. On a monthly chart it may give one buy signal every few years.
How is the Coppock Curve calculated?
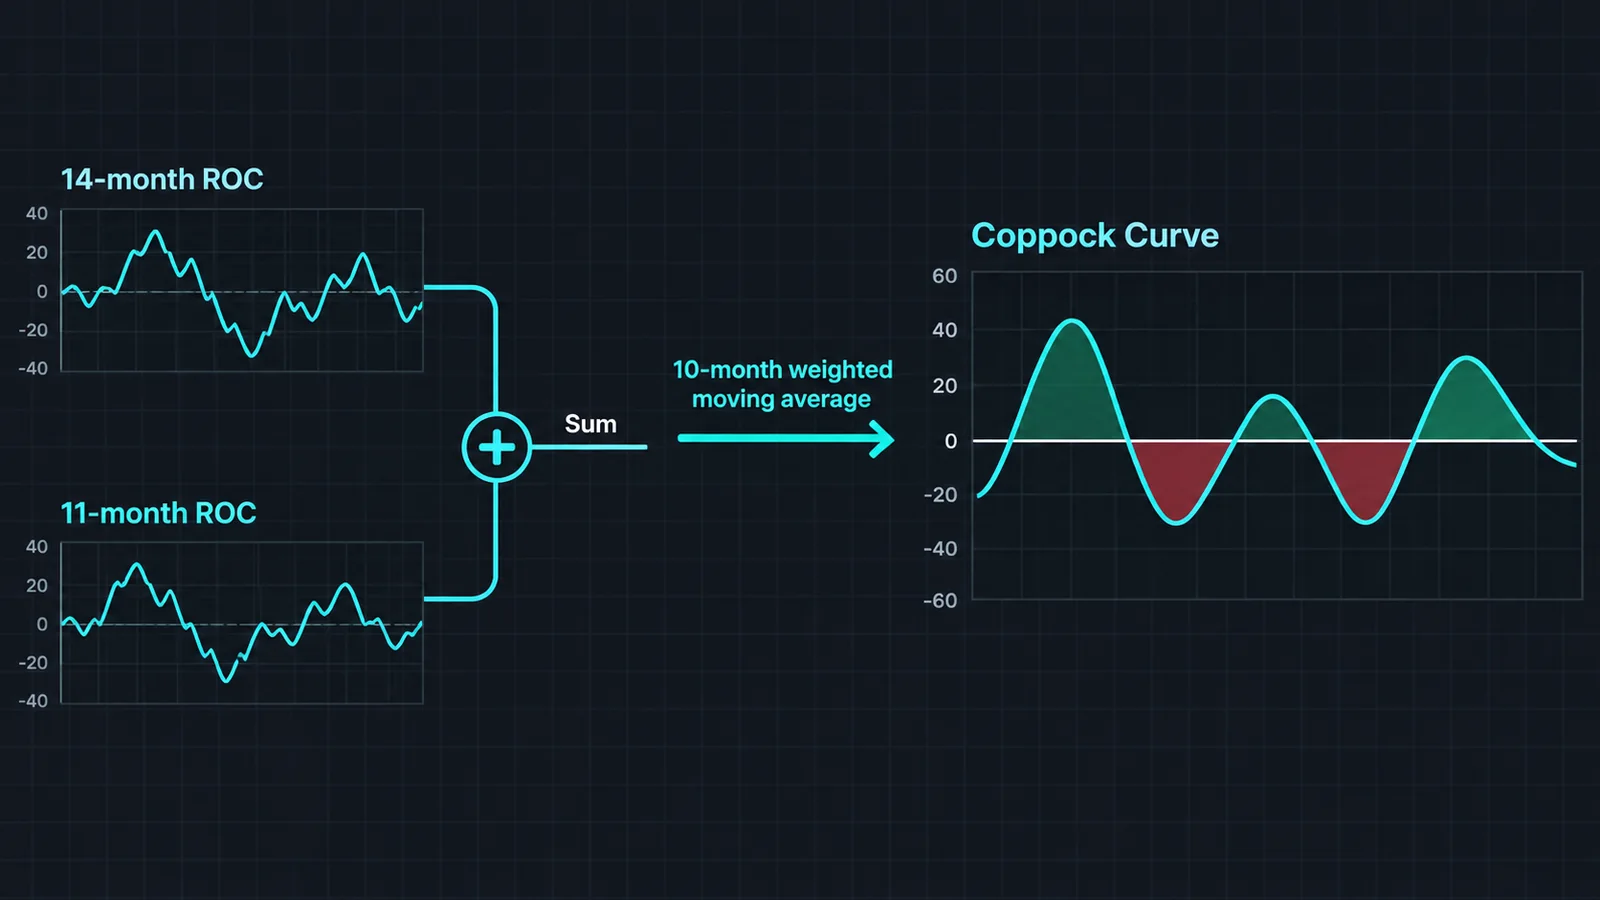
On monthly closes:
- Calculate the 14-month rate of change: (this month's close ÷ the close 14 months ago − 1) × 100.
- Calculate the 11-month rate of change the same way with an 11-month look-back.
- Add the two together.
- Smooth the sum with a 10-period weighted moving average, which gives the most recent month the largest weight (10), the month before 9, and so on down to 1.
The result oscillates around zero. Above zero, prices are higher than they were a year or so ago on a smoothed basis; below zero, they are lower. Because the weighted average favours recent months, the curve turns sooner than a simple average would, but it is still a slow indicator.
On TradingView the built-in Coppock Curve indicator uses these defaults (WMA length 10, long ROC 14, short ROC 11). Apply it to a monthly chart to match the original method.
What is the Coppock Curve buy signal?
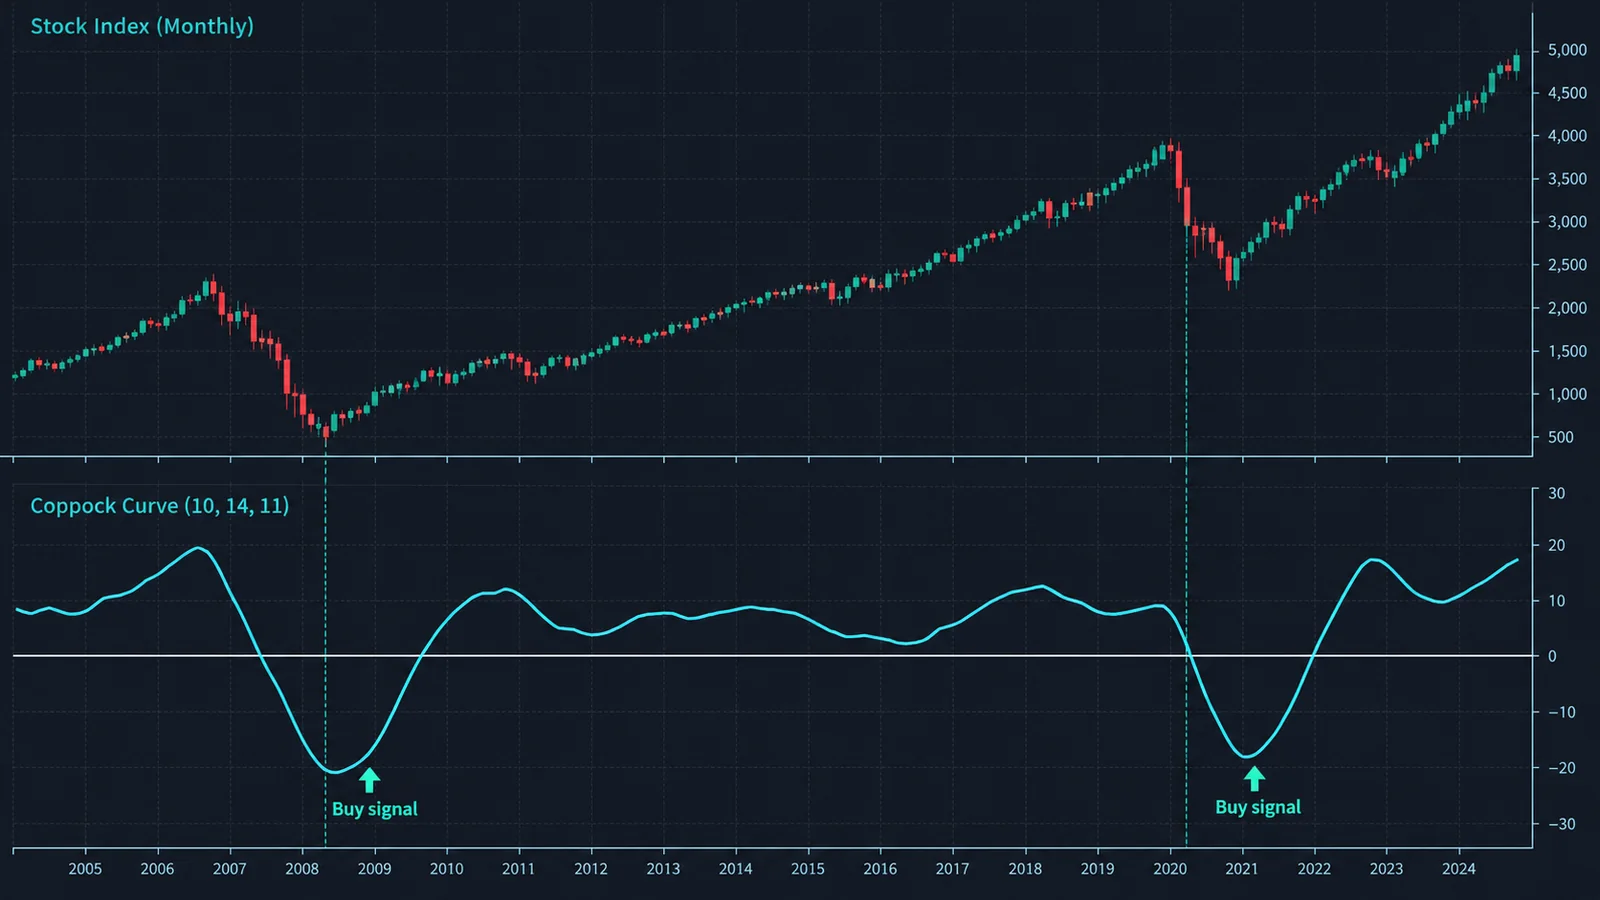
The classic rule is simple: buy when the Coppock Curve turns up from below zero. In other words, momentum has been negative for a long stretch and has started to improve. Coppock did not define a sell signal; he saw the indicator as a tool for long-term investors to find good entry points after bear markets.
Some practical details traders add:
- Depth matters. Turns from deep negative readings, after long and severe declines, have tended to be more meaningful than shallow dips just below zero.
- Use the month-end value. The curve can tick up mid-month and turn back down. Waiting for the monthly close avoids false hooks.
- Expect lateness. By construction the curve turns months after the price low. In exchange, it rarely triggers during a decline that still has much further to go.
Some traders also watch for the curve turning down from high positive readings as a warning that long-term momentum is fading, but that is a later adaptation, not part of the original method, and it has been less reliable.
Coppock Curve calculator
Paste at least 25 monthly closes of an index, oldest first. You can copy them from a monthly chart or a data download. The calculator applies the formula with the settings you choose and tells you the current value, its direction and whether the classic buy signal is active. The default data is illustrative, not a real market.
Coppock Curve settings for other timeframes and markets
The 14/11/10 settings were designed for monthly data on broad US indices. Traders have adapted the indicator in a few ways:
| Use | Typical settings | Notes |
|---|---|---|
| Original: stock indices | Monthly, ROC 14 and 11, WMA 10 | Rare, slow buy signals after bear markets |
| Weekly swing view | Weekly, same settings or scaled up | More signals, more false hooks |
| Daily charts | Daily, same settings | Becomes a fast momentum oscillator; the "grief" logic no longer applies |
| Individual stocks | Monthly or weekly | Works less well: single companies can stay depressed for good reasons |
| Crypto and commodities | Weekly or monthly | Used by some to spot cycle turns; volatility makes signals noisier |
Once you leave monthly data on a diversified index, you are using a different indicator in practice: a smoothed rate-of-change oscillator. That can be useful, but judge it on its own record, not on the reputation of the original.
How reliable is the Coppock Curve?
On major US indices, the monthly Coppock buy signal has tended to appear after the worst of big bear markets was over, for example in the years following the 1974, 1982, 2003 and 2009 lows, and it has rarely fired in the middle of a crash. That is its appeal.
Its weaknesses are just as clear:
- Few signals. A handful per decade makes any statistic fragile.
- Late entries. Signals often come several months and a meaningful distance above the low.
- Whipsaws in sideways markets. In long, choppy periods the curve can hover around zero and hook up more than once.
- No exit rule. The original tells you when to buy but not when to sell, so results depend heavily on how you exit.
- Not for every market. Single stocks, sectors in structural decline or thinly traded markets do not share the recovery behaviour of a broad index.
Treat the Coppock Curve as a slow confirmation that a long-term bottom is behind you, and combine it with price structure and breadth. A buy signal while the index is reclaiming its long-term moving average and breadth is improving carries far more weight than the curve alone.

Automate your trades. Let Quantum Algo trade for you.
Every signal executed on your own account — on your account, with the plan you define.
Coppock Curve vs other momentum indicators
| Indicator | Built from | Speed | Main use |
|---|---|---|---|
| Coppock Curve | 14- and 11-period ROC, 10-period WMA | Very slow on monthly data | Long-term buy points after bear markets |
| MACD | 12- and 26-period EMAs, 9-period signal | Medium | Trend and momentum shifts |
| KST (Know Sure Thing) | Four smoothed rates of change | Medium to slow | Cycle turns |
| Rate of change | Price vs N periods ago | Depends on N | Raw momentum |
| Ultimate Oscillator | Buying pressure over three periods | Fast | Short-term divergences |
The Ultimate Oscillator and MACD answer short- and medium-term questions. The Coppock Curve answers one long-term question: has the slump ended?
Coppock Curve and Quantum Algo
A Coppock buy signal tells a long-term investor that the backdrop has improved. It does not provide an entry level, a stop or a target, and it says nothing about the next few weeks.
The free Quantum Algo indicators mark structure, liquidity and trend on TradingView, which is where a long-term backdrop turns into a plan. Zeno, the premium engine from Quantum Algo (QuantumAlgo), prints signals with an entry, a stop and two targets on indices, stocks, gold, forex and crypto, and every call is on the public track record.
The Coppock Curve adds the 14-month and 11-month rates of change of a stock index and smooths the sum with a 10-month weighted moving average. Its classic signal is a buy when the curve turns up from below zero, which has tended to come after major bear markets ended. Signals are rare, late and buy-only, so use the curve on broad indices as a slow confirmation, together with price structure and breadth.
◆ Interactive check
How well do you know the Coppock Curve?
Questions traders ask about the Coppock Curve
A long-term momentum indicator for stock indices. On monthly data it adds the 14-month and 11-month rate of change and smooths the result with a 10-month weighted moving average.
The curve turning up from below zero, read on the monthly close. It suggests long-term momentum is recovering after a bear market.
Not in Edwin Coppock's original method, which was designed for buy signals only. Some traders treat a downturn from high positive readings as a warning, but that is a later adaptation.
The original 14, 11 and 10 on monthly data for broad indices. On weekly or daily charts the same settings work as a faster momentum oscillator with more false signals.
Yes. TradingView has a built-in Coppock Curve with WMA length 10, long ROC 14 and short ROC 11. Use a monthly chart to match the original.
It was designed for diversified indices. Traders apply it to single stocks and crypto, but signals are noisier because a single asset can stay weak for structural reasons.
Coppock reportedly based them on the typical length of mourning after a loss, reasoning that markets recover from declines in a similar way. The periods have stuck mainly because they work reasonably on monthly index data.
Not for short-term timing. It is slow and its signals often come months after the low. It is better as confirmation that a long-term bottom is likely behind you.
References & Related Guides
Read next
- MACD
- Momentum Trading Strategy
- Ultimate Oscillator
- Moving Averages
- Advance/Decline Line
- Stage Analysis
- Aroon Indicator
- Schaff Trend Cycle
- Stochastic Momentum Index
- Backtesting a Trading Strategy
- Free TradingView indicators
- Zeno — the premium engine