Andrews Pitchfork: How to Draw It, the Median Line and How to Trade It
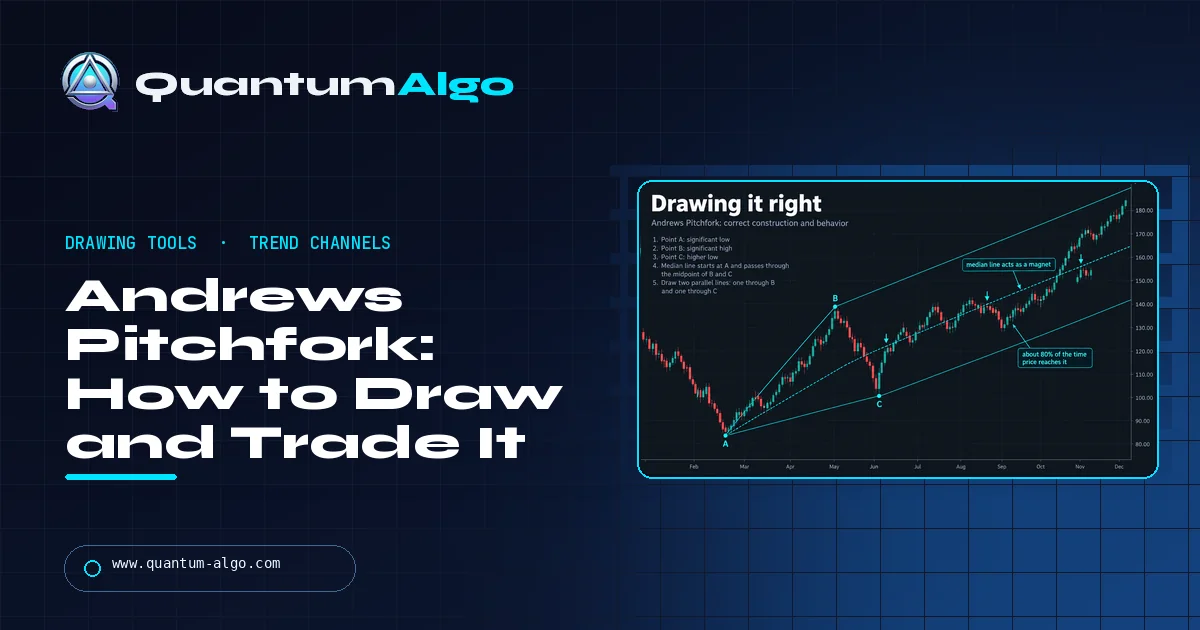
The Andrews pitchfork is a trend channel drawn from three alternating pivots. A median line runs from the first pivot (A) through the midpoint of the next two (B and C), and two parallel lines through B and C form the outer tines. Price tends to rotate between the tines and drift back to the median line; a clean break of a tine warns that the trend is changing. Use the Schiff or modified Schiff version when the standard fork is too steep.
Most channel tools describe where price has been. Alan Andrews wanted one that projects where it is likely to travel, built from just three swing points. The pitchfork does that, and it is still one of the most used drawing tools on TradingView. This guide covers how to choose the pivots, what the median line really does, when to switch to a Schiff fork, how traders build entries and stops around it, and the mistakes that make a fork useless.
Indicators that prove themselves in public.
One engine, four precision tools — the Gold (XAU) Scalper, the institutional Gravity Zone, the Zeno momentum Oscillator, and Zeno Stocks for equities.
What is the Andrews pitchfork?
The Andrews pitchfork is a trend-channel drawing tool built from three consecutive swing points. A central median line starts at the first pivot and passes through the midpoint of the next two; two lines parallel to it, drawn through the second and third pivots, form the upper and lower "tines". The result looks like a three-pronged fork laid along the trend, which is where the name comes from.
It is named after Alan Hall Andrews, an engineer by training who taught the technique in his Action-Reaction course in the mid-20th century. His starting idea was older than the tool: markets tend to answer one swing with a proportional swing in the other direction, and a trend has a centre of gravity that price keeps returning to. The pitchfork is a way to draw that centre line in advance. Practitioners also call the method median line analysis.
Unlike a moving average or a Donchian channel, nothing is calculated from every bar. You choose three pivots and the geometry does the rest, which makes the tool fast to apply and also easy to misuse: the fork is only as good as the pivots you pick.
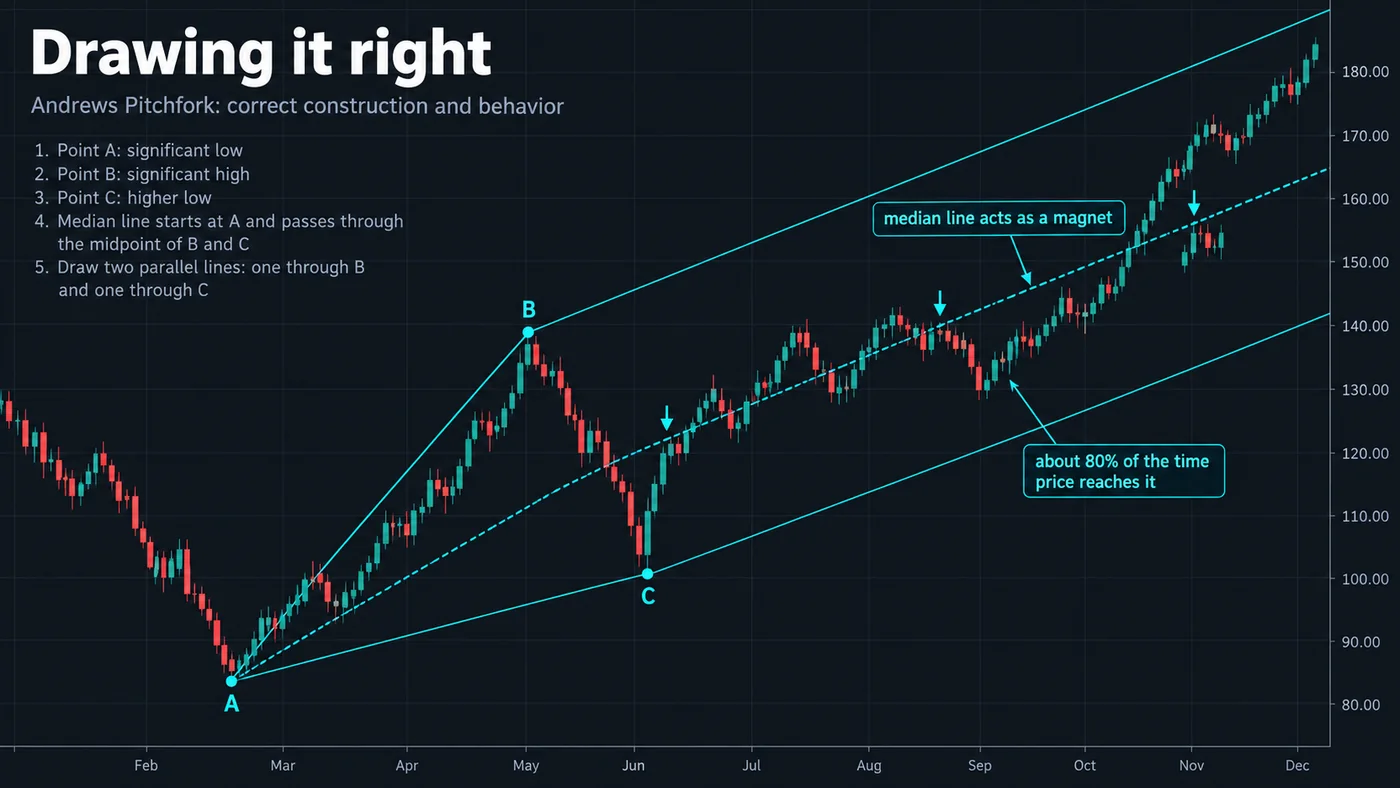
How do you draw an Andrews pitchfork?
You need three pivots that alternate: a low, a high, then a low (for a rising fork), or a high, a low, then a high (for a falling fork).
- Pivot A is the start of the move you want to measure: a significant swing low in an uptrend or a swing high in a downtrend.
- Pivot B is the next swing extreme in the other direction: the first meaningful high after A in an uptrend.
- Pivot C is the pullback that follows: a higher low that retraces part of A–B without going below A.
- Find the midpoint of B and C and draw the median line from A through it, extended to the right.
- Draw the upper tine through B and the lower tine through C, both parallel to the median line.
On TradingView the tool is in the left toolbar under the Fibonacci/Gann group as "Pitchfork"; you click A, B and C and it draws the rest. Its settings let you switch the style between Original, Schiff, Modified Schiff and Inside, and add extra levels.
The choice of pivots matters more than anything else. Use swing points that are obvious on the timeframe you trade, not minor wiggles. If you have to zoom in to find the pivot, it is probably too small. A good test: would another trader looking at the same chart pick the same three points? If not, the fork is a personal opinion rather than a map of the trend.
What does the median line do?
Andrews treated the median line as the trend's centre of gravity: a level that price tends to return to while the trend is intact. In practice it does three things.
| Behaviour | What you see | How traders read it |
|---|---|---|
| Magnet | Price drifts back to the median line after touching a tine | The median line is the first target of a move off a tine |
| Pivot | Price reaches the median line and reverses | A healthy trend: the next swing heads back to the far tine |
| Fail to reach | Price turns before touching the median line | Weakening trend; the Hagopian rule (below) applies |
You will often see the claim that price reaches the median line "about 80% of the time". It is usually attributed to Andrews himself, but no published test supports a number like that, and it depends entirely on how the pivots are chosen. Treat the median line as a tendency and a target, not a promise. Many strong trends hug one tine for weeks and never revisit the centre.
The useful part is the asymmetry it creates. If price is at the lower tine of a rising fork, the median line gives a nearby, objective first target and the tine gives a nearby invalidation level. That turns a vague "buy the pullback" idea into a trade with a defined risk-to-reward ratio before you enter.
Schiff and modified Schiff pitchforks
The standard fork anchored at pivot A is often too steep, especially when A is the low of a sharp spike. A New York trader, Jerome Schiff, suggested moving the anchor so the fork fits shallower trends. There are two common versions.
| Variant | Anchor point | Effect | When to use it |
|---|---|---|---|
| Standard (Andrews) | Pivot A | Steepest angle | Clean, evenly spaced pivots in a steady trend |
| Schiff | A's bar, but halfway between A and B in price | Flatter fork | The standard fork leaves price far below the median line |
| Modified Schiff | The midpoint of A–B in both time and price | Flatter still, shifted right | Shallow or sideways-leaning trends; slow grinding moves |
All three use the same B and C, so the tines start in the same places; only the angle changes. The calculator below draws all three from your pivots at once, so you can see how much the anchor moves the median line before you commit to one. A practical rule: pick the variant whose median line price has already respected at least once. If none fits, the trend is not orderly enough for a fork.
TradingView's "Inside" style is a fourth option: it draws the fork between the tines of the original rather than on the pivots, and is used less often.
How do you trade with an Andrews pitchfork?
There are two classic approaches. Both assume you have drawn the fork on clear pivots and that the trend direction is confirmed by structure, not by the fork alone.
1. Rotation trades inside the fork
In a rising fork, buy when price pulls back to the lower tine and shows a reaction (a rejection wick, a change of character on a lower timeframe, or a reclaim of the tine after a brief poke below it). The first target is the median line; the second is the upper tine. The stop goes below the lower tine by a volatility buffer, such as half an ATR, or below the swing low that touched it. Mirror everything for a falling fork.
2. Tine breaks
When price closes decisively beyond a tine and then holds it on a retest, the trend is either accelerating (a break in the trend's direction) or changing character (a break against it). In a rising fork, a close below the lower tine followed by a failed retest from underneath is the classic early warning that the uptrend is ending; many traders draw a new fork from the next pivots at that point.
Whichever approach you use, confirm the touch. A fork line on its own is a location, not a signal. Combining it with horizontal support and resistance, a Fibonacci retracement of A–B or a momentum oscillator gives you confluence, and confluence is what makes the line worth trading.
Warning lines, sliding parallels and the Hagopian rule
Andrews and his students added a few tools that extend the basic fork:
- Warning lines are extra parallels placed outside the tines at the same spacing as the tine-to-median distance. When price escapes the fork, they show where the next reaction is likely.
- Sliding parallels are copies of the median line slid onto a new pivot inside the fork. They help mark intermediate support and resistance when price is between the lines.
- Internal lines split the gap between the median line and a tine, often at 50%, for finer targets.
The Hagopian rule, named after one of Andrews' students, says that if price reverses before it reaches the median line, the move in the opposite direction is likely to go further than the previous swing. In a rising fork, a rally that stalls short of the median line and turns down is a warning that the next decline may break the lower tine. It is a useful way to read failure, and it explains why "missed the median line" is often the first visible sign of a weakening trend.
Pitchfork calculator
Enter the bar number and price of pivots A, B and C, a later bar to project to and, if you like, the current price. The calculator returns the median line and both tines at that bar for the variant you pick, says where price sits inside the fork and draws all three variants to scale. The sample is a rising fork.
Andrews pitchfork vs other channel tools
| Tool | Built from | Strength | Weakness |
|---|---|---|---|
| Andrews pitchfork | Three pivots | Projects a centre line and a slope before price gets there | Depends entirely on pivot choice |
| Trendlines and parallel channels | Two touches plus a parallel | Simple and widely watched | No centre target; needs two touches before it exists |
| Linear regression channel | Every close in a window | Objective; no pivot choice | Recalculates as new bars arrive |
| Keltner channels | EMA plus ATR | Adapts to volatility | Flat in ranges; no slope projection |
| Gann fans and angles | One pivot plus fixed angles | Combines time and price | Angles depend on chart scaling |
The pitchfork's advantage is that it gives a slope and a target from only three points, so it is available early in a trend. Its disadvantage is subjectivity. Many traders use it alongside one objective tool, such as a regression channel or a moving average, and only trade where the two agree.
What mistakes do traders make with pitchforks?
- Using minor pivots. A fork drawn on small swings is redrawn every few bars and predicts nothing. Use the swings that define the trend on your timeframe.
- Forcing a fork onto a range. In a sideways market the median line is nearly flat and the tines are just support and resistance. Use horizontal levels instead.
- Ignoring the variant. If price has never touched the standard median line, try Schiff or modified Schiff before giving up on the fork, and before deciding the trend is "overextended".
- Trading every touch. A touch is a location. Wait for a reaction, a lower-timeframe structure shift or confluence with another level.
- No stop beyond the tine. Tines get pierced. Put the stop beyond the tine plus a volatility buffer, or beyond the pivot that touched it.
- Keeping a broken fork. Once price closes beyond a tine and confirms on the retest, the old fork has done its job. Draw a new one from the latest pivots.
Reference data
| Item | Detail |
|---|---|
| Creator | Alan Hall Andrews (Action-Reaction course) |
| Inputs | Three alternating pivots: A, B, C |
| Median line | From the anchor through the midpoint of B–C |
| Tines | Parallels to the median line through B and C |
| Variants | Standard, Schiff, modified Schiff, Inside (TradingView) |
| Add-ons | Warning lines, sliding parallels, internal lines, Hagopian rule |
| On TradingView | Drawing tool "Pitchfork"; style setting switches the variant |
| Best on | Trending markets with clear swings, any timeframe |
How does the pitchfork fit with Quantum Algo's indicators?
A pitchfork is only as good as its pivots, and choosing pivots consistently is where most traders struggle. The free Quantum Algo indicators mark swing points, structure breaks and liquidity on TradingView, so you can anchor A, B and C on the same swings every time instead of eyeballing them. Zeno, the premium engine from Quantum Algo (QuantumAlgo), prints its own buy and sell signals with an entry, a stop and two targets; a fork tine or median line that lines up with a Zeno level is the kind of confluence worth acting on. Every Zeno call is on the public track record.
The Andrews pitchfork draws a trend channel from three alternating pivots: a median line from A through the midpoint of B–C and two parallel tines through B and C. Price tends to rotate between the tines and back to the median line, but that is a tendency, not a rule. Pick obvious pivots, switch to a Schiff fork when the standard one is too steep, trade reactions at the lines rather than touches, and redraw once a tine breaks and holds.
◆ Interactive check
Can you draw and read a pitchfork?
Questions traders ask about the Andrews pitchfork
A trend-channel drawing built from three alternating pivots: a median line from the first pivot through the midpoint of the other two, plus two parallel tines through the second and third pivots.
Alan Hall Andrews, who taught it in his Action-Reaction course. Jerome Schiff later proposed the flatter Schiff variant.
Pick a significant swing (A), the next opposite swing (B) and the following pullback (C). Draw the median line from A through the midpoint of B and C, then the tines through B and C parallel to it.
That figure is widely repeated and usually attributed to Andrews, but there is no published test behind it. Treat the median line as a tendency and a target.
The standard fork is anchored at pivot A. The Schiff fork moves the anchor halfway up A–B in price, and the modified Schiff moves it halfway in both time and price, producing flatter forks.
Either trade rotations (buy reactions at the lower tine of a rising fork, target the median line then the upper tine, stop beyond the tine) or trade confirmed tine breaks with a retest.
If price reverses before reaching the median line, the move in the opposite direction is likely to extend further than the previous swing.
Extra parallels outside the tines at the same spacing as the tine-to-median gap, used when price escapes the fork.
Yes. The "Pitchfork" drawing tool takes three clicks, and its style setting switches between Original, Schiff, Modified Schiff and Inside.
Any timeframe with clear, evenly spaced swings. Higher timeframes give more reliable pivots; on low timeframes the fork needs redrawing more often.
References & Related Guides
Read next
- Trendline Trading
- Support and Resistance
- Swing Points
- Fibonacci Retracement
- Gann Square of 9
- Elliott Wave Theory
- Keltner Channels
- Donchian Channels
- TradingView Platform Guide
- Stage Analysis
- Free TradingView indicators
- Zeno — the premium engine