Three Line Strike Pattern: Rules, Real Odds and How to Trade It
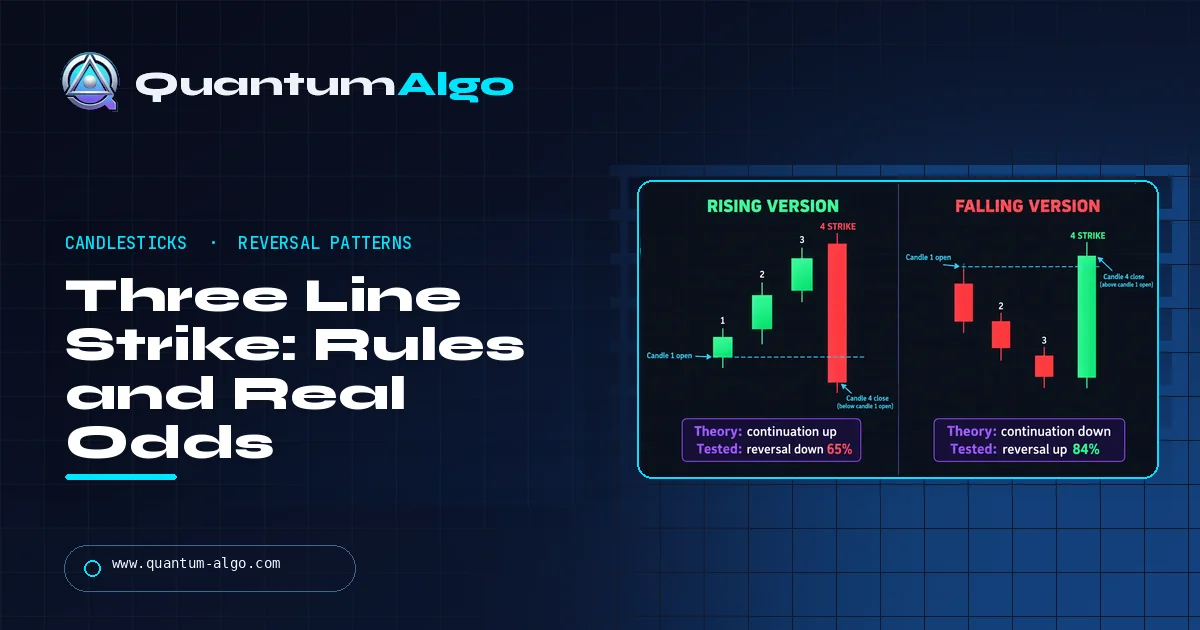
A three line strike is a four-candle pattern: three candles moving in one direction, then a fourth candle that opens beyond the third close and closes past the first candle's open. Textbooks call it a continuation pattern, but Thomas Bulkowski's tests found it reversed 65% (rising version) and 84% (falling version) of the time. Trade it only after a breakout close.
The three line strike is one of the strangest patterns in the candlestick books: it's taught as a continuation signal, yet the best-known test data says it usually reverses. It's also rare, often mislabeled, and missing from TradingView's built-in pattern set. This Quantum Algo guide sorts out the naming mess, shows what Thomas Bulkowski's numbers really say (and what he warns about them), and walks through a full trade with real prices, a Pine script you can paste, and a calculator that checks any four candles for you.
Indicators that prove themselves in public.
One engine, four precision tools — the Gold (XAU) Scalper, the institutional Gravity Zone, the Zeno momentum Oscillator, and Zeno Stocks for equities.
What does a three line strike look like, candle by candle?
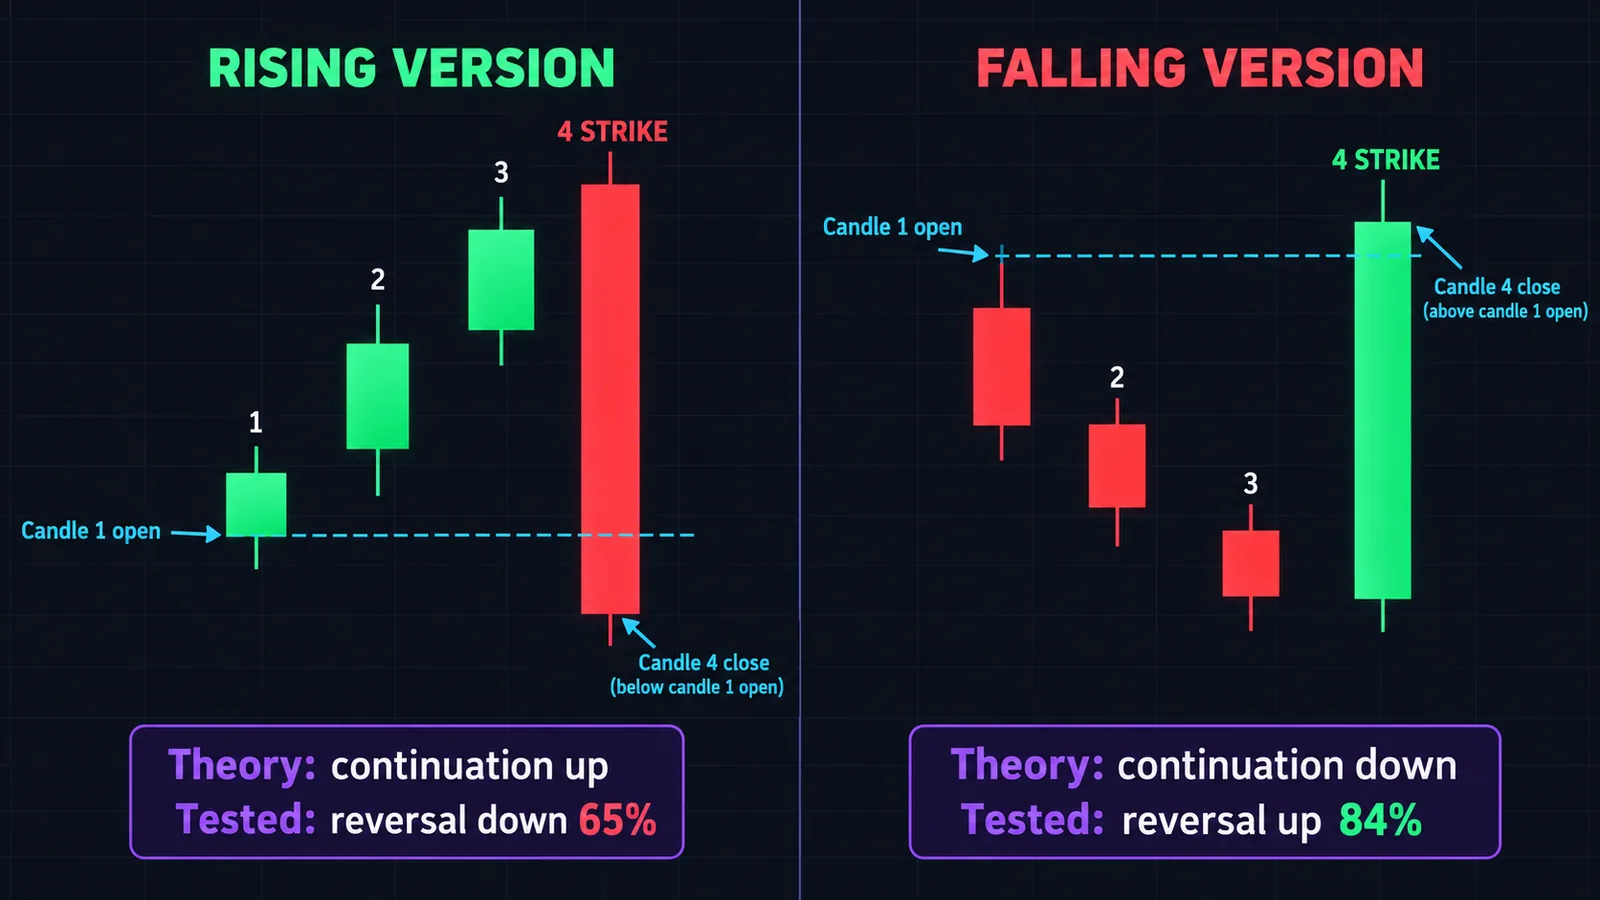
The pattern always has four candles, and the first three do all the setting up. In the rising version, three white (up) candles march higher, each closing above the one before, inside an existing uptrend. Then a single tall black candle opens at or above the third close and sells off so hard that it closes below the open of the first candle. One bar wipes out three bars of progress.
The falling version is the mirror image. Three black candles step lower in a downtrend, each closing below the last. The fourth candle is a tall white one that opens at or below the third close and rallies to finish above the open of the first black candle. That fourth bar is the "strike" in the name: it hits through all three lines at once.
Here are the rules we use, which follow Thomas Bulkowski's identification guidelines on ThePatternSite and are also the rules the calculator further down checks:
| Rule | Rising version | Falling version |
|---|---|---|
| Prior trend | Up | Down |
| Candles 1 to 3 | Three white candles, each close higher | Three black candles, each close lower |
| Candle 4 color | Black (close below open) | White (close above open) |
| Candle 4 open | At or above candle 3's close | At or below candle 3's close |
| Candle 4 close | Below candle 1's open | Above candle 1's open |
| Bulkowski's name | Bullish three-line strike | Bearish three-line strike |
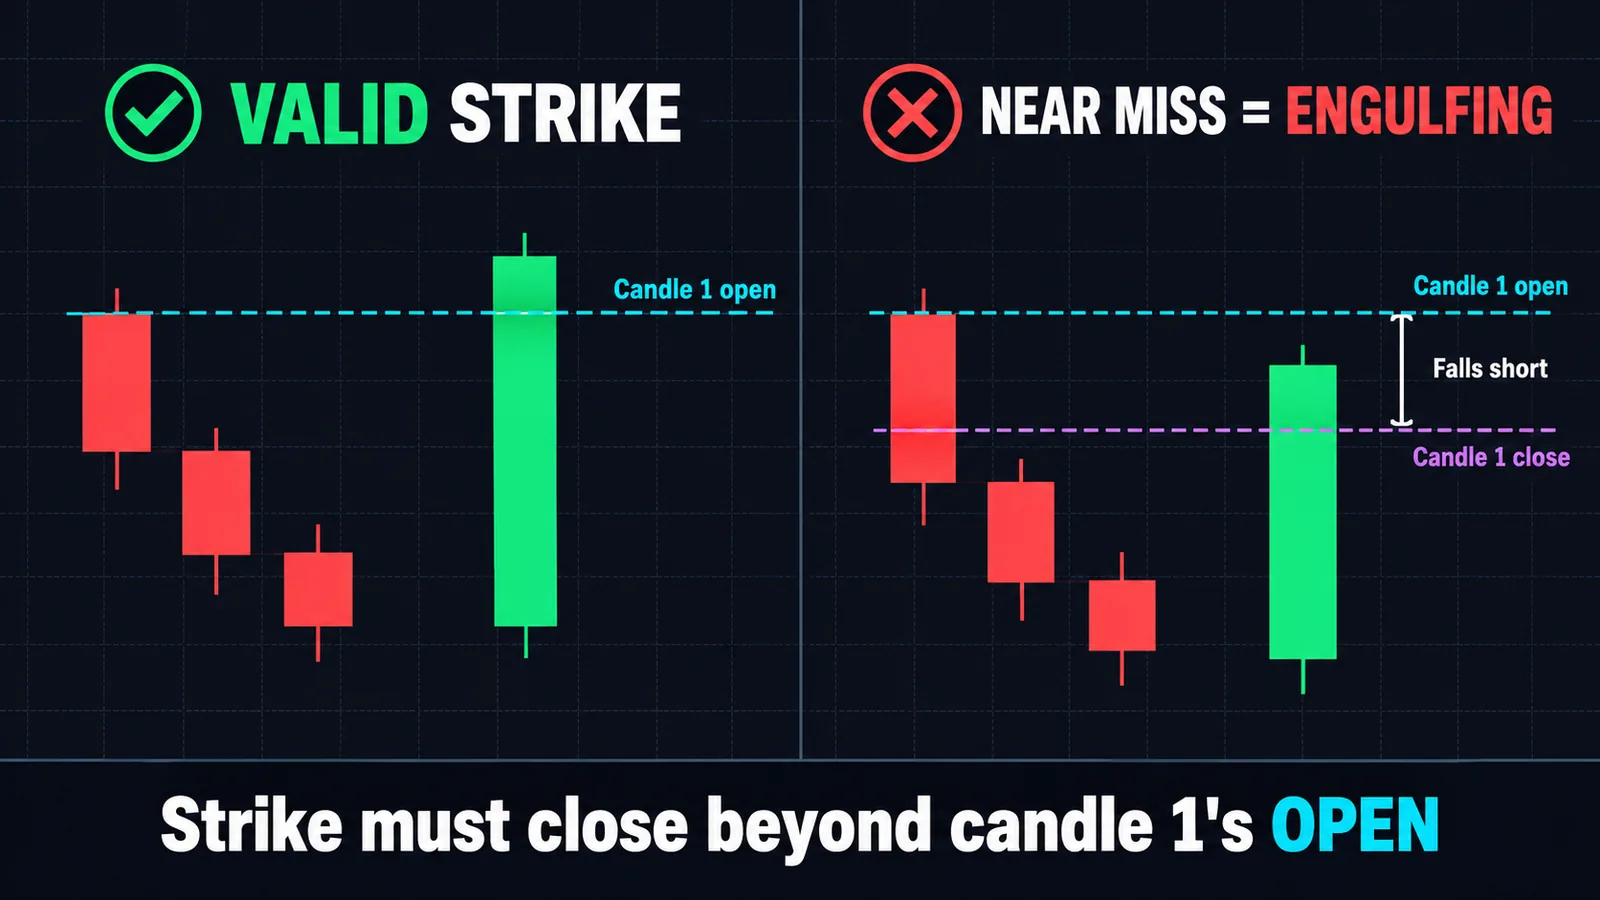
Two details trip people up. First, the strike candle has to close beyond the open of candle 1, not just beyond its close. Closing past candle 1's close is only a big engulfing bar, which is a different and far more common signal (our engulfing candle guide covers it). Second, the rules say nothing about wicks on the first three candles. A clean stair-step, with higher highs and higher lows in the rising version, is nicer, but it isn't required. Our calculator gives extra strength points for it rather than rejecting patterns that lack it.
On a chart that trades nearly around the clock, such as spot forex or crypto, the strike candle's open is usually right at the prior close. So the "opens at or above" rule is met almost by default. On stocks, a gap open in the direction of the three-candle run, followed by a full reversal inside the same session, is the textbook look, and it tends to carry more information because the gap traps late buyers (or sellers) right at the top of the move.
Why are the bullish and bearish names so confusing?
Read five articles on this pattern and you'll find the same four candles called both bullish and bearish. That isn't sloppiness by one writer. It comes from two naming systems colliding.
In the classic candlestick literature that Bulkowski tests, the name follows the trend the pattern is supposed to continue. Three rising white candles plus a black strike is the "bullish three-line strike" because theory expects the uptrend to resume after the one-bar shakeout. Three falling black candles plus a white strike is the "bearish three-line strike" because the downtrend is supposed to carry on.
Many trading blogs, and some TradingView scripts, flip that around and name the pattern after the color of the strike candle or the direction they expect next. So the three-black-plus-white version shows up as a "bullish three line strike" on plenty of sites. Same candles, opposite label.
◆ How to stay sane: describe the pattern by its structure, not its adjective. In this guide, the rising version means three up candles struck by a down candle, and the falling version means three down candles struck by an up candle. When you read a statistic anywhere, check which structure it refers to before you use it.
This matters more than it sounds. The headline statistic people quote, "84% reversal", belongs to the falling version only. If you apply it to the rising version because both happened to be labeled "bullish" on different sites, you're quoting a number for the wrong pattern.
What did Bulkowski's testing actually find?
Thomas Bulkowski, author of the Encyclopedia of Candlestick Charts, publishes per-pattern statistics on ThePatternSite. His three-line strike pages are the only widely cited dataset on this pattern, so they're worth reading carefully, including the parts most articles skip.
| Measure | Rising version (his "bullish") | Falling version (his "bearish") |
|---|---|---|
| Theory says | Bullish continuation | Bearish continuation |
| Tested behavior | Bearish reversal 65% of the time | Bullish reversal 84% of the time |
| Overall performance rank | 2 of 103 | 1 of 103 |
| Frequency rank (103 = rarest) | 95 | 94 |
| Sample he found | 69 patterns | 85 patterns in over 4.7 million candle lines |
So in his data, both versions behaved more like reversals than continuations, and the falling version did so far more convincingly. That's the core finding and the main reason this pattern gets so much attention.
The fine print most guides leave out
Bulkowski himself is cautious about these results, and he says so plainly. On the rising version he writes that drawing conclusions from what appears to be top-rated performance "is risky and should be avoided," and that the candle "doesn't perform as well as the numbers suggest." Its best 10-day average move of 16.91% came from just two patterns. On the falling version he notes that the statistics "may change with additional samples."
A sample of 69 or 85 patterns, spread across different market conditions and breakout directions, is thin. Split it by bull and bear markets and by up and down breakouts, as his tables do, and some cells hold only a handful of cases. A top performance rank built on a small sample is a weak foundation for a trading plan.
His tips, with page references
- Falling version: patterns that appear within a third of the yearly low perform best (book p. 759), and they act as reversals most often within a third of the yearly high (p. 761).
- Falling version: trade the ones that appear in a downward retracement of an upward price trend (p. 761). In plain English, buy the strike when an uptrend is pulling back, not when a bear market is grinding lower.
- Rising version: after a downward breakout from the pattern in an uptrend, wait three days before selling (p. 770), and pay attention to volume (p. 769).
The honest summary: the data leans toward "reversal" and against the textbook "continuation" label, the falling version has the stronger case, and the sample is small enough that you should treat it as a hypothesis to test on your own market rather than a proven edge.
Why does a 'continuation' pattern keep reversing?
Look at where the pattern ends. In the falling version, the strike candle closes above the open of candle 1, which means price finishes near the top of the whole four-candle structure. To register an upside breakout, price only needs one more close above the pattern's high. To register a downside continuation, it has to fall all the way through the bottom of a candle that just covered three days of selling. Bulkowski points to exactly this: the close sits near the top, so an upward breakout can happen quickly while a downward breakout needs a much longer drop.
The rising version works the same way in reverse. The strike candle closes near the bottom of the structure, so a reversal only needs one more weak close.
There's also a behavioral story, and it's the one most chart readers will recognize. The strike candle is, functionally, a very large engulfing candle. It engulfs not one prior body but three. A move that erases three sessions of trend in one bar usually reflects a real shift in who is in control: shorts covering in a hurry, or buyers who chased three green days dumping at once. Traders who know the textbook "continuation" reading often fade that bar. When it holds, they're trapped on the wrong side and their stops add fuel, the same mechanism we describe in the bull trap and bear trap guide.
None of this means the continuation reading is always wrong. In a strong trend, especially on intraday charts, the strike candle can be a one-bar flush that resets positioning before the trend resumes. That's why the pattern needs confirmation before you treat it as either outcome.
Which confirmation rules separate good strikes from noise?
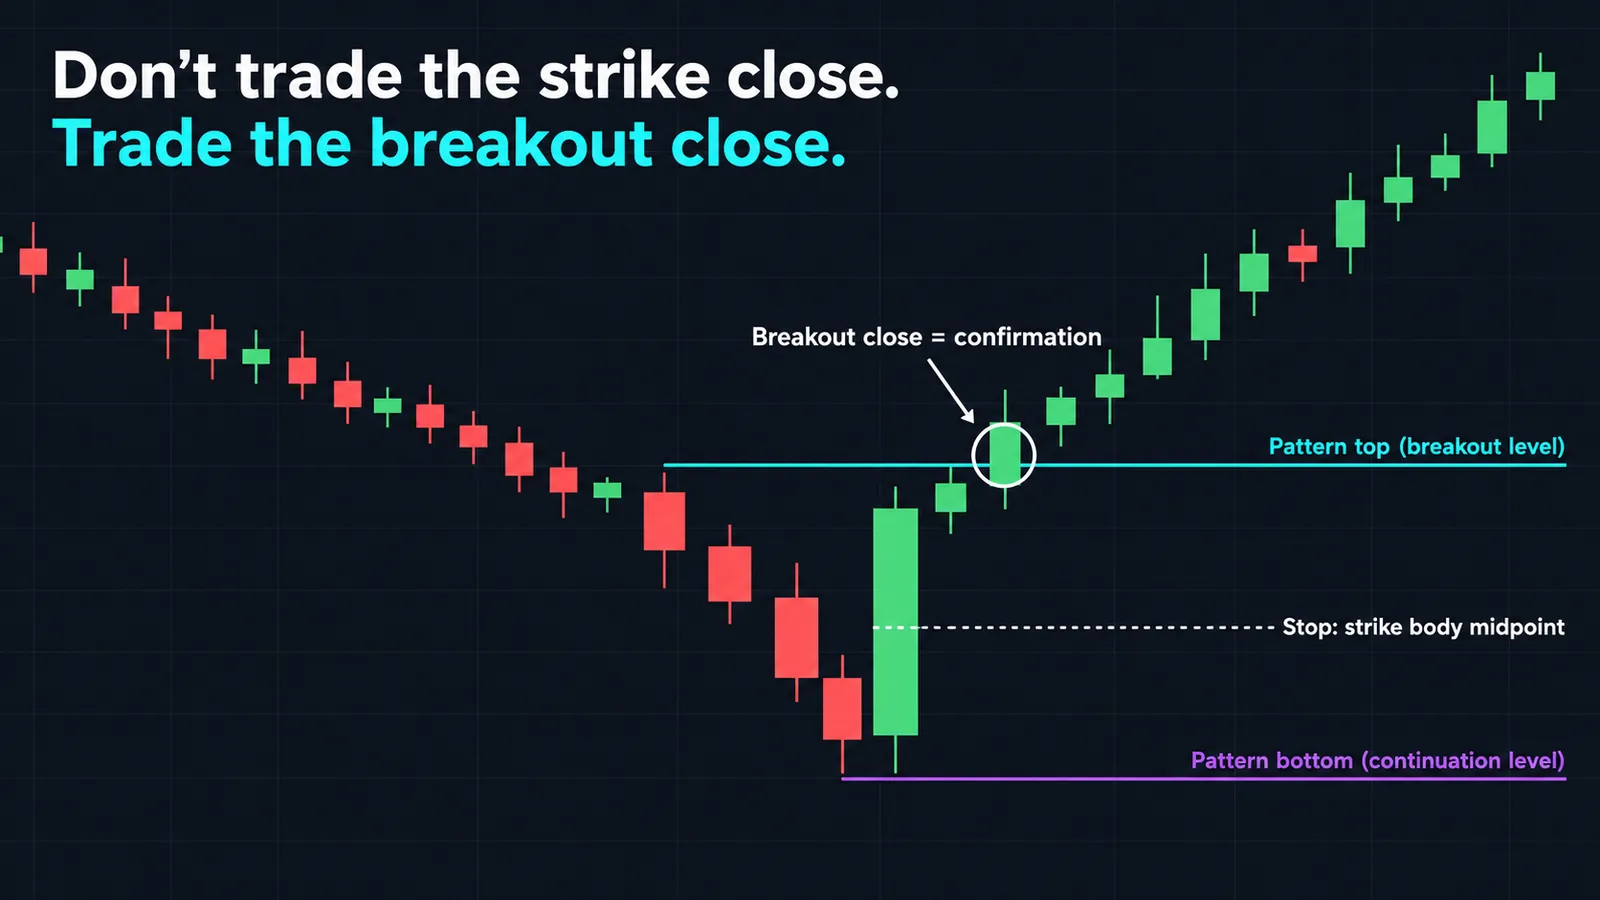
We don't trade the strike candle's close. The pattern tells you a fight just happened. The next few bars tell you who won. These are the filters we'd apply, roughly in order of importance:
- Breakout close. Treat the pattern's top and bottom (the highest high and lowest low across all four candles) as the boundaries, which is how Bulkowski measures breakouts. For the falling version, a close above the top favors the reversal; a close below the bottom favors continuation. Do nothing while price stays inside.
- Location in the bigger range. Bulkowski's own tips point here. A falling-version strike that forms near support, within a third of the yearly low, or as a pullback inside a larger uptrend, deserves more weight than one in the middle of nowhere. Our premium and discount zones guide is a useful way to frame "where in the range" this is happening.
- Strike candle quality. A strike body at least as large as the three prior bodies combined, closing beyond all three highs (or lows), shows real force. A barely qualifying strike that closes a tick past candle 1's open is weak.
- Volume. On stocks and futures, the strike candle should print noticeably heavier volume than the three candles before it. A big-range bar on light volume is often a thin-market spike. If you want a numeric read on that force, the Force Index combines price change and volume in one line.
- Trend context. Check the higher timeframe. A falling-version strike that forms against a strong daily downtrend is fighting the tide. One that forms as a dip in a rising market is swimming with it.
▲ Rule of thumb: if you need more than two bars after the strike to get a breakout close, the signal is going stale. Many traders drop it after three to five bars without a decision.
Worked example: a falling-version strike with real numbers
Here's a daily chart of a hypothetical stock that has been sliding for two weeks. The last four candles:
| Candle | Open | High | Low | Close |
|---|---|---|---|---|
| 1 (black) | 52.40 | 52.60 | 50.90 | 51.10 |
| 2 (black) | 51.20 | 51.35 | 49.80 | 50.05 |
| 3 (black) | 50.10 | 50.25 | 48.70 | 48.95 |
| 4 (white) | 48.80 | 52.90 | 48.40 | 52.75 |
Step 1: check the rules
- Three black candles with falling closes: 51.10, then 50.05, then 48.95. Pass.
- Candle 4 is white and opens at 48.80, below candle 3's close of 48.95. Pass.
- Candle 4 closes at 52.75, above candle 1's open of 52.40. Pass. It's a valid falling-version three line strike.
Step 2: grade the strength
The three black bodies measure 1.30, 1.15 and 1.15, a total of 3.60. The strike body is 52.75 − 48.80 = 3.95, which is about 1.10 times the three combined. The close of 52.75 is also above the highest high of the first three candles (52.60), and the first three made lower highs and lower lows in a clean staircase. The calculator below scores this 90 out of 100: valid, strong.
Step 3: set the boundaries
Pattern top = 52.90 (candle 4's high). Pattern bottom = 48.40 (candle 4's low). A daily close above 52.90 confirms the reversal reading; a close below 48.40 would confirm the textbook continuation.
Step 4: build the trade
Suppose the next day closes at 53.20, above 52.90. You go long at 53.20. For the stop, the strike candle's low (48.40) is the "safest" level but gives a 4.80 risk, which is too wide for most accounts. A common compromise is the strike candle's body midpoint: (48.80 + 52.75) ÷ 2 = 50.775. Risk per share is 53.20 − 50.775 = 2.425.
With a $100,000 account risking 1%, you can lose $1,000. Position size is $1,000 ÷ 2.425 = 412 shares (rounded down). A 2R target sits at 53.20 + (2 × 2.425) = 58.05. If you'd rather target structure, look for the swing high where the two-week decline began; if that's lower than 58.05, take the structural level and accept a smaller reward.
What would change our mind: a close back below 50.775 within a few sessions. At that point the strike has lost half its body and the "one bar of short covering" reading looks more likely than a genuine turn.
Which timeframes and markets suit the three line strike?
Bulkowski's numbers come from daily stock data, so the daily chart on liquid stocks and indices is where the published evidence actually applies. Anything else is an extrapolation you should test yourself.
| Market / timeframe | How the pattern behaves | Our take |
|---|---|---|
| Stocks, daily | Gaps make the open condition meaningful; volume is reliable | Best fit with the published data |
| Index futures, 1H to 4H | Nearly continuous trading, so the open rule is easy to meet | Usable with volume and session context |
| Forex, 4H to daily | No centralized volume, opens equal prior closes | Lean harder on location and breakout close |
| Crypto, 4H to daily | 24/7 trading, frequent liquidation wicks | Many strikes are just liquidation cascades; confirm |
| Any market, 1m to 5m | Patterns appear often but mean little | Mostly noise; we'd skip it |
The pattern is rare on daily charts, which is one reason people drop to lower timeframes to "find more." That trades a small sample of meaningful signals for a large sample of meaningless ones. A one-minute strike is often nothing more than a single large order clearing a thin book. For a swing trader holding for days, it pairs naturally with the tools in our best indicators for swing trading list. If you trade intraday, a three line strike on the 15-minute or hourly chart that lines up with a level visible on the daily chart is a far better candidate than a random five-minute version.
One practical point on 24-hour markets: because each candle opens where the last one closed, the "opens beyond candle 3's close" requirement adds no information. Some traders add a substitute rule there, such as requiring the strike candle to trade beyond candle 3's extreme before reversing, so the bar shows a real sweep of the prior high or low. That idea lines up with the liquidity sweep concept.
How do you scan for a three line strike on TradingView?
Here's the part most guides get wrong: TradingView's built-in candlestick pattern set does not include the three line strike. The help center's candlestick pattern folder lists 44 individual patterns, from Abandoned Baby to Upside Tasuki Gap, including Three Black Crows and Three White Soldiers, but no three line strike. TradingView's "All Candlestick Patterns" indicator bundles that built-in set, so it won't flag this pattern either.
You have three practical routes:
- Community scripts. In the Indicators dialog, open Community and search "three line strike." Several open-source scripts exist, for example "Tristan's Three Line Strike Pattern." Our roundup of chart pattern recognition indicators explains how to vet these. Open the source before you trust one: some only require the strike to engulf the three bodies and skip the "close beyond candle 1's open" rule.
- Write ten lines of Pine. This is the most reliable option because you know exactly what's being tested. The script below follows the same rules as our calculator.
- Alerts. Once the script is on a chart, create an alert on its condition so you're notified on bar close instead of scanning charts by hand.
//@version=6indicator("Three line strike finder", overlay = true)up3 = close[3] > open[3] and close[2] > open[2] and close[1] > open[1] and close[2] > close[3] and close[1] > close[2]dn3 = close[3] < open[3] and close[2] < open[2] and close[1] < open[1] and close[2] < close[3] and close[1] < close[2]risingTLS = up3 and close < open and open >= close[1] and close < open[3]fallingTLS = dn3 and close > open and open <= close[1] and close > open[3]plotshape(risingTLS, title = "Rising 3LS", style = shape.triangledown, location = location.abovebar, color = color.red)plotshape(fallingTLS, title = "Falling 3LS", style = shape.triangleup, location = location.belowbar, color = color.green)alertcondition(risingTLS or fallingTLS, "Three line strike", "Three line strike on {{ticker}}")
Paste it into the Pine Editor, click "Add to chart," then set an alert with the "Three line strike" condition and "Once per bar close." Run it across a watchlist on the daily chart for a few months and you'll see for yourself how rare the clean version is. If you're new to the editor and alerts, our TradingView platform guide walks through both.
Before you trade live, backtest the rules on the instruments you actually trade. Turn the indicator into a strategy, or replay old charts with bar replay, and log every signal with its breakout direction. Practicing on a paper trading account for a month costs nothing and will tell you more than any published win rate.
How is it different from engulfing, three soldiers and other lookalikes?
The three line strike borrows pieces from several better-known patterns, which is why it gets misidentified so often.
| Pattern | Candles | Key difference from the strike |
|---|---|---|
| Three White Soldiers / Three Black Crows | 3 | The strike's first three candles, without the fourth. On their own they are momentum signals. |
| Engulfing | 2 | Engulfs one body. The strike's fourth candle engulfs three bodies and must close past candle 1's open. |
| Rising / Falling Three Methods | 5 | Small counter-trend candles sit inside a big trend candle, then the trend resumes. Structure is reversed. |
| Morning / Evening Star | 3 | Uses a small middle candle and a gap. No three-candle run first. |
| Outside reversal bar | 1 vs prior | Defined by range, not bodies, and only versus the previous bar. |
If you see three trend candles followed by a big reversal bar that doesn't quite close past candle 1's open, you have a large engulfing pattern, not a strike. It still might be tradable, but you shouldn't lean on the strike's statistics for it. Our candlestick patterns guide lays out the full family, and the morning star and evening star guides cover the three-candle reversals that often appear in similar spots.
Common mistakes and when the three line strike fails
- Mixing up the versions. Quoting the 84% figure for the rising version, or the wrong direction for either, is the most common error online. Always check the structure.
- Trading the strike candle's close. The pattern closes near one extreme, which is exactly where price often pauses. Wait for the breakout close.
- Accepting near misses. A strike that closes past candle 1's close but not its open is an engulfing pattern. Treat it as one.
- Skipping the volume check. A strike candle on thin volume is often a spike, not a shift. Any of the tools in our best volume indicators roundup will show you whether real participation was behind the bar.
- Ignoring where it forms. A strike into a major level means something. A strike in the middle of a choppy range usually means nothing. Combine it with trendlines or horizontal support and resistance.
- Over-trusting the ranking. A first-place performance rank built on 85 samples is interesting, not conclusive. Bulkowski says as much himself.
- Dropping to tiny timeframes to find more. More signals on the one-minute chart doesn't mean more edge.
- No stop plan. The strike candle can be huge, which makes a stop at its far end very wide. Decide before entry whether you use the body midpoint, the far extreme, or a smaller size.
- News bars. A strike candle printed on an earnings release or a central bank decision reflects one event, not a trend shift. These fail more often in either direction.
The pattern fails most often when it appears inside an established trend with no level nearby, on light volume, and with no follow-through in the next two bars. If you see all three, step aside.
Three Line Strike and Quantum Algo
A three line strike is a location-dependent signal, so the best partner for it is anything that tells you where the important levels are. Our free Institutional Key Levels indicator plots the levels where a strike carries more weight, and the free Liquidity Sweeps script flags when a strike candle has just run stops beyond a prior high or low. For momentum confirmation after the breakout close, the Multi-Oscillator Divergence Scanner checks whether the turn has support from more than one oscillator.
If you trade with Zeno, Quantum Algo's premium TradingView suite, a practical split is to use the strike as a context alert and let Zeno handle timing and risk. When a falling-version strike forms near a key level and a Zeno buy signal follows, you have two independent reads agreeing; when they disagree, you stay flat. Zeno's built-in stop and targets also solve the "the strike candle is too big for my stop" problem. You can check how the signals have performed on the public track record, and the free QuantumAlgo Academy covers candlestick context and risk sizing in more depth.
◆ Interactive check
How well do you know the Three Line Strike?
Questions traders ask about the Three Line Strike
It depends on which naming system you follow. In the classic books, three rising candles plus a black strike is called bullish because theory expects the uptrend to continue, while many websites name it by the strike candle's color instead. Describe it by structure (rising or falling version) to avoid confusion.
Bulkowski's data shows the falling version reversing 84% of the time and the rising version 65% of the time, with top overall performance ranks. But those figures come from only 85 and 69 patterns, and he warns they may change with more samples. Treat it as a promising but thinly tested signal.
Candlestick theory classifies it as a continuation pattern. Tested data from ThePatternSite shows it acting as a reversal more often than not, which is why most experienced traders wait for a breakout close before deciding.
The published statistics come from daily stock charts, so the daily timeframe is where the evidence applies. On 1-hour to 4-hour charts it can work when it forms at a clear level, while on 1- to 5-minute charts it is mostly noise.
Not among its built-in candlestick patterns. You can use an open-source community script or paste the short Pine script in this guide, which also lets you set alerts on bar close.
Mark the highest high and lowest low of the four candles. A close beyond one of those boundaries tells you which way the pattern resolved. Location near support or resistance, strong volume on the strike candle and higher-timeframe trend context add confidence.
The safest stop is beyond the strike candle's far extreme, but that is often very wide. Many traders use the midpoint of the strike candle's body and size down accordingly, as in the worked example.
An engulfing pattern covers one prior body. A three line strike's fourth candle covers three prior bodies and must close beyond the first candle's open. See our engulfing candle guide for the two-candle version.
Very rare. Bulkowski ranks the two versions 94th and 95th for frequency out of 103 candlestick patterns, and found just 85 falling-version examples in over 4.7 million candle lines.
References & Related Guides
Read next
- Candlestick Patterns
- Engulfing Candle
- Morning Star Pattern
- Evening Star Pattern
- Bull Trap and Bear Trap
- Hammer Candlestick
- Premium and Discount Zones
- Force Index
- What Are the Best Indicators for Swing Trading?
- Liquidity Sweep Trading
- Free TradingView indicators
- Zeno — the premium engine
Primary sources
- ThePatternSite (Thomas Bulkowski) — Bullish Three-Line Strike
- ThePatternSite (Thomas Bulkowski) — Bearish Three-Line Strike
- TradingView Help Center — Learn more about candlestick patterns
- TradingView Help Center — Automatic candlestick pattern detection
- TradingView Blog — New Candlestick Patterns, Now All in One Place
- TradingView — Tristan's Three Line Strike Pattern (open-source script)