Chart Pattern Recognition Indicators: What They Find, What They Miss and How to Trade the Prints
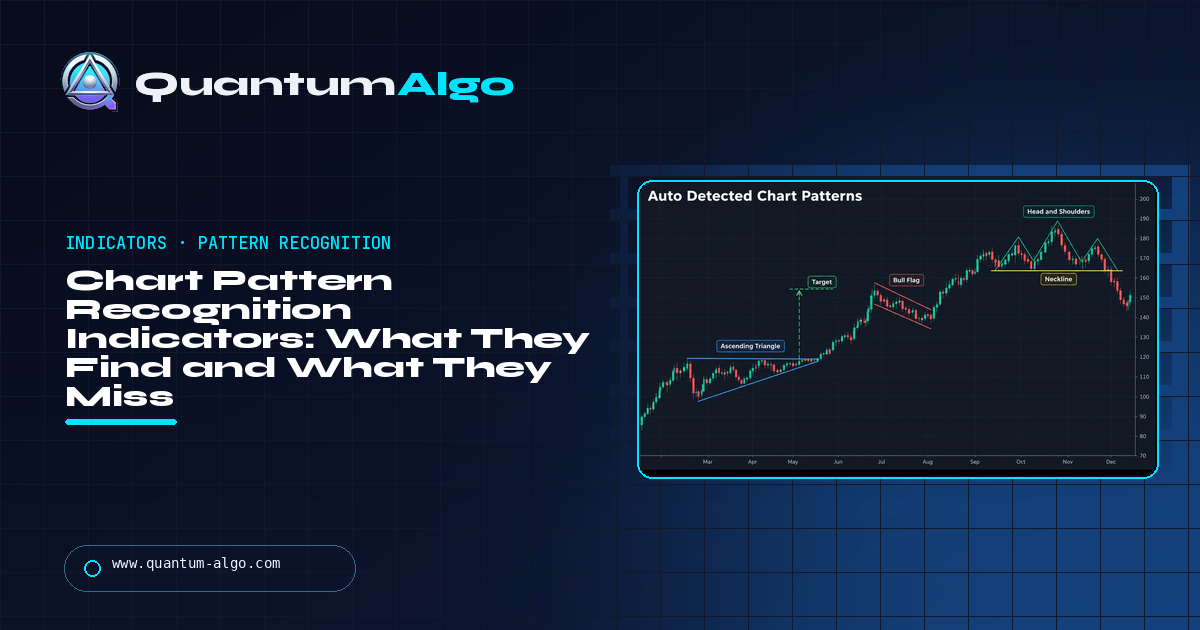
A chart pattern recognition indicator is a script that finds swing pivots, fits pattern geometry to them and draws classical patterns — triangles, flags, wedges, double tops and bottoms, head and shoulders, channels — with a label and a measured-move target. It saves the drawing; it does not make the decision. A detected pattern is a shape inside which price has not yet done anything, and the trade only exists when price closes beyond the pattern boundary on your timeframe, with volume above average on the break and the right trend context behind it. Set the pivot lookback to your trading timeframe, check the script does not repaint, alert on the breakout close rather than the pattern appearing, and treat every print as a watchlist entry.
Pattern indicators are the most-installed and least-understood scripts on TradingView. They look like a shortcut — the software finds the head and shoulders, you take the trade — and they are a shortcut to exactly one thing: the drawing. This page is what the indicator actually computes, what it draws for each pattern family and what it cannot see, the three checks that turn a detection into a setup, the settings that decide whether it repaints, how to choose one, an ES 15-minute session with one print taken and one ignored, and the mistakes that turn a useful tool into a losing habit. The grader tells you whether the pattern on your chart is confirmed or just drawn.
Indicators that prove themselves in public.
One engine, four precision tools — the Gold (XAU) Scalper, the institutional Gravity Zone, the Zeno momentum Oscillator, and Zeno Stocks for equities.



What a chart pattern recognition indicator is
A chart pattern recognition indicator is a script that finds classical patterns — triangles, flags, wedges, double tops and bottoms, head and shoulders, channels, cup and handle — and draws them on the chart with their lines, a label and usually a target. It works from swing points: it identifies the pivot highs and lows over a lookback, fits lines through them, tests whether the geometry matches a pattern definition (two converging lines with a flat top is an ascending triangle; two equal lows with a peak between them is a double bottom), and prints the result. TradingView ships a built-in set of auto pattern indicators, and the public library holds hundreds of community versions, several of them very good.
Two things follow from how it works. First, the indicator is only as good as its pivot logic: a lookback of 5 bars finds small patterns and many of them, a lookback of 20 finds fewer and larger ones, and neither is "right" — they are different timeframes of the same chart. Second, a pattern is a shape, and a shape is not a trade. The indicator can tell you that a double bottom exists; it cannot tell you whether price will close above the neckline, and the neckline close is the entire difference between a pattern that pays and one that does not. The chart patterns guide covers the patterns themselves; this page is about the software that finds them and how to use it without being used by it.
What it is not: a signal generator. Several vendors sell pattern scanners with a win rate on the box. The win rate belongs to confirmed, correctly-contextualised patterns traded with a stop, which is a different population from "every shape the algorithm drew".
What it finds, and what it draws
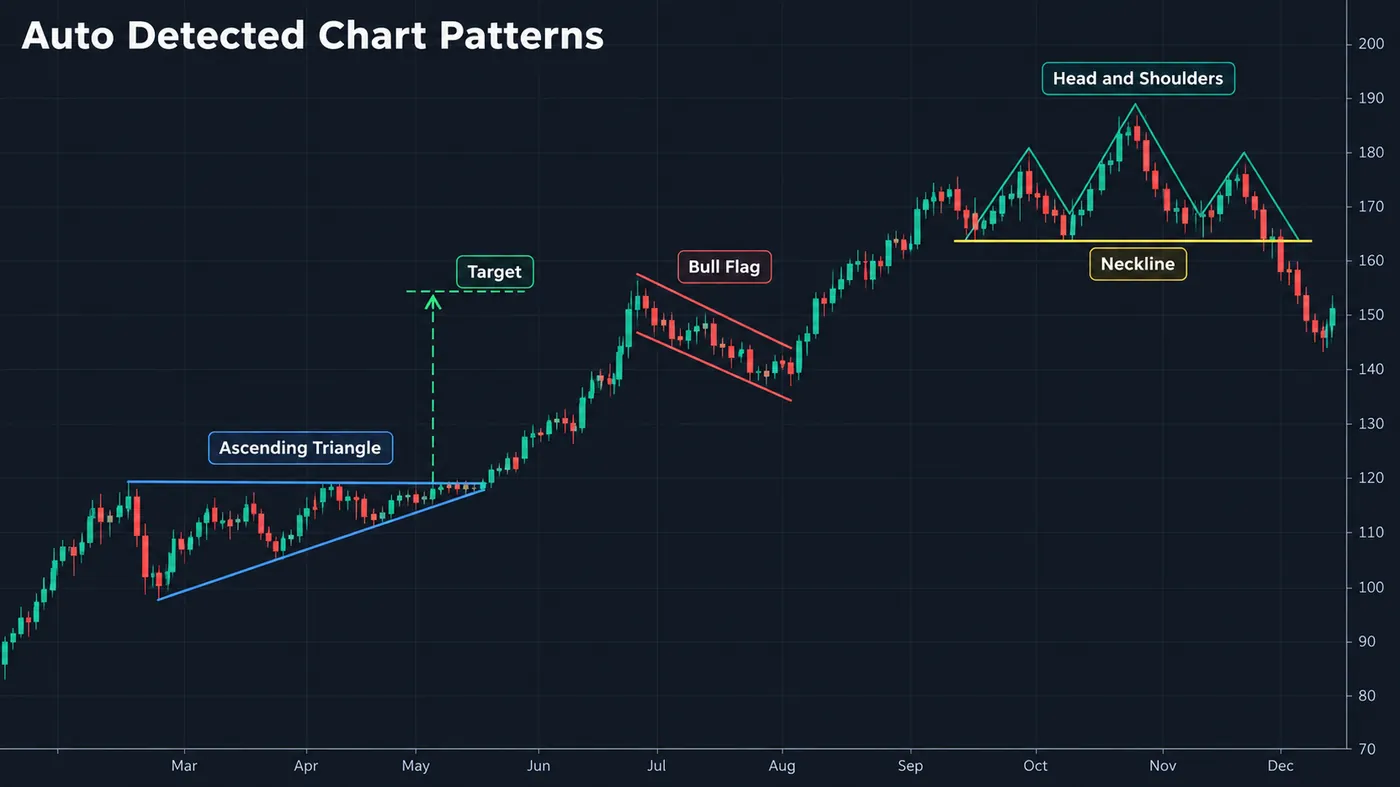
| Pattern family | Detection rule (simplified) | What the indicator draws | What it cannot see |
|---|---|---|---|
| Triangles (ascending, descending, symmetrical) | Two trendlines through ≥2 pivots each, converging; one flat for asc./desc. | The two lines, apex, breakout target = height at the widest point | Whether the break comes before the apex (early breaks are stronger) |
| Flags and pennants | Sharp move (the pole) followed by a small counter-trend channel or triangle | Pole, flag lines, target = pole length | Whether the pole was news and will not repeat |
| Double top / bottom | Two pivots at roughly equal price with a counter pivot between | The two tops, the neckline, target = height below the neckline | Whether the second touch swept liquidity above the first (a stronger version) |
| Head and shoulders | Three peaks, middle highest, shoulders roughly level, a neckline through the two troughs | Peaks, neckline, target = head-to-neckline distance | Volume declining across the peaks (the classical confirmation) |
| Wedges (rising, falling) | Two converging lines both sloping the same way | The lines, the break direction, target = wedge height | Whether the wedge is against the trend (reversal) or with it (continuation) |
| Channels | Two parallel lines through ≥2 pivots each | Upper and lower rails | Which rail is the "right" side — that is the trend, not the pattern |
| Cup and handle | A rounded low, recovery to the rim, a small pullback (the handle) | Rim, handle, target = cup depth | Whether the handle is a shallow flag or a failed recovery |
The right-hand column is the point. Every rule in the middle column is geometry, and geometry is what software is good at. Everything in the right-hand column is context — the prior trend, the volume, what price did at the second touch — and context is what the indicator either ignores or approximates badly. A pattern indicator is a pivot detector with a shape library. It saves you the drawing. It does not save you the judgement.
Detection versus confirmation
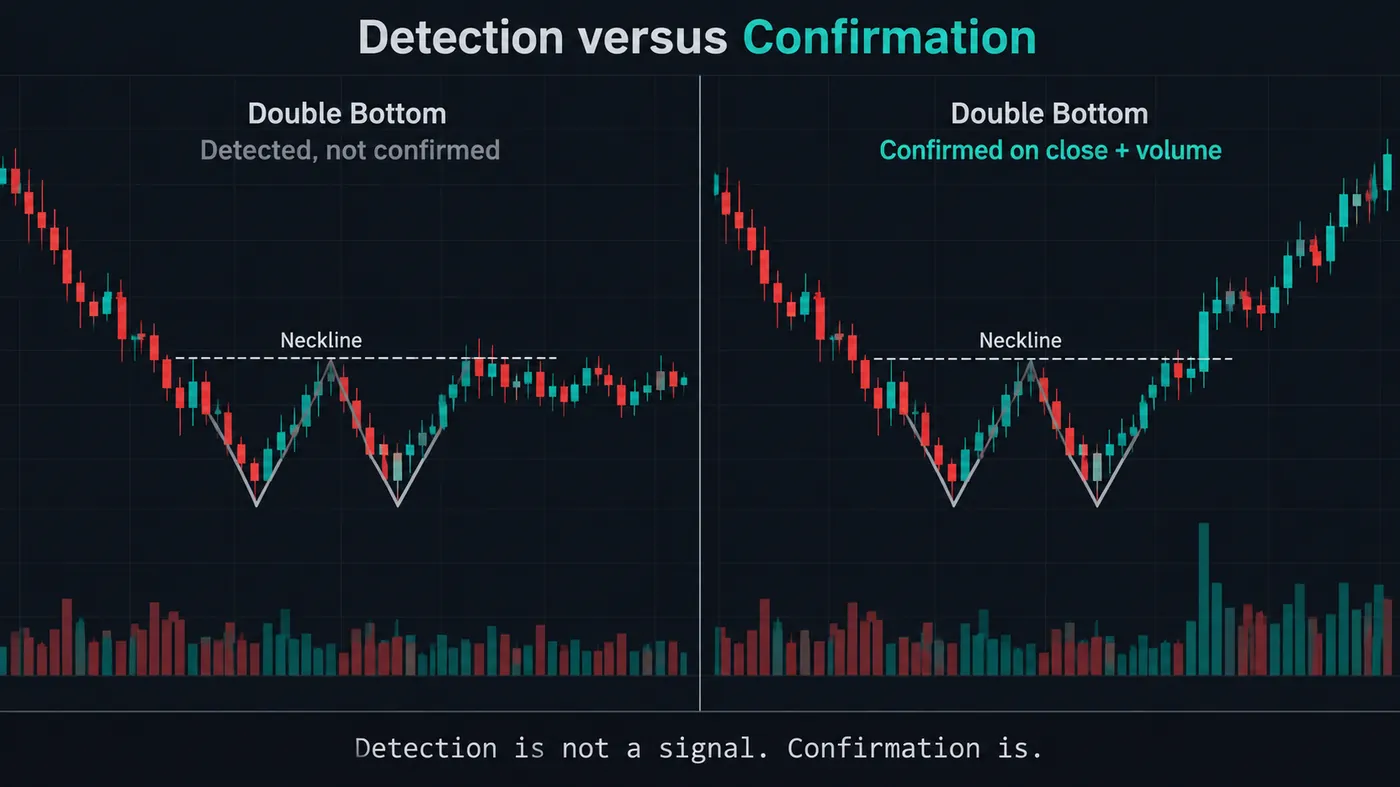
The indicator prints a pattern the moment its geometry is complete — the second bottom is in, the neckline can be drawn. At that moment nothing has happened yet. Price is still inside the pattern, and the honest statistics for "price is inside a double bottom" are close to a coin flip on direction. What turns the pattern into a setup is the market doing something the pattern predicted: closing through the boundary. For a double bottom that is a close above the neckline; for a triangle, a close outside the lines; for a flag, a close beyond the flag channel in the direction of the pole.
Three checks separate a confirmed pattern from a detected one, in order of weight. The close beyond the boundary — a wick through it is a liquidity grab, not a break, and a great many "failed patterns" were never confirmed in the first place. Volume on the break at a multiple of the recent average — a break at average volume is a break nobody joined, and those are the ones that come back. And context: a reversal pattern needs a trend to reverse, a continuation pattern needs a trend to continue; a double bottom at the end of a long range is a shape in a shape, and a bull flag in a downtrend is a bear rally with a label on it.
The measured target the indicator prints is the pattern height projected from the boundary. It is a reasonable first target and a poor last one; take most at the measured move and let any remainder run on structure. The stop goes back inside the pattern — a small fraction of the height beyond the boundary — because if price closes back inside, the break has failed and the pattern is no longer a reason to be in the trade.

Automate your trades. Let Quantum Algo trade for you.
Every signal executed on your own account — on your account, with the plan you define.
How to use a pattern indicator without being used by it
- Set the pivot lookback to your trading timeframe, not the chart timeframe. A day trader on the 5-minute chart wants swings of 10–20 bars; a swing trader on the daily wants 5–10. Too small and everything is a pattern; too large and nothing is.
- Treat every print as a watchlist entry, never an order. The detection tells you where to look. The confirmation tells you whether to act.
- Check context before anything else. What was the trend into the pattern? A reversal pattern with nothing to reverse, or a continuation pattern with nothing to continue, is noise. Discard it and move on.
- Wait for the close beyond the boundary. Not a wick, not a touch, a close on your trading timeframe. If the indicator fires a "breakout" alert intrabar, wait for the bar to close.
- Check the volume on the break. At least 1.5× the 20-bar average is a break with participation. Below that, prefer the retest entry — price returning to the boundary and holding — over the break itself.
- Enter on the close or the retest, stop inside the pattern, first target the measured move. A stop back inside means the pattern failed and the trade thesis is gone. The measured move is where most of the pattern's edge is paid.
Detection grader
Put in the pattern the indicator found, the trend before it, the boundary, the pattern height, the last close and the volume on the break. The tool grades it detected, partly confirmed or confirmed, explains which check failed, and returns the stop and target with the R multiple — and it tells you when the entry is already too late for the measured move.
Choosing and configuring one
| Indicator | Where | Patterns | Strength | Watch for |
|---|---|---|---|---|
| TradingView built-in auto patterns (Triangles, Wedges, Double Top/Bottom, Head & Shoulders, Flags, Channels) | Indicators → Technicals | One family per indicator | Clean drawing, consistent pivot logic, alerts on breakout | One pattern per script — you stack them; "breakout" alerts fire intrabar |
| Community all-in-one pattern scanners | Community scripts (search "chart patterns") | Many families in one script | One overlay, often with a back-tested stats table | Repainting — check whether the pattern is drawn on confirmed pivots only; stats tables on the same data the script was tuned on |
| Harmonic pattern finders | Community scripts | Gartley, bat, butterfly, crab, ABCD | Precise Fibonacci ratios the eye cannot check | Very sensitive to pivot settings; see the harmonic guide |
| Candlestick pattern recognition | TradingView built-in (Candlestick Patterns) and community | Engulfing, hammer, doji, tweezer, stars | Catches single-candle setups at levels | Fires on every candle that matches; only the ones at a level matter |
| Trendline finders | Community; the Trendline Architect in the free library | Channels, trendlines, breaks | Draws the lines a pattern is made of | Not a pattern classifier — it gives you the geometry and leaves the naming to you |
Three settings matter on any of them. The pivot lookback (often "length" or "swing strength") decides the size of pattern found. The confirmation mode — whether a pattern is drawn as soon as the geometry allows or only after a pivot is confirmed by the bars that follow it — decides whether it repaints; a pattern that appears and disappears as the bar develops is drawn on unconfirmed pivots and will look far better in history than it behaves live. And the alert condition: alert on the close beyond the boundary, never on the pattern appearing.
Reference data
| Item | Value |
|---|---|
| What it is | A script that detects swing pivots, fits pattern geometry, and draws classical chart patterns with labels and targets |
| Detects | Triangles, flags, pennants, wedges, double tops/bottoms, head and shoulders, channels, cup and handle; separate scripts for harmonics and candlesticks |
| Key setting | Pivot lookback / swing strength — sets the size of pattern found |
| Repainting | Check whether pivots are confirmed before a pattern is drawn; unconfirmed-pivot patterns look better in history than live |
| Confirmation | A close beyond the boundary on the trading timeframe, volume ≥ 1.5× average on the break, and correct trend context |
| Stop | A fraction of the pattern height back inside the pattern |
| Target | The measured move — pattern height projected from the boundary — for most of the position |
| Alert on | The breakout close, never the pattern appearing |
| Do not | Trade detections; trust a win-rate table computed on the same data the script was tuned on; stack five pattern scripts and trade whichever fires |
| TradingView | Built-in auto patterns under Technicals; hundreds of community scripts |
Worked example: ES 15-minute, one detection ignored and one taken
E-mini S&P, 15-minute chart, a Wednesday. The built-in Double Bottom indicator printed a pattern at 10:30 New York: two lows at 5,412 and 5,414 forty minutes apart, a neckline at 5,431, height 19 points. Context: the index had opened down and was 35 points off the overnight high — a reversal pattern at a place where a reversal made sense. The 10:45 candle wicked to 5,434 and closed at 5,428, inside the pattern. Not confirmed. The 11:00 candle closed at 5,436 on volume 1.9× the 20-bar average. Confirmed on close and volume. Long at 5,436, stop at 5,428 (three points inside the neckline, about 15% of the height), target 5,450 — the measured move — for 14 points against 8, 1.75R. It filled at 12:15.
Same chart, the following Monday, the same indicator printed a double bottom at 14:00: two lows at 5,388, neckline 5,401, height 13. Context: the index was in a 30-point range for the third day, and the two "bottoms" were the range low being touched twice — a shape inside a range, with nothing to reverse. Volume on the 14:15 close above the neckline was 0.8× average. Detected, not confirmed, wrong context. No trade. Price returned to 5,390 by the close. The indicator was correct both times that the geometry was a double bottom; the trader's job was the other two columns of the table.
Mistakes traders make with pattern indicators
- Trading the detection. The print is a shape; the trade is the close beyond the boundary.
- Ignoring the trend into the pattern. A reversal with nothing to reverse and a continuation with nothing to continue are the two commonest false patterns.
- Trusting a repainting script. If a pattern appears and vanishes as the bar develops, it is drawn on unconfirmed pivots and its history is fiction.
- Reading the stats table as an edge. A win rate computed on the same chart the script was tuned on is a description, not a forecast.
- Stacking scripts. Five pattern indicators on one chart produce a pattern every hour and a reason to trade every one.
- Alerting on the pattern instead of the break. The alert you want is the close through the boundary.
- Holding for the full measured move every time. Take most at the target; the rest runs on structure, not on the pattern.
Pattern recognition and the free indicators
The library does not include a classical-pattern classifier, and that is a choice: the free scripts draw the structure that patterns are made of and leave the naming to you. The Trendline Architect finds and draws the trendlines and channels automatically, which is most of what a triangle or wedge detector does without the label. The Smart Money Concepts Engine marks the structure breaks and order blocks that tell you whether a pattern break has institutional participation behind it. The Liquidity Sweeps script flags the wick through a neckline that a pattern indicator reads as a breakout and the market reads as a trap. The premium engine, Zeno, prints buy and sell signals with a stop and targets from its own structure logic; a Zeno signal at a confirmed pattern break is the pattern with the confirmation already done.
A pattern indicator is a pivot detector with a shape library. Use it to find candidates, set the lookback to your timeframe, make sure it draws on confirmed pivots only, and alert on the breakout close. Then do the three things it cannot: check the trend into the pattern, wait for the close through the boundary, and look at the volume on the break. Stop inside the pattern, most of the position off at the measured move.
◆ Interactive check
Do you know what the indicator is telling you?
Questions traders ask about chart pattern recognition indicators
A script that detects swing highs and lows, fits pattern geometry to them — converging lines, equal lows, three peaks with a neckline — and draws classical chart patterns on the chart with a label and usually a measured-move target. TradingView has built-in versions for each pattern family and hundreds of community scripts.
They are accurate at geometry: if the script says two lines converge with a flat top, they do. They are not forecasts. The pattern's outcome depends on things the script does not see — the trend into it, the volume on the break, whether the break is a close or a wick — and a detected pattern that is never confirmed is close to a coin flip.
For reliability, the built-in auto pattern indicators under Technicals (Triangles, Wedges, Double Top and Bottom, Head and Shoulders, Flags, Channels) — one per family, consistent pivot logic, no repainting. All-in-one community scripts are more convenient and need checking for repainting and for stats tables computed on the same data they were tuned on.
Some do. If the script draws a pattern as soon as the geometry allows, before the pivot is confirmed by the bars after it, the pattern can appear and vanish as the bar develops, and the historical chart will show patterns that were never visible live. Look for a confirmation setting or a note that pivots are confirmed before drawing.
Detection is the indicator recognising the shape — the second bottom is in, the neckline can be drawn. Confirmation is the market acting on it: a close beyond the pattern boundary on your timeframe, ideally with volume at 1.5× the average or more. Trades come from confirmations; detections go on the watchlist.
To the size of swing you trade, not the chart timeframe. Ten to twenty bars for intraday charts, five to ten for daily swing trading. A short lookback finds many small patterns, a long one finds few large ones; both are valid, at different scales.
Back inside the pattern, a small fraction of the pattern height beyond the boundary. If price closes back inside, the break has failed and the pattern is no longer a reason to hold.
As a first target, yes — the pattern height projected from the boundary is where most of a pattern's statistical edge is paid, and taking the bulk of the position there is sensible. As a final target it is arbitrary; let any remainder run on structure.
Separate scripts do — TradingView's built-in Candlestick Patterns indicator and community versions flag engulfing candles, hammers, dojis, tweezers and stars. They fire on every matching candle; only the ones at a support, resistance or structure level matter.
Not a classical-pattern classifier. The free library draws the structure patterns are built from — the Trendline Architect finds trendlines and channels, the Smart Money Concepts Engine marks structure breaks and order blocks, the Liquidity Sweeps script flags wicks through a level. Zeno, the premium engine, prints signals with a stop and targets from its own structure logic.
References & Related Guides
Read next
- Chart Patterns: Complete Guide
- Head and Shoulders Pattern
- Double Bottom Pattern
- Triangle Pattern
- Flag Pattern
- Breakout Trading Strategy
- Harmonic Patterns
- Candlestick Patterns: Complete Guide
- Trendline Architect (free indicator)
- Liquidity Sweeps (free indicator)
- Swing Failure Pattern — glossary
- Zeno — the premium engine
Primary sources
- Bulkowski, Encyclopedia of Chart Patterns (Wiley) — pattern definitions and confirmation statistics
- Lo, Mamaysky & Wang, Foundations of Technical Analysis (Journal of Finance) — algorithmic pattern recognition
- TradingView: chart pattern scripts (community library)
- Edwards & Magee, Technical Analysis of Stock Trends — the classical pattern canon