Force Index: Elder's Volume Indicator, Formula and Settings
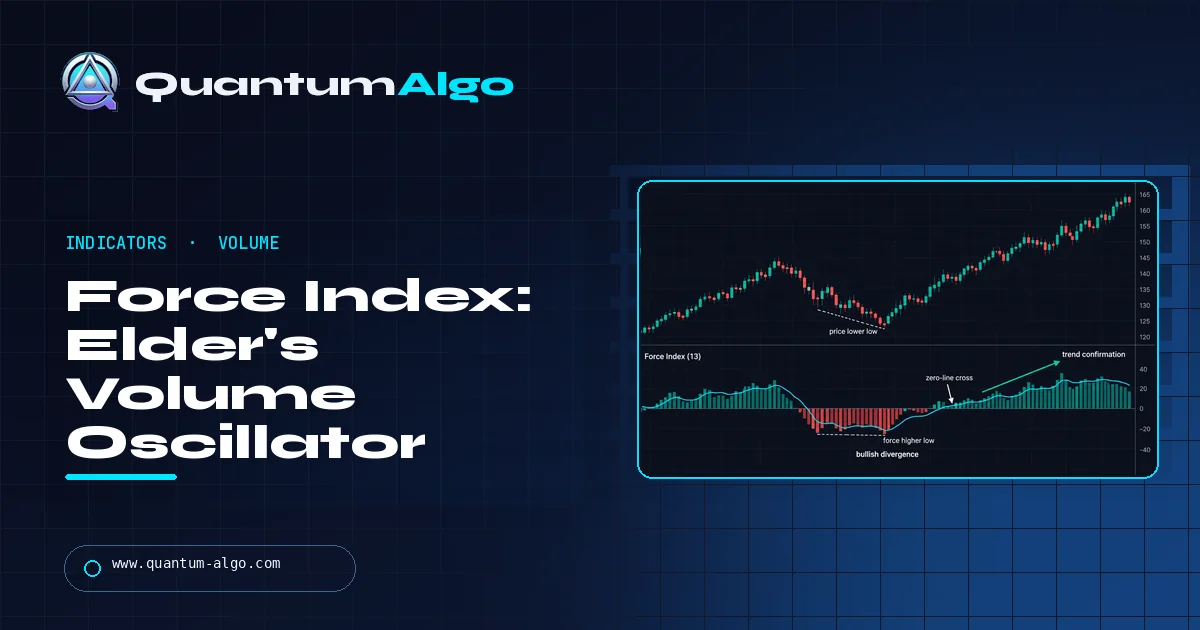
The Force Index is Alexander Elder's volume oscillator: today's close minus yesterday's close, multiplied by today's volume, then smoothed with an EMA. The 13-day version shows who controls the trend; the 2-day version times entries, with dips below zero in an uptrend treated as buying opportunities. It was introduced in Trading for a Living in 1993.
The Force Index is one line of math: price change times volume. Most guides stop there and show a chart. This Quantum Algo guide works eleven bars by hand so you can see exactly why a light-volume pullback barely registers and a heavy one swings the reading by millions, then explains the part traders get backward: the 2-day version is built to buy dips in uptrends, not to sell them. You will also find Elder's Triple Screen rules, settings by market, the TradingView setup, and where the volume data itself breaks the indicator.
Indicators that prove themselves in public.
One engine, four precision tools — the Gold (XAU) Scalper, the institutional Gravity Zone, the Zeno momentum Oscillator, and Zeno Stocks for equities.
Direction, distance and volume in one number
Most oscillators look at price alone. Most volume tools look at volume with only a sign attached. The Force Index multiplies the two together, so a bar scores high only when price moved a long way and a lot of contracts or shares changed hands. A 2-point rally on thin volume and a 0.5-point rally on huge volume can produce similar readings; a 2-point rally on huge volume dwarfs both.
Alexander Elder, a psychiatrist turned trader, introduced it in Trading for a Living: Psychology, Trading Tactics, Money Management, published by Wiley in April 1993. StockCharts summarizes his idea as three essential elements of a price move: direction, extent and volume. The Force Index is the simplest possible way to combine all three.
It is unbounded and centered on zero. Above zero, buyers won the comparison of today's close against yesterday's; below zero, sellers did. The size of the reading tells you how much effort went into that win. Elder then smooths it with an exponential moving average, and the two standard smoothings do very different jobs, which is where most traders get confused.
The Force Index formula, step by step
Raw Force Index(1) = (Close today − Close yesterday) × Volume todayForce Index(n) = EMA of Raw Force Index over n bars, α = 2 ÷ (n + 1)- Subtract yesterday's close from today's close. Keep the sign.
- Multiply by today's volume.
- Smooth the series with an EMA. Elder's two classic lengths are 2 and 13 bars. The first EMA value is commonly seeded with a simple average of the first n raw values.
Two properties fall straight out of the formula and matter in practice:
- Units are price × volume. A Force Index of 2,000,000 on a $50 stock and on a $500 stock mean very different things. You cannot compare raw values across symbols, or even across long periods of one symbol whose price or volume regime has changed.
- Close-to-close only. Intrabar range is ignored. A bar that spikes 3% and closes flat scores zero. If you care about intrabar pressure, tools such as cumulative volume delta measure something the Force Index cannot.
A worked example: eleven daily bars
Here is a stock in a steady uptrend. The table shows closes, volume, the raw Force Index and its 2-day EMA (α = 2 ÷ 3 = 0.667), seeded on bar 3 with the average of the first two raw values.
| Bar | Close | Volume | Change | Raw FI | FI(2) |
|---|---|---|---|---|---|
| 1 | 50.00 | 1,100,000 | — | — | — |
| 2 | 50.40 | 1,250,000 | +0.40 | +500,000 | — |
| 3 | 50.10 | 980,000 | −0.30 | −294,000 | +103,000 |
| 4 | 50.90 | 1,600,000 | +0.80 | +1,280,000 | +887,667 |
| 5 | 51.60 | 2,100,000 | +0.70 | +1,470,000 | +1,275,889 |
| 6 | 51.30 | 900,000 | −0.30 | −270,000 | +245,296 |
| 7 | 51.45 | 850,000 | +0.15 | +127,500 | +166,765 |
| 8 | 52.30 | 2,400,000 | +0.85 | +2,040,000 | +1,415,588 |
| 9 | 52.10 | 1,300,000 | −0.20 | −260,000 | +298,529 |
| 10 | 51.20 | 2,900,000 | −0.90 | −2,610,000 | −1,640,490 |
| 11 | 51.70 | 1,500,000 | +0.50 | +750,000 | −46,830 |
Checking one line
Bar 4: raw FI = 0.80 × 1,600,000 = 1,280,000. FI(2) = 0.667 × 1,280,000 + 0.333 × 103,000 = 853,333 + 34,333 = 887,667.
What the numbers say
- Bar 6 is a pullback on the lightest volume so far. Raw FI is negative but small, and FI(2) never goes below zero. Sellers showed up, but without conviction.
- Bar 8 is the strongest bull bar of the run: the largest gain on heavy volume. FI(2) jumps to its high.
- Bar 10 is the interesting one. A 0.90 drop on the heaviest volume of the sample drives FI(2) to −1.64 million. In an uptrend, Elder treats a dip of the 2-day Force Index below zero as a buying opportunity. But a selloff this heavy also deserves respect: it is the first time sellers outmuscled the best buying bar.
- Bar 11 bounces, and FI(2) is already back near zero. Elder's entry would be a buy-stop above bar 10's high, so you only get in if buyers prove it.
A 13-day version needs at least 14 bars before its first value, so it would not appear in this sample at all. That is worth remembering on new listings and freshly rolled contracts: the trend version simply has no history yet, and the 2-day version is all you have. Paste these closes and volumes into the calculator below to reproduce every figure, then swap in your own data or a longer series for the 13-day reading.
2-day vs 13-day Force Index: two different jobs
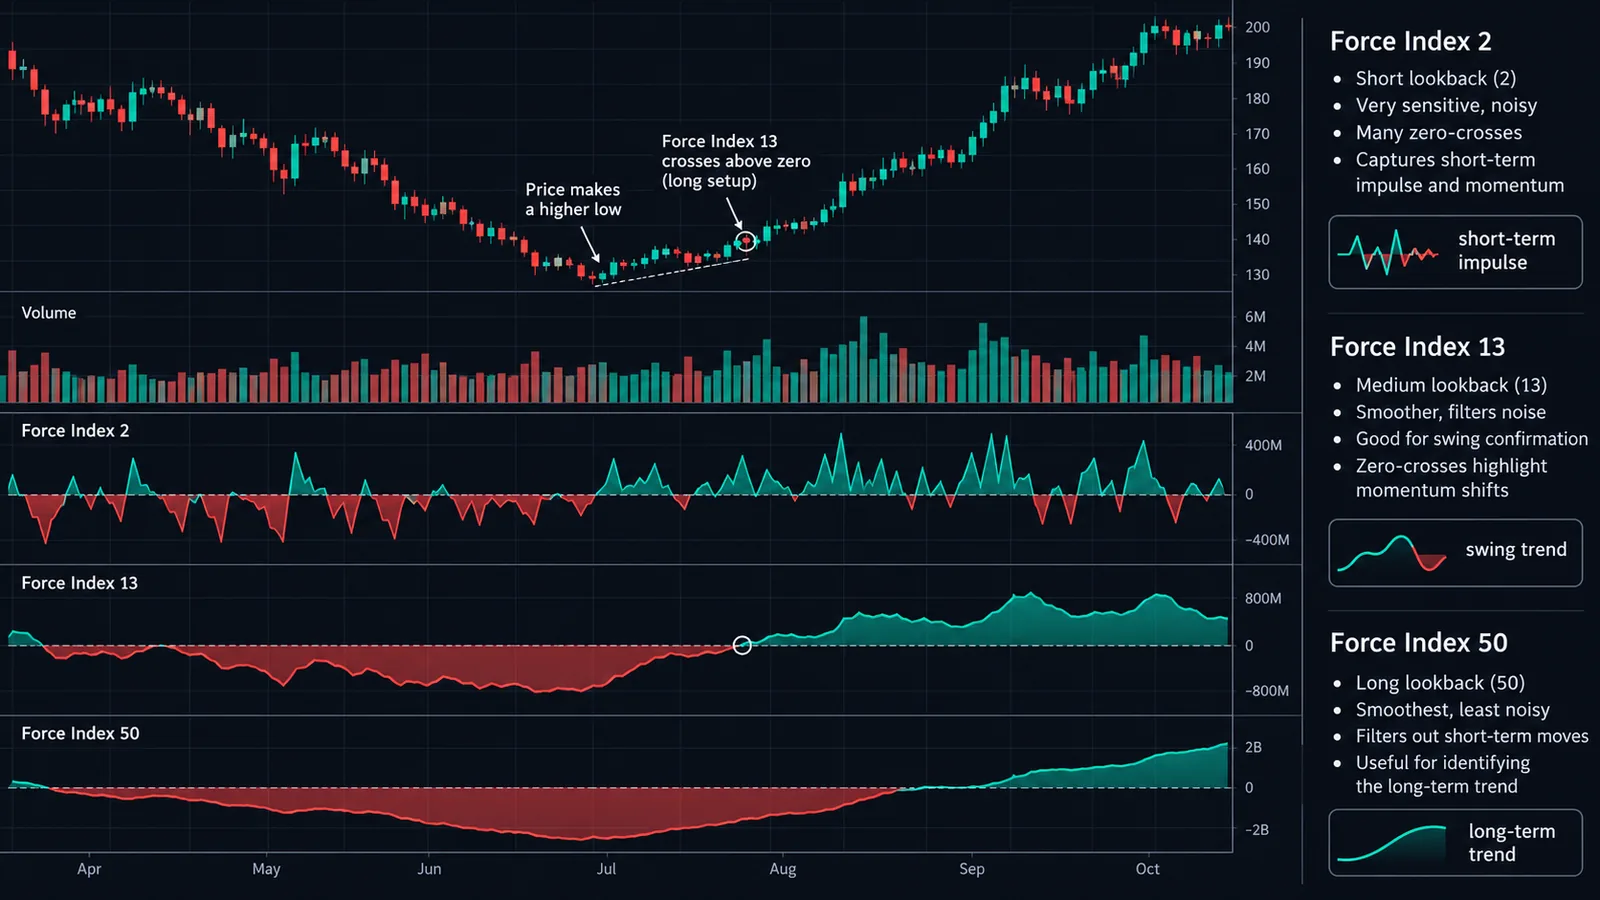
The same formula, smoothed two ways, answers two different questions.
| Version | What it shows | How Elder uses it | Typical mistake |
|---|---|---|---|
| Raw FI(1) | Each bar's force, very jagged | Rarely used alone | Treating every zero cross as a signal |
| FI(2) | Short-term bursts of buying and selling | Entry timing: buy dips below zero in uptrends, sell rallies above zero in downtrends | Using it to call the trend |
| FI(13) | The intermediate balance of power | Trend confirmation and divergences | Using it for precise entries |
| FI(100) | Long-term force | StockCharts suggests it for longer trends | Expecting timely signals |
StockCharts also describes a pairing Elder uses for corrections: a 22-day EMA of price to define the trend, with the 2-day Force Index to find pullbacks within it. The logic is the same as any trend-plus-oscillator system: the slow tool picks the side, the fast tool picks the moment. TradingView's built-in defaults to 13, which is the trend-reading version, not the entry version. If you want Elder's entry timing, change it to 2.
How Elder uses the Force Index in the Triple Screen
Elder developed the Triple Screen trading system in the mid-1980s, and Trading for a Living lays it out in a section titled "Triple Screen Trading System." The idea is to look at the market on three levels so that a trend-following tool and an oscillator stop contradicting each other.
- First screen, the tide. Pick a timeframe one order larger than the one you trade (weekly if you trade daily). Use a trend tool such as the slope of the MACD histogram or a weekly EMA to decide direction. Uptrend: longs only. Downtrend: shorts only.
- Second screen, the wave. On your trading timeframe, wait for a move against the tide, measured with an oscillator. Elder lists the Force Index, Elder-ray, the Stochastic and Williams %R. With the Force Index, the setup is FI(2) dropping below zero while the weekly trend is up.
- Third screen, the entry. Place a buy-stop one tick above the previous bar's high and trail it down each day until it fills or the weekly trend turns. For shorts, a sell-stop one tick below the prior low.
The Force Index fits the second screen well because it captures pullbacks that are actually being sold, not just drifting. A dip on light volume barely moves FI(2), while a real shakeout pushes it decisively negative, which is the kind of pullback Elder wanted to buy when the tide is up.
Reading zero-line crosses, spikes and divergences
Zero line
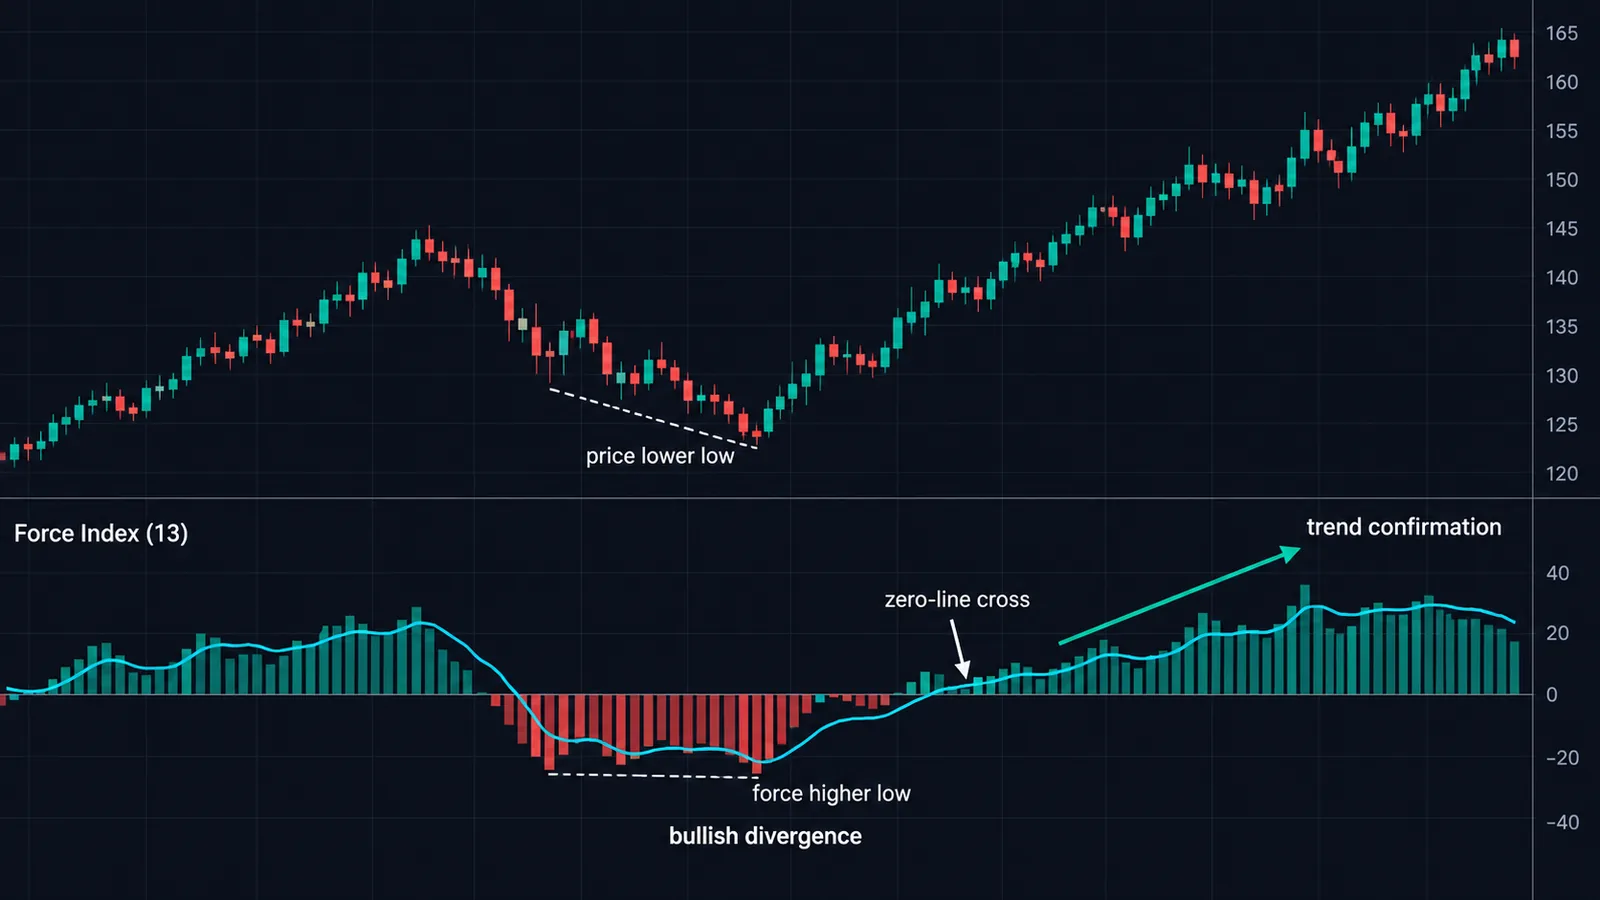
FI(13) above zero means bulls have controlled the intermediate period; below zero, bears. A cross of the 13-day version is a useful regime marker. Crosses of the 2-day version happen constantly and mean little by themselves.
Spikes
Because volume enters linearly, single bars can dominate. A news gap on triple volume can print a raw value five or ten times the recent average. A positive spike at the start of a breakout usually confirms it. The same spike after a long, extended run is often a climax: everyone who wanted in got in. Context decides which, so compare the spike against where price sits in its range, the way volume spread analysis reads high-volume bars.
Divergences
- Bearish: price makes a higher high while FI(13) makes a lower high. The new high came with less force.
- Bullish: price makes a lower low while FI(13) makes a higher low. Sellers are pushing with less weight.
StockCharts recommends confirmation before acting, either a zero-line cross of the Force Index or a break in price. That is sensible: divergences on volume-based oscillators can stack two or three times before a turn. Incredible Charts adds a useful nuance: when the 13-day line flattens, either volume is drying up or price moves are failing, and both can come before a reversal.
Force Index settings by timeframe and market
Elder's 2 and 13 were built for daily stock and futures charts. Here is how I would adapt them as starting points. Test before trusting any of them.
| Style | Chart | Entry FI | Trend FI | Trend filter |
|---|---|---|---|---|
| Swing stocks | Daily | 2 | 13 | Weekly MACD or 22-day EMA |
| Position trades | Weekly | 2 to 4 | 13 | Monthly trend or 40-week average |
| Index futures intraday | 5 to 15 minute | 2 to 3 | 13 to 21 | Hourly trend |
| Crypto (single venue) | 1 hour to daily | 3 | 13 to 21 | Daily trend |
| Spot forex | Any | Use with caution | Use with caution | Tick volume only |
The longer entry length on crypto is deliberate. Single-venue crypto volume is spikier than exchange-traded stock volume, so a 2-bar EMA reacts to every burst. A 3-bar length takes some of that edge off without becoming a trend tool. Intraday, the volume profile of the session matters too: the first and last 30 minutes of the US cash session usually carry far more volume than midday, so the same price change scores much higher at the open. Compare readings with readings from the same time of day, or use the normalized version below. A dedicated Volume Flow Indicator handles some of these quirks with a volume cutoff.
On intraday futures, avoid letting the overnight gap sit inside the first bar's change. The first regular-session bar can carry the entire overnight move multiplied by heavy opening volume, which swamps the rest of the day. Running the indicator on regular trading hours only, or ignoring the first bar, gives cleaner readings.
Normalizing the Force Index so readings compare
Elder's formula is perfect for one chart at one time. It breaks down the moment you compare two symbols or two eras. Here is the problem in numbers.
| Stock | Price | Move | Volume vs average | Raw FI |
|---|---|---|---|---|
| A | $20 | +$0.40 (+2%) | 7.5M vs 5M (1.5×) | +3,000,000 |
| B | $400 | +$8.00 (+2%) | 600K vs 400K (1.5×) | +4,800,000 |
Both bars are the same event: a 2% gain on 1.5 times normal volume. Yet stock B's raw reading is 60% larger, purely because of its price and share count. Dividing by average volume does not fully fix it either: A becomes 0.6 and B becomes 12, because the result is still in dollars per share.
A cleaner variant uses percentage change and relative volume:
Normalized FI = (Close ÷ prior Close − 1) × 100 × (Volume ÷ 20-bar average Volume)Both stocks now score 2 × 1.5 = 3.0. This is our adaptation, not Elder's original, and it changes the absolute values, but zero crosses and the shape of divergences stay intact. Use it for scans, watchlists and long backtests where the price level drifts. Keep the classic version for reading a single chart the way Elder taught it. The calculator's volume-normalized output is the intermediate step; for cross-symbol work, apply the percentage version in a spreadsheet or script.
Does the Force Index work, and how to test a Force Index plan
Honest answer: there is little rigorous, independent evidence either way. Elder's books present the Force Index as part of a discretionary method, not as a standalone system with published statistics, and I could not find a peer-reviewed study that isolates it. Plenty of blog backtests exist, but most test a bare zero-line crossover, which is not how Elder uses it, and almost none account for costs.
What the formula guarantees is narrower: it ranks bars by how much volume-weighted price change they produced. Whether that ranking helps depends on your market having meaningful volume and on the rest of your plan. If you want to know whether it helps you, test it the way it is meant to be used:
- Define the trend filter first (for example, weekly 13-week EMA rising).
- Compare two versions of the same pullback entry: one that requires FI(2) below zero, and one that buys any three-bar pullback.
- Use the same stop, exit and position size in both, include commissions and slippage, and hold out the last 30% of the data.
- Judge on expectancy per trade and drawdown, not win rate.
Run the test on at least two markets with real exchange volume, such as a large-cap stock and an index future, and on more than one market regime. A filter that helps only in one strong bull run, or only on one ticker, is a coincidence, not an edge. Also test across at least a few hundred signals; twenty trades cannot separate a real filter from noise. Keep a log of every signal you would have skipped because FI(2) stayed above zero; the skipped trades are where you learn what the filter actually does.
If the Force Index filter does not improve the plain pullback rule out of sample, drop it. That is a better outcome than trusting a reading you never checked. Our guide to mean reversion trading covers how to structure pullback tests so the comparison is fair.
A simple plan worth testing
Here is one concrete, rules-based plan close to Elder's own structure, the kind of rule set the test above is designed for. It is a framework to test, not a proven system.
- Trend: weekly 13-week EMA rising (or weekly MACD histogram rising). Longs only.
- Setup: daily FI(2) closes below zero.
- Trigger: buy-stop one tick above that day's high. If it does not fill, move the stop down to the next day's high while FI(2) stays negative.
- Stop: below the low of the setup bar or the recent swing low, whichever is closer to your risk limit.
- Exit: partial profit when FI(2) prints a strong positive spike, trail the rest, or exit if FI(13) crosses below zero.
For a second opinion on momentum before the trigger, a TRIX or Relative Vigor Index reading in the trend's direction is a reasonable filter, because both are price-only and therefore independent of the volume data.
How to add Elder's Force Index (EFI) on TradingView
- Open a chart and click Indicators (or press the forward slash key).
- Search "Elder's Force Index" and add the built-in Elder's Force Index (EFI). It opens in its own pane.
- Open settings. The only calculation input is Length, default 13. That is the trend-reading version.
- For Elder's entry timing, add a second copy and set Length to 2. Keep both: 13 for the tide on your timeframe, 2 for the wave.
- Add a horizontal line at 0 if the style tab does not show one, and set an alert on "EFI crossing 0" for the 2-length copy if you want notifications.
- Save both panes as an indicator template so they load together.
The built-in computes an EMA of change times volume, so it matches the formula above. Early values can differ slightly from a spreadsheet because the EMA's first value depends on how it is seeded; after a few multiples of the length, they converge. For a refresher on templates, alerts and panes, see our TradingView platform guide.
Force Index vs OBV vs MFI
All three combine price and volume, but they answer different questions.
| Indicator | Uses price how | Scale | Best at |
|---|---|---|---|
| Force Index | Size and sign of close-to-close change | Unbounded, centered on 0 | Measuring how hard a move was pushed |
| On-Balance Volume | Sign only (up day adds all volume) | Cumulative running total | Long-term accumulation and distribution trends |
| Money Flow Index | Typical price direction, RSI-style ratio | Bounded 0 to 100 | Overbought and oversold with volume |
| Chaikin Money Flow | Close position within the bar's range | Bounded −1 to +1 | Buying vs selling pressure inside bars |
OBV treats a 0.01 gain and a 5-point gain the same; the Force Index does not. MFI tells you whether volume-weighted buying is stretched; the Force Index tells you how strong today's push was relative to recent pushes. A sensible pairing is OBV for the big picture and FI(2) for timing. For a broader comparison, see our roundup of the best volume indicators, and if you want a smoothed price-volume oscillator built on a different idea, the Klinger Oscillator is the closest relative.
When the Force Index misleads you
- Bad volume data. Spot forex has no central volume; TradingView and brokers show tick volume, which counts price updates, not traded size. A Force Index on EUR/USD is really "change × activity," which is weaker information. On crypto, volume is real but split across exchanges, and one venue's feed may not represent the whole market.
- Scale drift. As a stock's price doubles or its volume regime changes after an index inclusion, raw readings change scale. Old divergence highs are not comparable with new ones. A normalized version (raw FI divided by a moving average of volume, which leaves price units) helps when comparing periods.
- Single-bar dominance. One earnings gap can control the 13-day reading for weeks. Note when a reading is driven by one bar.
- Futures roll and session gaps. Continuous futures charts can show artificial jumps at the roll, and the first bar of the session carries the overnight change. Both inflate the reading.
- Choppy ranges. In a sideways market, FI(2) flips sign every few bars. With no first-screen trend, there is nothing for the second screen to buy or sell.
- Close-only blind spot. Long upper wicks with a flat close score near zero even though sellers clearly hit the bar.
If you trade crypto, a breadth view such as our crypto market breadth indicator guide helps you tell whether one coin's volume burst is part of a broader move.
Force Index and Quantum Algo
The Force Index is a good second-screen tool: it tells you a pullback is being actively sold and that sellers are about to run out. It does not tell you where to put the stop. That is where Quantum Algo's Zeno suite fits. Zeno Oscillator is built for momentum confirmation, and Zeno's buy and sell signals arrive with a stop and targets already defined, so a negative FI(2) in an uptrend can be the condition and Zeno's signal the timing and risk plan.
Among the free QuantumAlgo scripts, the Institutional Pressure Oscillator gives another view of buying and selling pressure to compare against the Force Index, and the Multi-Oscillator Divergence Scanner flags divergences across several oscillators so you are not relying on one volume feed. Both are on the free indicators page, and the Academy covers volume analysis from the ground up.
◆ Interactive check
How well do you know the Force Index?
Questions traders ask about the Force Index
It is a volume-based oscillator created by Alexander Elder. It multiplies the change in closing price by volume and smooths the result with an EMA, showing who controlled the market and how much effort went into the move.
Raw Force Index = (Close today − Close yesterday) × Volume today. The common versions are a 2-period and a 13-period EMA of that raw value.
Elder uses 2 for entry timing and 13 for trend and divergences on daily charts. There is no single best setting; shorter lengths react faster and whipsaw more.
Use a higher-timeframe trend to pick direction, wait for the 2-day Force Index to move against it (below zero in an uptrend), then enter with a stop order beyond the prior bar's high or low. Use the 13-day version for divergences and trend confirmation.
The raw value is coincident, and smoothing adds lag. Divergences between price and FI(13) can lead turns, but they often repeat before a reversal, so confirmation is needed.
A bearish divergence is price making a higher high while the 13-day Force Index makes a lower high; a bullish divergence is a lower low in price with a higher low in the indicator.
Only weakly. Spot forex charts use tick volume rather than traded size, so the volume half of the formula is a proxy. Currency futures volume is a better input.
OBV adds or subtracts whole-day volume based only on the direction of the close and accumulates it. The Force Index weights volume by the size of the price change and is smoothed rather than cumulative. See our OBV guide.
Alexander Elder's Trading for a Living: Psychology, Trading Tactics, Money Management, published by Wiley in 1993.
Search for Elder's Force Index in the Indicators dialog. The built-in EFI has one input, Length, defaulting to 13.
References & Related Guides
Read next
- On-Balance Volume (OBV)
- Money Flow Index (MFI)
- What Are the Best Volume Indicators?
- What Is the Klinger Oscillator and How Do You Trade It?
- Chaikin Money Flow (CMF)
- Volume Flow Indicator (VFI)
- Cumulative Volume Delta
- MACD Indicator
- Stochastic Oscillator
- Williams %R
- Free TradingView indicators
- Zeno — the premium engine
Primary sources
- StockCharts ChartSchool — Force Index
- TradingView Help Center — Elder's Force Index (EFI)
- Wiley-VCH — Trading for a Living: Psychology, Trading Tactics, Money Management
- Incredible Charts — Force Index Indicator
- TC2000 Help — Elder Force Index
- Technical Analysis of Stocks & Commodities — Alexander Elder: The Force Index
- AskTraders — Elder's Triple Screen Strategy