Stage Analysis: Stan Weinstein's Four Stages, the 30-Week Moving Average and How to Trade Them
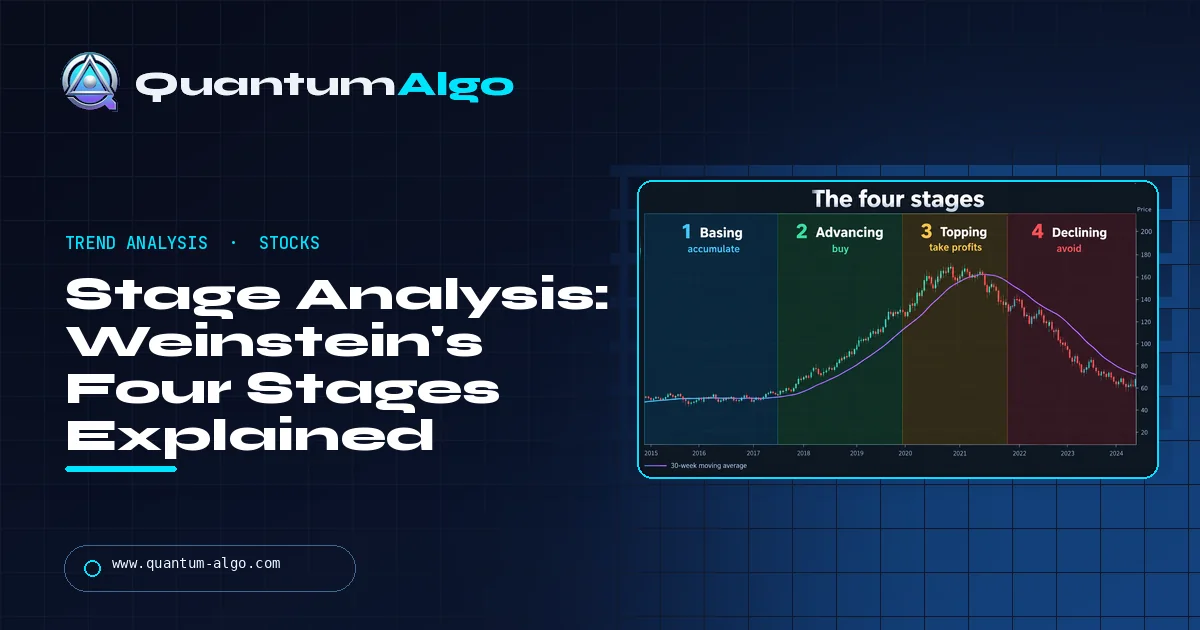
Stage analysis is Stan Weinstein's method for reading where a stock is in its cycle using weekly charts and a 30-week moving average. Stage 1 is a base (flat average), Stage 2 an advance (price above a rising average), Stage 3 a top (the average flattens) and Stage 4 a decline (price below a falling average). The rule is simple: buy in Stage 2, ideally on a high-volume breakout from a Stage 1 base, avoid or sell Stage 3, and stay out or short in Stage 4.
Most stock-picking mistakes are timing mistakes: buying a good company while its chart is in a long decline, or holding one after the trend has quietly rolled over. Stan Weinstein's stage analysis is a simple filter for exactly that. It fits on one weekly chart with one moving average, and it answers the first question any trade should ask: is this stock in a phase where buying makes sense? This guide covers the four stages, how to identify them, the Stage 2 breakout, relative strength, sell rules and a stage checker.
Indicators that prove themselves in public.
One engine, four precision tools — the Gold (XAU) Scalper, the institutional Gravity Zone, the Zeno momentum Oscillator, and Zeno Stocks for equities.
What is stage analysis?
Stage analysis is a method for classifying any stock, sector or index into one of four phases of a market cycle: basing, advancing, topping and declining. It was set out by Stan Weinstein, a technical analyst and newsletter writer, in his 1988 book Secrets for Profiting in Bull and Bear Markets, and it is still one of the most widely used frameworks among swing and position traders in equities.
The idea is that prices do not move randomly between trends. They rest, rise, stall and fall in a repeating sequence, and each phase has a recognisable look on a weekly chart. If you can tell which phase a stock is in, you know whether it is worth buying at all, before you think about the exact entry.
The method needs very little: weekly price bars, a 30-week simple moving average, volume, and a relative-strength line against a market index. That simplicity is why it has lasted. It is also why it combines well with more detailed entry methods, including the volatility contraction pattern, which is built to be traded inside Stage 2.
What are the four stages?
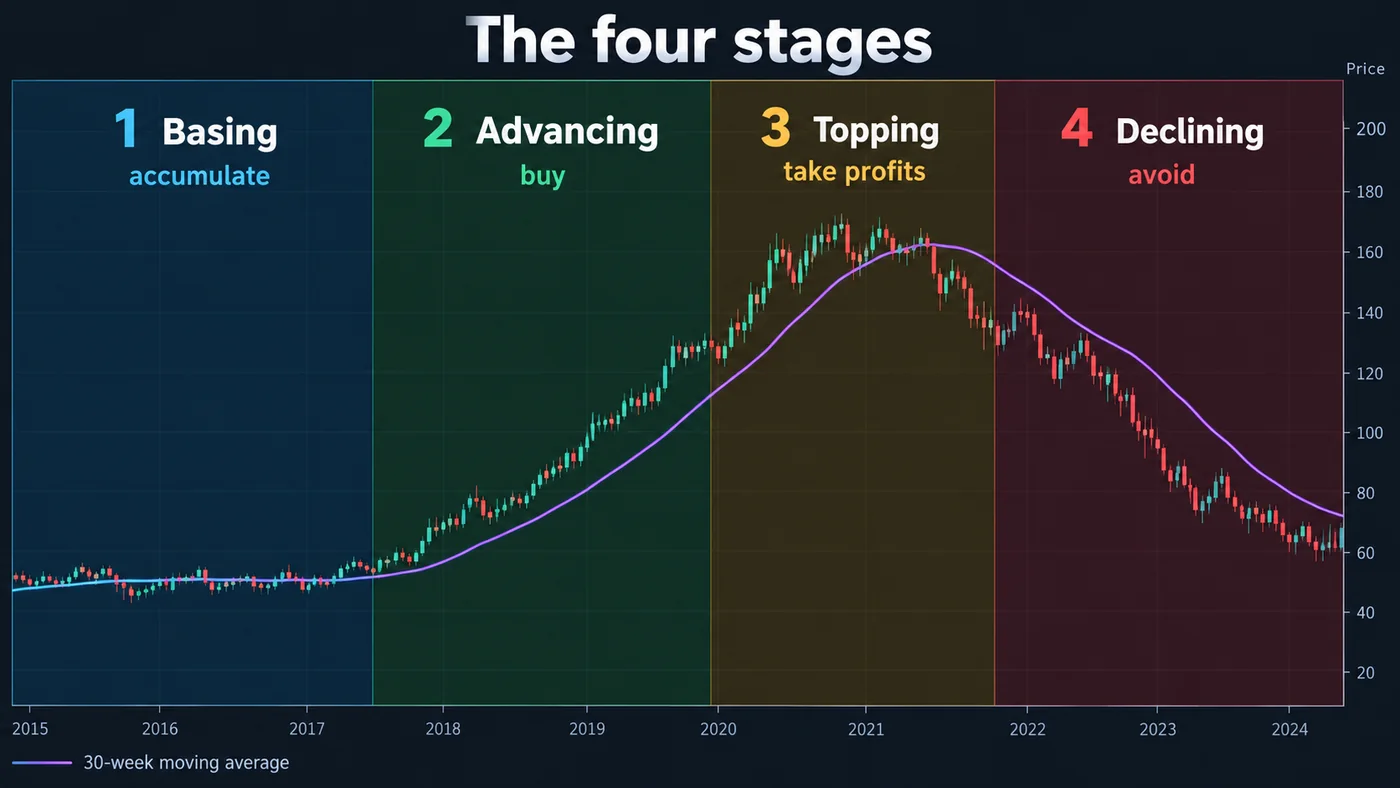
| Stage | Name | Price vs 30-week MA | MA slope | What to do |
|---|---|---|---|---|
| 1 | Basing | Crosses back and forth, sideways range | Flattens after a decline | Watch; prepare |
| 2 | Advancing | Above it, pullbacks hold near it | Rising | Buy and hold |
| 3 | Topping | Crosses back and forth, wide swings | Flattens after an advance | Take profits, tighten stops |
| 4 | Declining | Below it, rallies fail near it | Falling | Avoid, sell, or short |
Stage 1: the base
After a decline, selling pressure dries up. Price moves sideways in a range, the 30-week average flattens and price crosses it repeatedly. Volume is usually low. This can last months or years. Buyers are slowly absorbing supply, but nothing in the chart says the decline is definitely over.
Stage 2: the advance
Price breaks above the top of the base, the average turns up and price stays above it. Pullbacks find support near the average or near the old resistance. This is the only stage Weinstein wants you to buy, and the early part of it offers the best balance of risk and reward.
Stage 3: the top
The advance loses momentum. The average flattens again, price swings more wildly and starts crossing the average, and volume is often heavy without progress. Stage 3 looks like Stage 1 but comes after a rise instead of a fall, which is why the prior trend matters when you classify a flat average.
Stage 4: the decline
Price breaks below the support of the top, the average turns down and price stays beneath it. Rallies stall at or below the falling average. Weinstein's advice is blunt: never buy a Stage 4 stock, however cheap it looks.
Why the 30-week moving average?
Weinstein used a 30-week simple moving average on weekly bars. It is long enough to ride through ordinary corrections without flipping direction, and short enough to turn within a few months of a major top or bottom. On a daily chart the usual equivalent is a 150-day average.
The slope of the average matters as much as price's position. A rising average with price above it is Stage 2; a falling average with price below it is Stage 4; a flat average with price crossing it is Stage 1 or 3, depending on what came before. Many traders judge the slope by comparing the average today with its value four weeks ago: a change of less than about 1% is effectively flat.
Weekly charts are the default because they filter out daily noise, which is the whole point of a stage filter. You can then drop to a daily chart for the entry. For more on choosing averages, see the moving averages guide.
How do you spot a Stage 2 breakout?
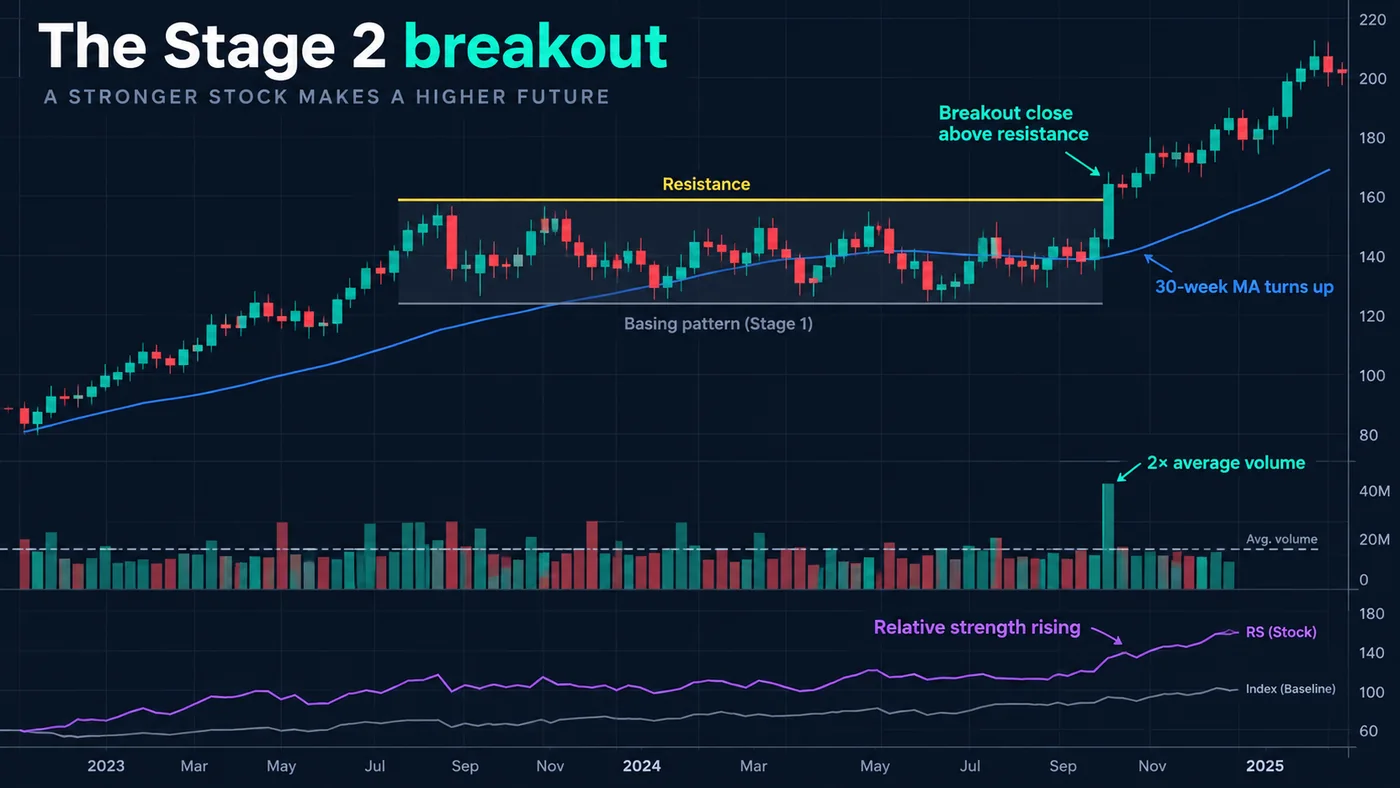
The highest-probability entry in stage analysis is the transition from Stage 1 to Stage 2. Weinstein's checklist for a breakout:
- A real base. Months of sideways movement with a clear resistance level at the top, not a short pause.
- A weekly close above resistance. Not an intraday poke; the week must close above the level.
- Volume expansion. Breakout-week volume at least twice the average of the previous few weeks. Weinstein treats a breakout on weak volume as suspect.
- The average is no longer falling. Ideally it has turned up; at minimum it is flat.
- Positive relative strength. The stock is outperforming the market, or about to.
- Little overhead resistance. The fewer old highs above the breakout, the less supply waiting to sell.
There are two classic entry points. The first is the breakout week itself, for traders willing to pay up for confirmation. The second is the pullback: many breakouts retest the old resistance within a few weeks, which then acts as support and offers a lower-risk entry with a tighter stop. Weinstein noted that the pullback does not always come, so some traders split the position between the two.
What is relative strength in stage analysis?
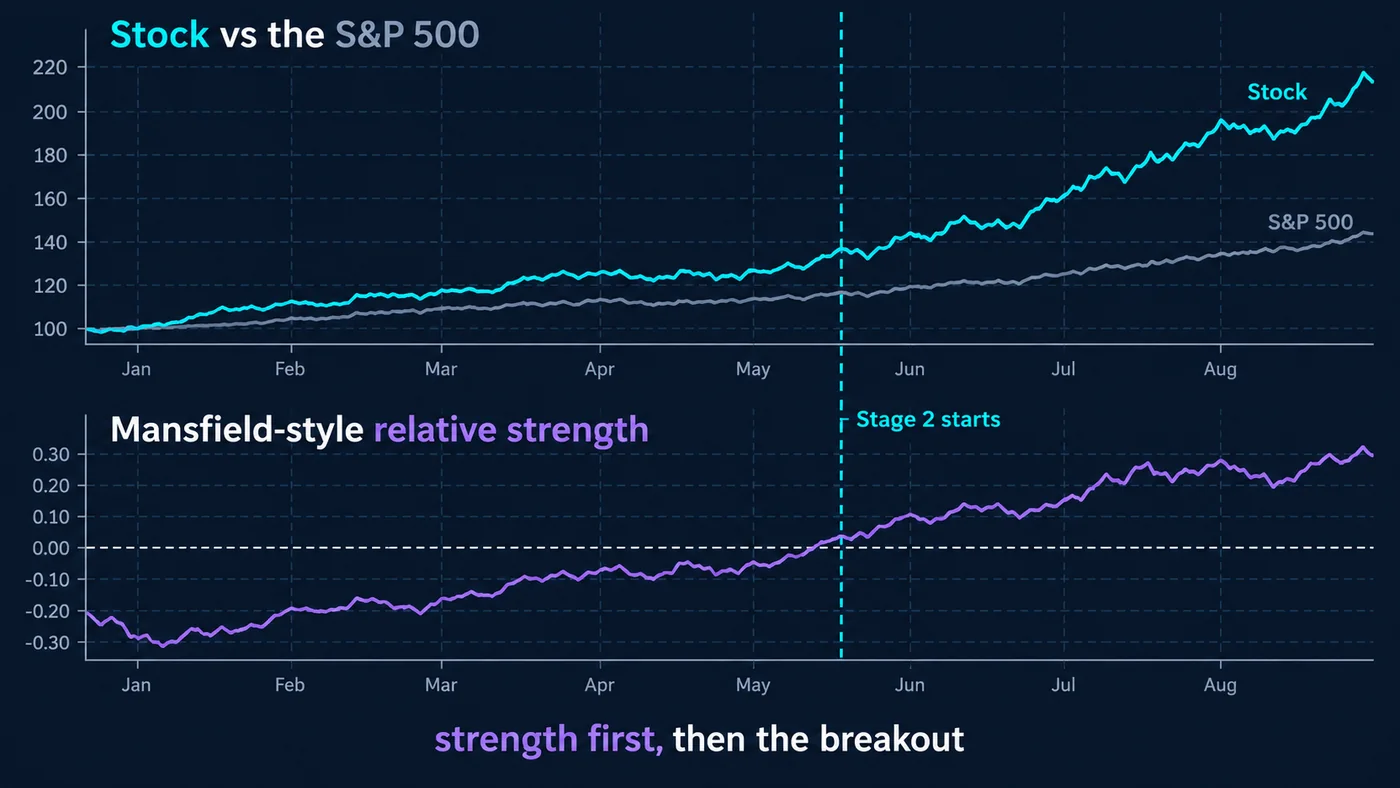
Relative strength (RS) in Weinstein's sense is not the RSI. It is the stock's price divided by an index (for US stocks, usually the S&P 500), plotted as a line. A rising line means the stock is beating the market; a falling one means it is lagging.
The common Mansfield version normalises that ratio so it oscillates around zero: (ratio ÷ its 52-week average − 1) × 100. Above zero, the stock is stronger than its own recent average relationship with the index; below zero, weaker. Weinstein wanted the RS line positive, or at least rising sharply into positive territory, at the time of a Stage 2 breakout. He also wanted it negative before shorting a Stage 4 breakdown.
The practical use is ranking. When several stocks are breaking out at once, the ones with the strongest RS usually lead. A stock breaking out with RS still deep below zero is a laggard catching up, and laggards tend to stall first.
Stage checker
Enter a weekly close, the 30-week average now and four weeks ago, the trend before the current phase, the relative-strength reading and, for a breakout, the volume ratio. The checker classifies the stage, tells you what Weinstein's rules say to do and warns when price is too extended from the average.
When do you sell in stage analysis?
Weinstein's selling rules are as important as the buying rules, and they are where most traders slip.
- Initial stop. Below the low of the base, or below the low of the pullback after the breakout. If the breakout fails back into the base, the thesis is wrong.
- Trailing stop in Stage 2. Raise the stop below each significant correction low, and below the 30-week average once the trend is mature. Weinstein advised against trailing it too tightly; Stage 2 pullbacks can be deep.
- Stage 3 warnings. The average flattens, price closes below it, swings widen and volume rises without progress. Take partial profits and tighten the stop.
- Stage 4 breakdown. A weekly close below the support of the top, with the average turning down, is the exit for anything still held. It is also where short sellers enter, ideally on volume, with RS negative.
The asymmetry is the point of the method: you own stocks during Stage 2 and are out of them during Stage 4. Missing the exact top or bottom does not matter much if you are on the right side of the two trending stages.
Stage analysis for the market and sectors
The same four stages apply to indices and sectors, and Weinstein used them top-down: check the market's stage first, then the strongest sectors, then the best stocks within them.
| Level | What to check | Why it matters |
|---|---|---|
| Market (e.g. S&P 500) | Stage of the index on a weekly chart | Most stocks follow the market; Stage 2 breakouts work best in a Stage 2 market |
| Sector or industry | Stage and RS of sector ETFs or groups | Strong groups produce most of the leaders |
| Stock | Base, breakout, volume, RS | The actual trade |
It also works outside US stocks. Index futures, ETFs and larger crypto assets go through visible bases, advances, tops and declines on weekly charts. The volume rules are less reliable on crypto and forex, so lean more on the average and relative strength there. For index context, see the S&P 500 indicator guide.
What mistakes do traders make with stage analysis?
- Buying "cheap" Stage 4 stocks. A falling average with price below it means sellers are in control, however far the price has fallen.
- Confusing Stage 1 and Stage 3. Both have a flat average. The trend that came before decides which one it is.
- Buying late Stage 2. A stock 40% above a rising average is still Stage 2, but the risk to the stop is large. Wait for a pullback or a new base.
- Ignoring volume on the breakout. A low-volume breakout often slips back into the base.
- Using daily noise to classify. Classify on the weekly chart; use the daily chart only for timing.
- Fighting the market's stage. Great breakouts fail more often when the index itself is in Stage 4.
Reference data
| Item | Detail |
|---|---|
| Creator | Stan Weinstein |
| Source | Secrets for Profiting in Bull and Bear Markets (1988) |
| Timeframe | Weekly bars for classification |
| Main average | 30-week simple moving average (≈150-day on daily charts) |
| Breakout volume | At least about 2× the recent weekly average |
| Relative strength | Stock ÷ index; Mansfield version oscillates around zero |
| Buy | Stage 2, ideally the breakout from Stage 1 or the first pullback |
| Avoid / short | Stage 4 |
How does stage analysis fit with Quantum Algo's indicators?
Stage analysis decides whether to be long; it says less about the exact entry. That is where structure tools help. The free Quantum Algo indicators on TradingView mark breaks of structure, liquidity and key levels, so you can time a Stage 2 entry at a defined level instead of chasing a weekly close. Zeno Stocks, part of the premium Zeno engine from Quantum Algo (QuantumAlgo), is built for equities and prints entries with a stop and two targets; using a weekly Stage 2 filter on top of it keeps you trading in the direction of the cycle. Every Zeno call is on the public track record.
Stage analysis sorts every chart into four phases using weekly bars and a 30-week moving average: Stage 1 base, Stage 2 advance, Stage 3 top and Stage 4 decline. Buy only in Stage 2, ideally on a high-volume breakout from a real base with positive relative strength, or on the first pullback. Take profits as Stage 3 appears and be out by Stage 4. Classify on the weekly chart, check the market's stage first, and let the stage decide direction before any entry method decides timing.
◆ Interactive check
Can you tell the stages apart?
Questions traders ask about stage analysis
A method by Stan Weinstein for classifying a stock or index into one of four cycle phases (basing, advancing, topping, declining) using weekly charts and a 30-week moving average.
Stage 1 basing (flat average after a decline), Stage 2 advancing (price above a rising average), Stage 3 topping (flat average after an advance) and Stage 4 declining (price below a falling average).
A 30-week simple moving average on weekly bars, roughly equivalent to a 150-day average on a daily chart.
In Stage 2, ideally on a weekly close above the top of a Stage 1 base with volume at least about twice the average, or on the first pullback to the old resistance.
The move out of a Stage 1 base into an uptrend: a weekly close above the base's resistance on heavy volume, with the 30-week average turning up and relative strength improving.
The stock-to-index price ratio normalised by its own 52-week average so it oscillates around zero: (ratio ÷ its 52-week average − 1) × 100. Above zero means outperformance.
Both have a flat average and price crossing it. Stage 1 follows a decline; Stage 3 follows an advance.
The four stages are visible on weekly charts of indices, ETFs and large crypto assets. Volume rules are less reliable outside stocks, so rely more on the average's slope and relative strength.
No. Stage analysis classifies the cycle; the volatility contraction pattern is a specific entry setup that Mark Minervini trades inside Stage 2.
Initially below the base or the post-breakout pullback low; later, trailed below significant correction lows and eventually below the 30-week average.
References & Related Guides
Read next
- VCP Pattern
- Moving Averages
- Darvas Box
- Cup and Handle Pattern
- Wyckoff Method
- Best Indicator for Stocks
- Swing Trading Strategies
- Position Trading
- Breakout Trading
- Andrews Pitchfork
- Free TradingView indicators
- Zeno — the premium engine
- Coppock Curve Indicator