Relative Vigor Index (RVI): Formula, Signals and Settings
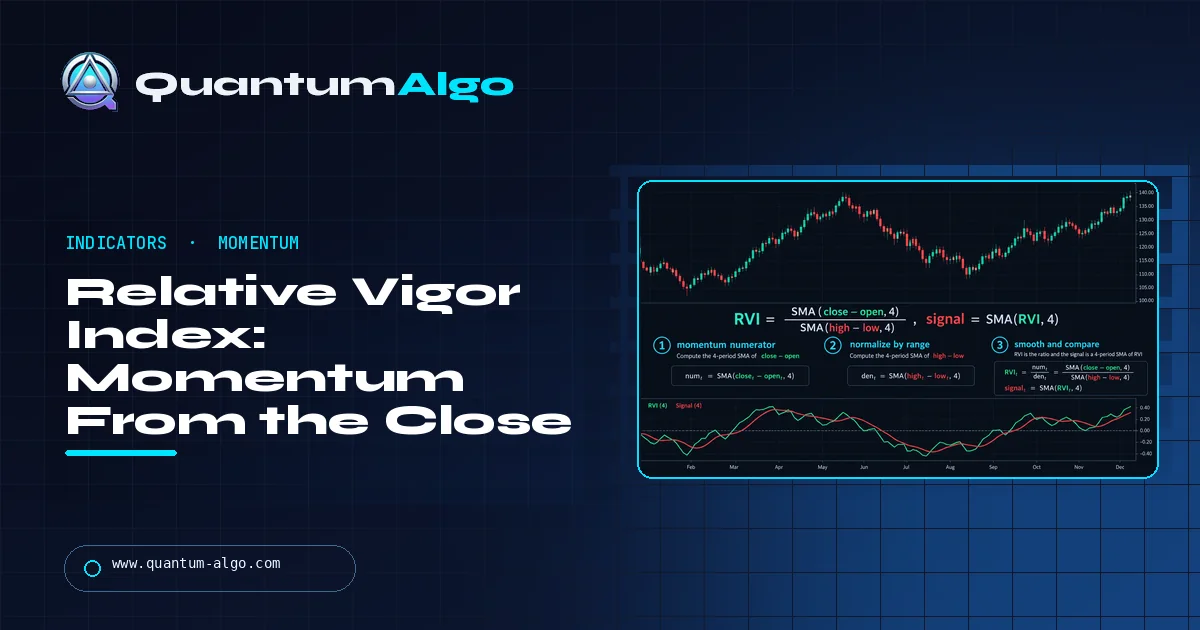
The Relative Vigor Index (RVI or RVGI) is John Ehlers' momentum oscillator that compares each bar's close-minus-open with its high-minus-low, smoothed with a 1-2-2-1 weighted average and summed over 10 bars. Readings above zero show closes beating opens; crossovers with its 4-bar signal line and divergences give trade signals. It is not Dorsey's Relative Volatility Index.
Most oscillators only look at closing prices. The Relative Vigor Index looks at the open too, and that one difference lets it see something RSI and stochastic can't: whether bars are finishing strong or fading inside their own range. This Quantum Algo guide works through Ehlers' formula by hand on 13 real-looking bars, shows where the lag comes from, separates it from the similarly named Relative Volatility Index, and gives TradingView settings, a Pine Script version and the failure modes to watch for.
Indicators that prove themselves in public.
One engine, four precision tools — the Gold (XAU) Scalper, the institutional Gravity Zone, the Zeno momentum Oscillator, and Zeno Stocks for equities.
What does the Relative Vigor Index measure?
Every bar tells you two things about conviction: where it closed relative to where it opened, and how far it travelled to get there. A bar that opens at the low and closes at the high is all vigor. A bar that swings two dollars and closes where it opened has none. The Relative Vigor Index, usually shortened to RVI or RVGI, turns that observation into an oscillator by dividing a smoothed close-minus-open by a smoothed high-minus-low.
John F. Ehlers published it in the January 2002 issue of Technical Analysis of Stocks & Commodities (Volume 20, issue 1, pages 16 to 20). The article's premise is simple: in rising markets prices tend to close above their open, in falling markets below it, and normalising by the range makes the result comparable across instruments and volatility regimes. Ehlers was an engineer who brought signal-processing ideas into trading, and his fingerprint shows in the indicator's 4-bar symmetric filter, the same kind of short smoothing he uses across his work.
The output centres on zero. Positive values mean closes have been beating opens over the lookback; negative values mean the opposite. There's no fixed upper or lower bound in theory, but because the numerator can never exceed the denominator on any single bar, readings stay between −1 and +1 and usually sit well inside ±0.5. A signal line, a further 4-bar smoothing of the RVI, gives crossover signals.
If you already use the stochastic oscillator, the closest mental model is this: the stochastic asks where the close sits inside the recent high-low range, while the RVI asks where the close sits relative to the open, scaled by that range. That one change makes it a measure of intrabar buying or selling pressure rather than position within a range.
Relative Vigor Index vs Relative Volatility Index: don't mix them up
Search for "RVI" and you'll get two unrelated indicators. This trips up traders constantly, including on forums and in some broker glossaries, and it matters because they answer different questions and plot on different scales.
| Relative Vigor Index | Relative Volatility Index | |
|---|---|---|
| Creator | John Ehlers | Donald Dorsey |
| First published | Stocks & Commodities, January 2002 | Stocks & Commodities, June 1993 (refined in a later 1995 article) |
| Core input | Close − open, divided by high − low | 10-day standard deviation, fed into an RSI-style up/down split |
| Scale | Centred on zero, roughly −1 to +1 | 0 to 100, with 50 as the midline |
| Answers | Are bars closing with conviction in one direction? | Is volatility expanding on up days or down days? |
| TradingView name | Relative Vigor Index (short title RVGI) | Relative Volatility Index (RVI) |
Dorsey built his RVI as a confirming indicator. His 1993 article argued that a confirmation tool should measure something different from the tool it confirms, so he replaced the RSI's price changes with standard deviation. Ehlers' RVI is a primary momentum oscillator with its own crossover signals. Using one when a strategy calls for the other quietly breaks the strategy.
◆ Quick test: if the indicator you're looking at runs 0 to 100 and has a 50 line, it's Dorsey's Relative Volatility Index. If it oscillates around zero with a red signal line, it's Ehlers' Relative Vigor Index. On TradingView, look for the short title RVGI.
The rest of this guide is about Ehlers' Relative Vigor Index.
The Relative Vigor Index formula, step by step
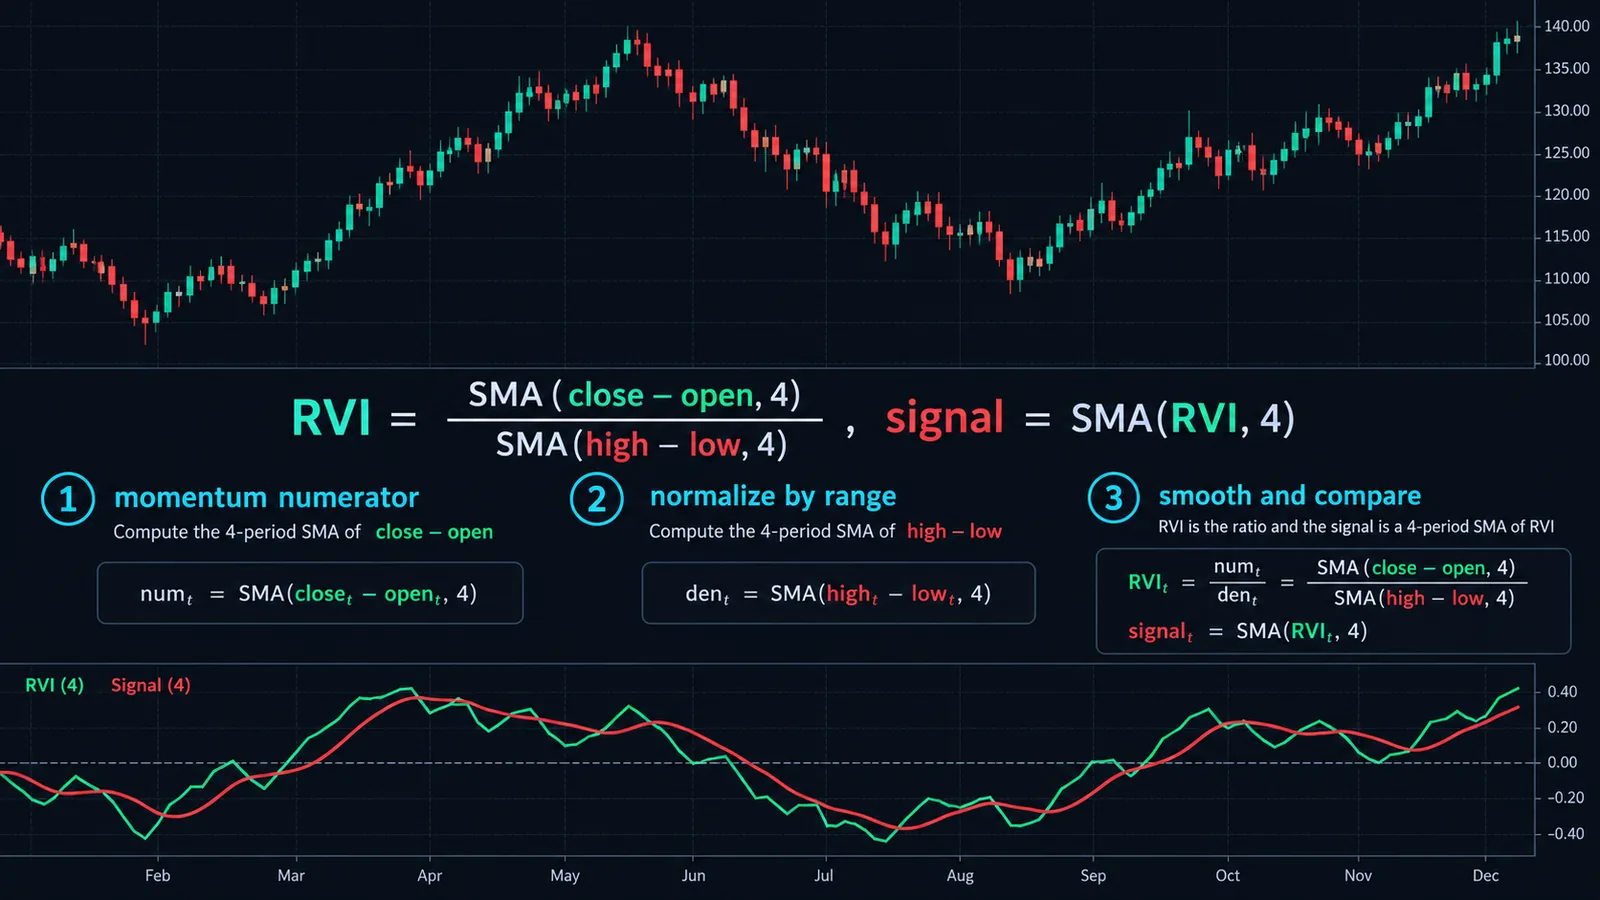
The calculation has four steps. Each uses the same 4-bar symmetric weighted moving average (SWMA) with weights 1, 2, 2, 1.
Numerator = [(C−O) + 2(C−O)[1] + 2(C−O)[2] + (C−O)[3]] / 6
Denominator = [(H−L) + 2(H−L)[1] + 2(H−L)[2] + (H−L)[3]] / 6
RVI = Sum(Numerator, N) / Sum(Denominator, N)
Signal = [RVI + 2·RVI[1] + 2·RVI[2] + RVI[3]] / 6
Here [1] means one bar ago, and N is the length, 10 by default. A few details that most explanations skip:
- Sum or average makes no difference. Ehlers' original TradeStation code (published in the January 2002 Traders' Tips) uses Summation over Length. Other sources describe a simple moving average of the numerator divided by a simple moving average of the denominator. Since both are divided by the same N, the ratio is identical.
- The /6 cancels too. The numerator and denominator are both divided by 6, so it drops out of the ratio. It only matters for the signal line.
- The filter is symmetric. Weights 1-2-2-1 centre the smoothing 1.5 bars back. Ehlers' code calls it a triangular average of length 4, MetaTrader's documentation spells out the 1-2-2-1 weights, and TradingView's Pine function
ta.swmauses the same weights. - Warm-up. The first numerator needs 4 bars, the first RVI needs N + 3 bars (13 at length 10), and the first signal value needs N + 6 bars (16).
Expect lag. The 4-bar filter delays the numerator and denominator by about 1.5 bars, and summing 10 bars adds roughly another 4.5, so the RVI line reflects conditions centred around 6 bars ago. The signal line adds another 1.5. That's why RVI crossovers often print after the first leg of a move, not at its start.
Why 1-2-2-1 and not a plain average?
The weights aren't arbitrary. Ehlers framed the RVI as an old idea updated with filter and signal-processing methods, and this 4-tap filter has a neat property you can check with a few lines of arithmetic: it completely cancels any cycle that repeats every 2 bars and any cycle that repeats every 3 bars. Feed it an alternating series like +1, −1, +1, −1 and the output is (1 − 2 + 2 − 1) / 6 = 0. Feed it a repeating +1, 0, −1 pattern and every output is 0 as well. Those 2- and 3-bar wiggles are mostly noise on any timeframe, so removing them before summing gives a cleaner line than a 4-bar simple average would, which only cancels the 2-bar and 4-bar cycles.
The trade-off is that the filter is short. It cleans up the very fastest noise and leaves everything slower in the data. That's the job of the N-bar sum, and it's why the length setting, not the smoothing, decides how jumpy your RVI looks.
Worked example: calculating RVI by hand
To keep the arithmetic readable, this example uses length 4 instead of 10. The logic is identical. Here are 13 bars of a market that rallies from 100 to about 104, stalls, pulls back and then starts to recover:
| Bar | Open / High / Low / Close | Close − Open | High − Low |
|---|---|---|---|
| 1 | 100.0 / 101.2 / 99.6 / 100.9 | +0.90 | 1.60 |
| 2 | 100.9 / 102.0 / 100.5 / 101.8 | +0.90 | 1.50 |
| 3 | 101.8 / 102.4 / 101.0 / 101.3 | -0.50 | 1.40 |
| 4 | 101.3 / 102.9 / 101.1 / 102.6 | +1.30 | 1.80 |
| 5 | 102.6 / 103.5 / 102.2 / 103.1 | +0.50 | 1.30 |
| 6 | 103.1 / 103.6 / 102.0 / 102.4 | -0.70 | 1.60 |
| 7 | 102.4 / 103.0 / 101.5 / 102.8 | +0.40 | 1.50 |
| 8 | 102.8 / 104.1 / 102.6 / 103.9 | +1.10 | 1.50 |
| 9 | 103.9 / 104.4 / 103.0 / 103.2 | -0.70 | 1.40 |
| 10 | 103.2 / 103.8 / 102.1 / 102.5 | -0.70 | 1.70 |
| 11 | 102.5 / 103.0 / 101.4 / 101.7 | -0.80 | 1.60 |
| 12 | 101.7 / 102.6 / 101.2 / 102.3 | +0.60 | 1.40 |
| 13 | 102.3 / 103.4 / 102.0 / 103.1 | +0.80 | 1.40 |
Step 1: the first numerator and denominator
On bar 4, the close-minus-open values for bars 4, 3, 2 and 1 are +1.30, −0.50, +0.90 and +0.90. Applying 1-2-2-1 weights: (1.30 + 2×(−0.50) + 2×0.90 + 0.90) / 6 = 3.00 / 6 = 0.5000. The ranges are 1.80, 1.40, 1.50 and 1.60: (1.80 + 2.80 + 3.00 + 1.60) / 6 = 9.20 / 6 = 1.5333.
Step 2: the first RVI
With length 4, the first RVI needs four numerators, so it arrives on bar 7. Sum of numerators for bars 4 to 7: 0.5000 + 0.5000 + 0.4000 + 0.2167 = 1.6167. Sum of denominators: 1.5333 × 3 + 1.5167 = 6.1167. RVI = 1.6167 / 6.1167 = 0.2643. In plain words, over that window the smoothed bodies were about 26% of the smoothed ranges, in the bullish direction.
Step 3: the signal line
The signal needs four RVI values, so it first appears on bar 10: (0.1219 + 2×0.1736 + 2×0.2110 + 0.2643) / 6 = 1.1554 / 6 = 0.1926 (0.1925 at full precision).
| Bar | Numerator (SWMA of C−O) | Denominator (SWMA of H−L) | RVI, length 4 | Signal |
|---|---|---|---|---|
| 4 | 0.5000 | 1.5333 | n/a | n/a |
| 5 | 0.5000 | 1.5333 | n/a | n/a |
| 6 | 0.4000 | 1.5333 | n/a | n/a |
| 7 | 0.2167 | 1.5167 | 0.2643 | n/a |
| 8 | 0.1667 | 1.5000 | 0.2110 | n/a |
| 9 | 0.2667 | 1.5000 | 0.1736 | n/a |
| 10 | 0.0833 | 1.5000 | 0.1219 | 0.1925 |
| 11 | -0.4167 | 1.5500 | 0.0165 | 0.1364 |
| 12 | -0.5167 | 1.5667 | -0.0954 | 0.0592 |
| 13 | -0.0500 | 1.5167 | -0.1467 | -0.0304 |
What the numbers say
Price made its high close of 103.9 on bar 8, but the RVI peaked earlier, on bar 7, and fell on every bar after it. That's the indicator doing its job: bars 6, 9, 10 and 11 all closed below their opens while price was still near the top, so vigor faded before the pullback. By bar 10 the RVI (0.1219) sat below its signal (0.1925), a bearish crossover, and it crossed below zero on bar 12.
Now look at the last two bars. Bars 12 and 13 are both solid green candles, and price is back to 103.1, yet the RVI is still falling to −0.1467. The lag from the 4-bar filter and the summing window means it hasn't caught up with the turn. With length 10 the delay would be longer still. Paste these rows into the calculator below to reproduce every figure, then change the length to see how fast the reading shifts.
How to read RVI signals: crossovers, zero line and divergence
Signal-line crossovers
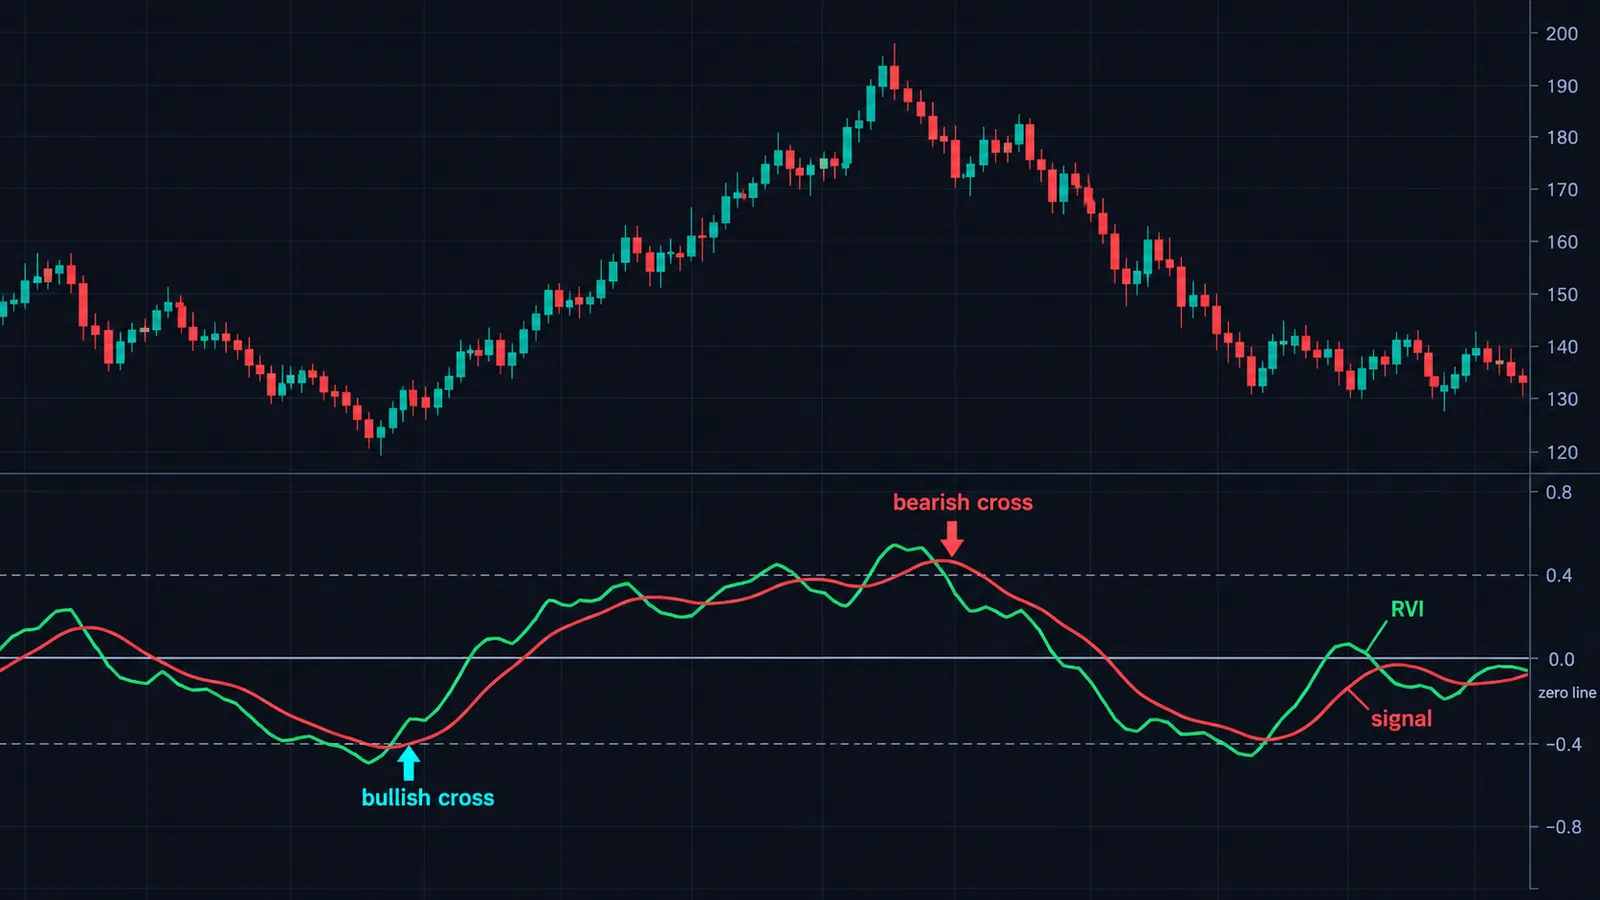
The classic signal is the RVI crossing its signal line: above for bullish, below for bearish. Because the signal is only a 4-bar smoothing of the RVI, crosses come frequently, and in a sideways market they alternate every few bars. The most reliable way to use them is in the direction of the higher-timeframe trend. A bullish cross during a pullback in an uptrend is a much better trade than a bullish cross in the middle of a range.
Zero-line position
Above zero, closes have been beating opens across the window, so buyers are finishing bars stronger. Below zero, sellers are. The zero line works well as a regime filter: take only long crossovers while the RVI is above zero, or only short ones while it's below, and you cut many counter-trend whipsaws.
Divergence
When price makes a higher high but the RVI makes a lower high, bars at the new high are closing with less conviction than bars at the previous one. Ehlers' framing, that the close-open difference carries the energy of the move, is exactly why this divergence can be informative: it shows buyers losing control inside the bars even while the extremes push higher. The worked example above is a small version of this. Bullish divergence is the mirror: lower low in price, higher low in RVI.
Treat divergence as a warning, not an entry. Momentum can diverge for a long time in a strong trend. Pair it with a structural trigger, such as the break of the most recent swing covered in our BOS and CHoCH guide, before acting.
Candle context
Because RVI is built from candle bodies and ranges, it agrees closely with what you see in the candlestick patterns on the chart. A run of doji candles pulls the numerator toward zero and drags RVI toward the zero line even when the range stays wide.
Best Relative Vigor Index settings by timeframe
Length 10 is the default in Ehlers' original code, in MetaTrader and in TradingView's built-in, and the signal smoothing is fixed at 4 bars in all three. You rarely need to touch the signal. The length is worth adjusting:
| Use case | Length | Why |
|---|---|---|
| Scalping 1 to 5 minute charts | 6 to 8 | Faster turns; accept more noise and filter with trend |
| Intraday 15 minute to 1 hour | 10 | Default balance of speed and smoothness |
| Swing trading on 4 hour and daily | 10 to 14 | Fewer crossovers through multi-day pullbacks |
| Weekly trend context | 14 to 20 | Reads the underlying pressure, not single swings |
These ranges are starting points from practical use, not optimised values, and we found no published study that establishes a best length. Two rules of thumb hold up. First, every extra bar of length adds about half a bar of lag. Second, shortening below 6 makes the RVI track individual candle bodies, at which point you're better off reading the candles directly.
A good multi-timeframe habit is to read the RVI one timeframe up from where you enter. If the 1-hour RVGI is above zero and above its signal, take only long crossovers on the 15-minute chart. You get the higher timeframe's conviction as a filter and the lower timeframe's timing, and the two settings don't need to match.
Market type matters as well. Stocks and index futures with a real session open give the open price meaning. On 24-hour markets like crypto and spot FX, the open of an intraday bar is just the previous bar's close, so RVI there behaves more like a smoothed close-to-close momentum. It still works, but daily bars and session-based charts give more meaningful opens.
How does RVI compare with stochastic, RSI and MACD?
| Indicator | What it compares | Scale | Uses the open? | Best at |
|---|---|---|---|---|
| Relative Vigor Index | Close vs open, scaled by range | Around zero | Yes | Intrabar conviction, fading thrust |
| Stochastic | Close vs recent high-low range | 0 to 100 | No | Range extremes, pullback timing |
| RSI | Average up closes vs down closes | 0 to 100 | No | Overbought/oversold, momentum regime |
| MACD | Fast vs slow moving average of close | Unbounded, price units | No | Trend momentum and its turns |
The real differentiator is the open. Close-only oscillators can't tell a day that gapped up and sold off all session from a day that opened flat and rallied, if both closed at the same price. RVI can: the first has a negative body, the second a positive one. That makes RVI a useful second opinion next to RSI rather than a replacement.
The flip side is that RVI ignores gaps. Close-minus-open only measures what happened inside the bar, so an overnight gap up followed by a flat session reads as neutral. If gaps carry your edge, close-to-close tools like RSI see them and RVI doesn't. For pairing ideas, our best indicator combinations guide and the Stochastic Momentum Index guide cover oscillators that complement each other without repeating the same input.
How to set up the Relative Vigor Index on TradingView
- Open a chart, click Indicators, and search "Relative Vigor Index". Pick the built-in one; its short title on the chart is RVGI. Don't pick Relative Volatility Index by mistake.
- The RVGI pane shows two lines: the RVGI line (green by default) and the Signal line (red).
- Open settings. The Length input defaults to 10. Change it there; the signal smoothing has no input because it's fixed at 4 bars.
- Add a horizontal line at 0 from the Style tab or with the drawing tools, so the zero-line regime is easy to see.
- Set alerts with Alert → condition RVGI, "Crossing", Signal. Use "Once per bar close" so the alert only fires on a confirmed cross, since the live bar's values move until it closes.
If you want to modify it, this Pine Script v6 version reproduces the built-in calculation:
//@version=6
indicator("Relative Vigor Index", "RVGI", format = format.price, precision = 4)
len = input.int(10, "Length", minval = 1)
rvi = math.sum(ta.swma(close - open), len) / math.sum(ta.swma(high - low), len)
sig = ta.swma(rvi)
plot(rvi, "RVGI", color.green)
plot(sig, "Signal", color.red)
hline(0, "Zero")
On a confirmed bar, RVI doesn't repaint: every input is a completed bar's OHLC. The current bar's value changes until it closes, like any indicator, which is why alerts should wait for the close. Our non-repainting indicators guide explains the distinction.
When the Relative Vigor Index fails
- Choppy ranges. In sideways markets, candle bodies alternate direction and the signal line crosses every few bars. This is the main source of losing RVI trades. A trend filter, such as price relative to a 50-period average from our moving averages guide, removes many of them.
- Gap-driven moves. RVI only sees what happens between open and close. A stock that gaps 4% on earnings and then drifts sideways shows little vigor, even though the gap was the whole move.
- Late signals in fast reversals. As the worked example showed, the RVI was still falling two strong green bars into a recovery. V-shaped turns leave it behind.
- Thin or tiny-range bars. When ranges are very small, as in pre-market or holiday sessions, a few ticks of body produce large RVI swings. The denominator is the safeguard, but only if the window includes normal bars too.
- Persistent strong trends. In a steady trend with small bodies and long wicks, RVI can hover near zero and print bearish crosses that never pay. Momentum is fading on paper while price keeps grinding.
- Misidentification. Running the Relative Volatility Index while following an RVGI method, or vice versa, is the most common avoidable mistake.
On evidence: we found no rigorous, independent study of RVI crossover performance, and Ehlers' original article presents it as an oscillator rather than a tested trading system. Test it on your own market and timeframe before trusting it, and use ATR-based stops so the risk side doesn't depend on the oscillator at all.
A simple rules-based way to trade with RVI
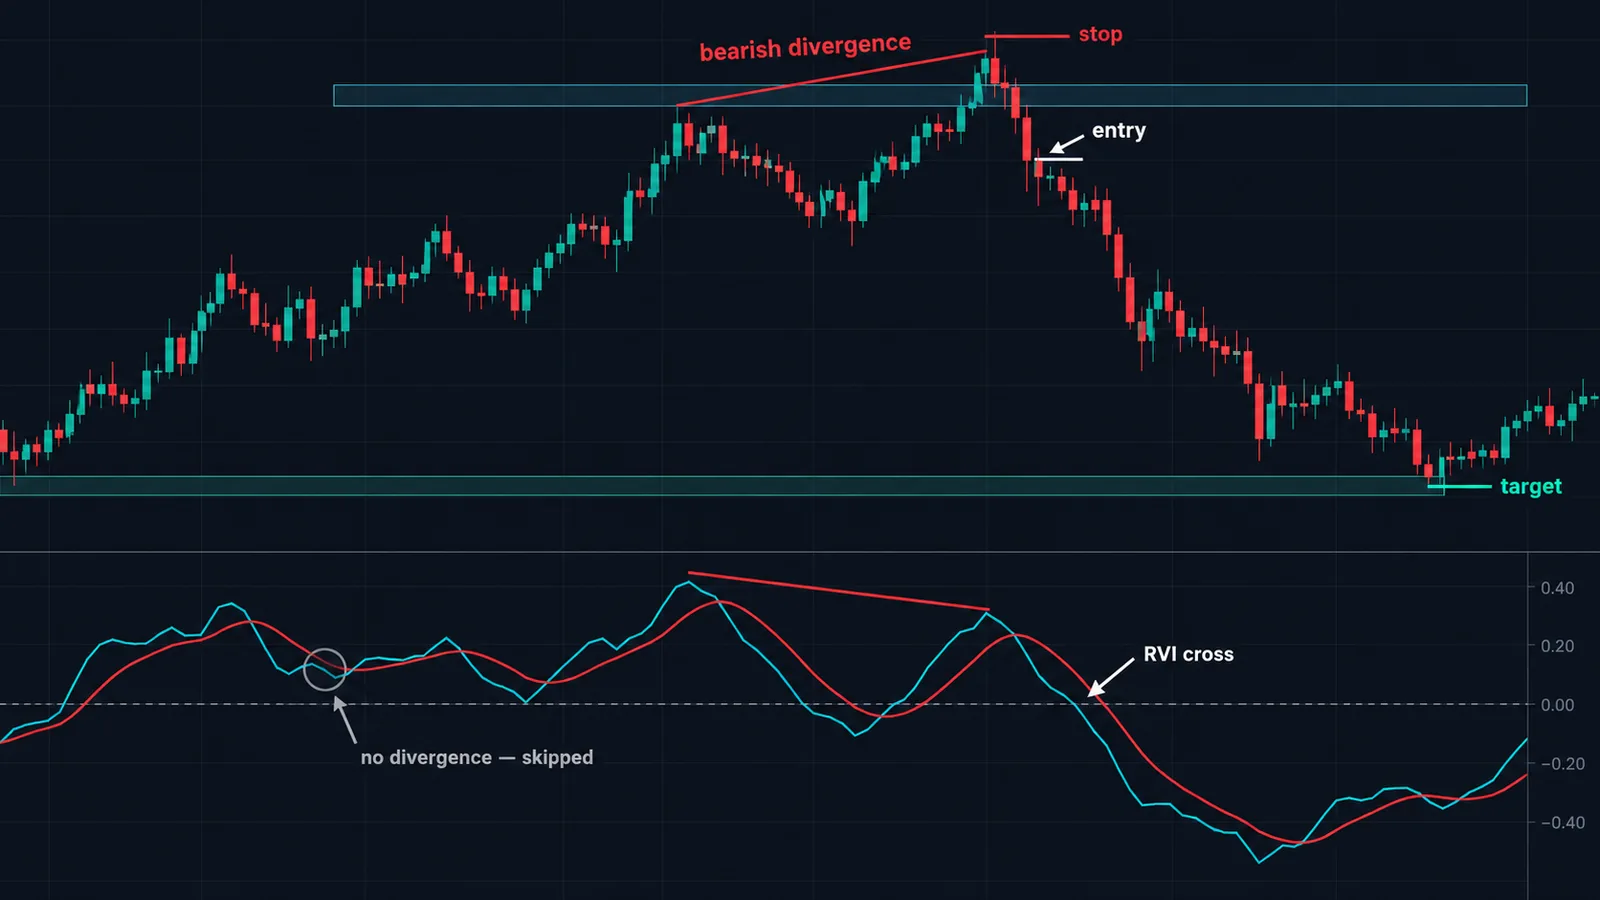
Here's a structure that uses RVI for what it does well and leans on other tools for the rest. It's a framework to test, not a proven system.
- Trend. Trade long only when price is above its 50-period EMA and the EMA is rising; short only in the mirror case.
- Pullback. Wait for price to pull back toward the EMA, with the RVI dipping below its signal line.
- Trigger. Enter when the RVI crosses back above its signal on a closed bar, preferably while still above zero or crossing up through it.
- Stop. Below the pullback low, or 1.5× ATR from entry, whichever is wider.
- Exit. Take partial profit at 2R. Exit the rest on a bearish RVI cross below zero, or on a bearish divergence at a new high followed by a structure break.
Example in numbers: price pulls back to 104.20 in an uptrend, the RVI crosses above its signal at 0.08, and ATR is 0.60. A 1.5× ATR stop is 0.90 below entry, at 103.30. Risking $300 means a position of $300 / 0.90 ≈ 333 units. The 2R target sits at 106.00.
For smoother momentum alternatives built on similar filtering ideas, see our guides to the TRIX indicator and Kalman filter trading.
Relative Vigor Index and Quantum Algo
RVI works best as a confirmation tool: it tells you whether bars are closing with conviction in the direction you already expect. It's weak at telling you where to enter or where to put your stop.
That's the gap Quantum Algo's Zeno suite fills. Zeno gives buy and sell signals with a built-in stop and targets, and the Zeno Oscillator adds momentum confirmation of its own. A practical pairing is to keep RVGI in a pane as a conviction check: when a Zeno signal fires and the RVI is on the same side of zero and its signal line, the bars behind the move agree with it. When they disagree, treat it as a reason for smaller size, not a veto. Signal history is on the public track record.
For a free option, the QuantumAlgo Multi-Oscillator Divergence Scanner automates the divergence checks described above across several oscillators, and the MACD Matrix gives a close-based momentum read that complements RVI's open-based one. The Academy covers momentum basics if oscillators are new to you.
◆ Interactive check
How well do you know the Relative Vigor Index?
Questions traders ask about the Relative Vigor Index
It is a momentum oscillator by John Ehlers that measures how strongly bars close relative to their open, scaled by their high-low range. Positive values mean closes are beating opens; negative values mean they are falling short.
They are usually the same indicator: Ehlers' Relative Vigor Index. TradingView labels it RVGI to separate it from Dorsey's Relative Volatility Index, which it labels RVI.
Length 10 is the standard default on TradingView and MetaTrader and in Ehlers' original code. Shorter lengths (6 to 8) suit scalping; 10 to 14 suits swing trading. The 4-bar signal smoothing is fixed.
Smooth close-minus-open and high-minus-low with 1-2-2-1 weights over four bars, sum each over N bars, and divide the first sum by the second. The signal line is a 1-2-2-1 smoothing of the result.
It lags. At length 10 the RVI reflects conditions centred about 6 bars back, and its signal line about 1.5 bars more. Divergences can give early warnings, but crossovers confirm moves after they start.
An RVI cross above its signal line means vigor is picking up relative to its recent average, a bullish sign; a cross below is bearish. Crossovers are most reliable in the direction of the larger trend.
No. The Relative Volatility Index is Donald Dorsey's 1993 indicator, which applies an RSI-style calculation to standard deviation on a 0 to 100 scale. The Relative Vigor Index is Ehlers' zero-centred close-versus-open oscillator.
Not on closed bars, since it uses only completed OHLC data. The value on the forming bar changes until it closes, so alerts should be set to trigger once per bar close.
Neither is better across the board. RVI uses the open and catches intrabar conviction; RSI uses close-to-close changes and captures gaps. Many traders run them together, as covered in our RSI guide.
Yes, but on 24-hour markets the open of an intraday bar is just the previous close, so RVI behaves more like smoothed close-to-close momentum there. Daily or session-based bars give the open more meaning.
References & Related Guides
Read next
- Stochastic Oscillator
- RSI Indicator
- MACD Indicator
- Stochastic Momentum Index
- WaveTrend Oscillator
- The Best Indicator Combination
- Break of Structure & CHoCH
- Candlestick Patterns
- Doji Candlestick
- Non-Repaint Indicators
- Free TradingView indicators
- Zeno — the premium engine
Primary sources
- Stocks & Commodities — V.20:1 (16-20): Relative Vigor Index by John F. Ehlers
- Stocks & Commodities — Traders' Tips, January 2002 (RVI code)
- MetaTrader 5 Help — Relative Vigor Index
- TradingView Help Center — Relative Vigor Index
- Fidelity Learning Center — Relative Vigor Index (RVI)
- Stocks & Commodities — V.11:6 (253-256): The Relative Volatility Index by Donald Dorsey
- TradingView Help Center — Relative Volatility Index