UT Bot Alerts Best Settings for the Indian Market: Nifty & Bank Nifty on the 5-Minute Chart
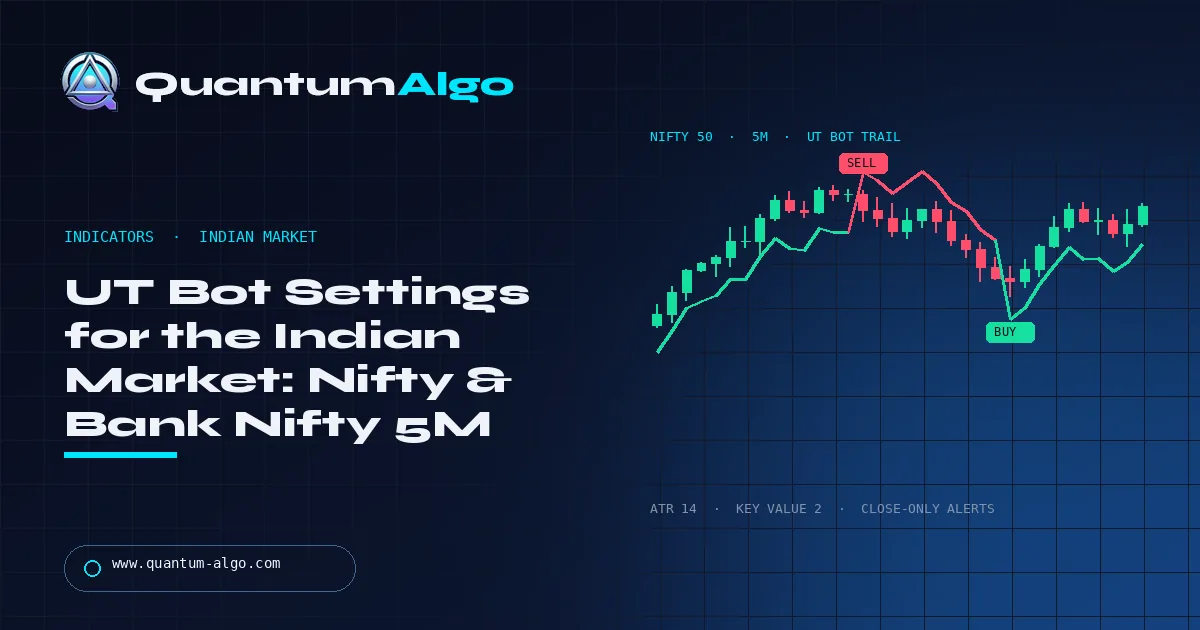
There is no single “best” UT Bot Alerts setting for the Indian market. On the 5-minute chart, start with ATR period 14 and key value 2 with close-only alerts, test key value 2.5–3 if Bank Nifty whipsaws inside the opening range, and only keep a setting that survives a walk-forward test on the exact NSE instrument you execute.
I get asked for “the” UT Bot setting for Nifty more than for any other indicator, and the honest answer is that the setting matters less than the script version, the session filter and the cost model around it. This guide gives you a transparent 5-minute baseline for Nifty 50 and Bank Nifty, explains what the ATR period and key value actually change, and walks through a walk-forward test so the number you keep is one you earned. Quantum Algo’s free public indicators mark the structure around a UT flip; Zeno is the separate paid signal layer with SL/TP and built-in risk management.
Indicators that prove themselves in public.
One engine, four precision tools — the Gold (XAU) Scalper, the institutional Gravity Zone, the Zeno momentum Oscillator, and Zeno Stocks for equities.
What does UT Bot Alerts actually calculate?
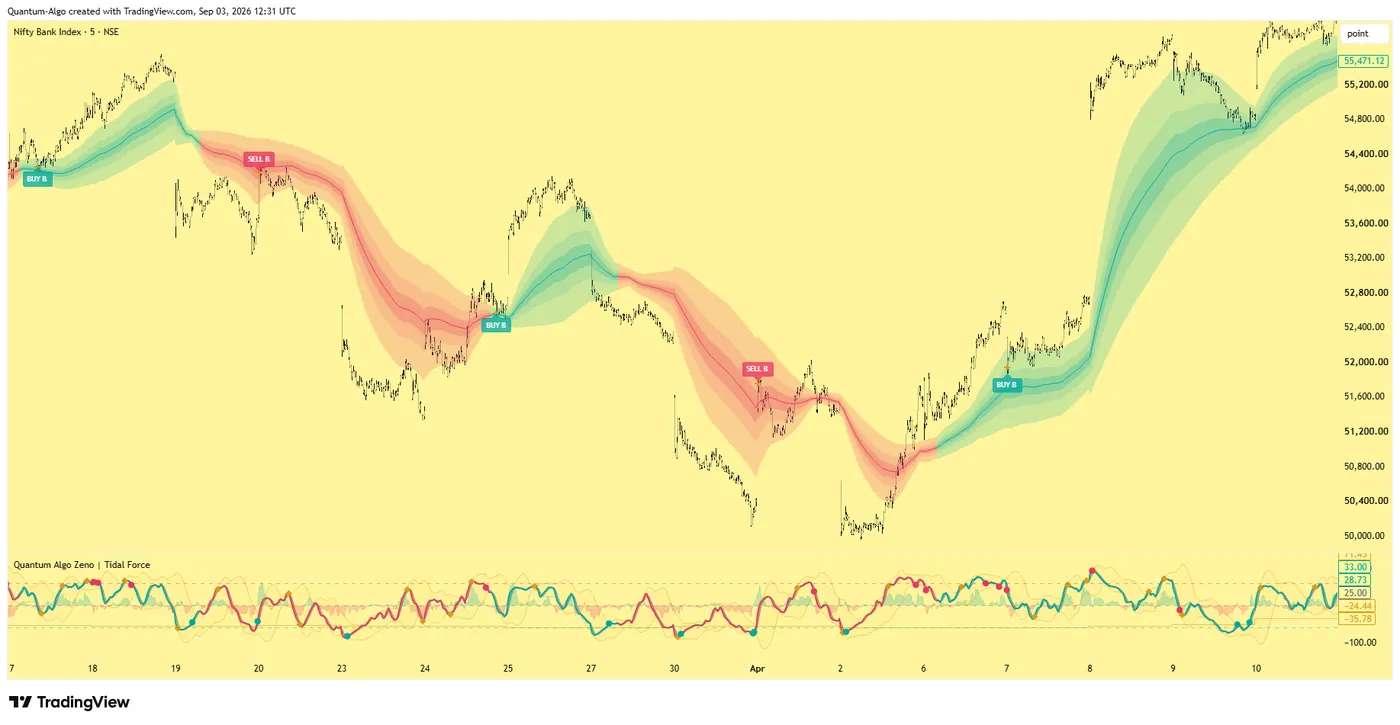
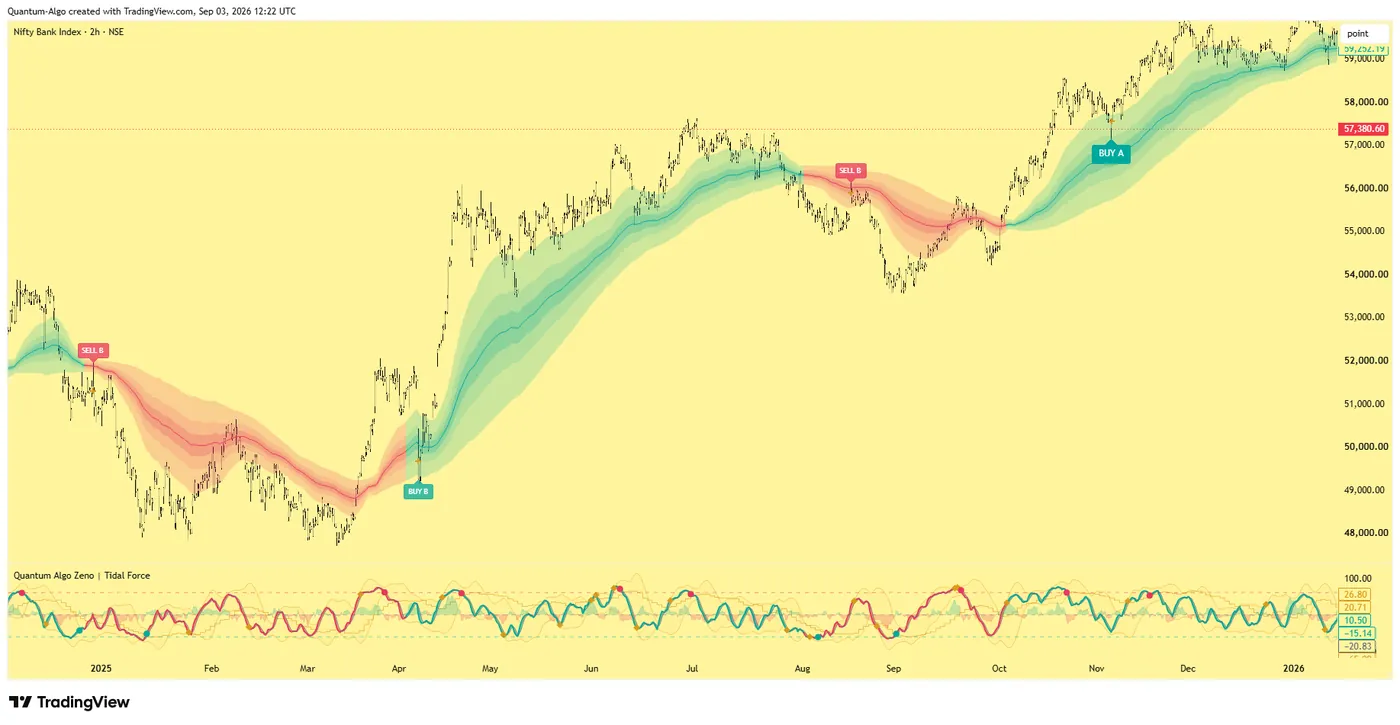
Most UT Bot implementations calculate an ATR-based trailing level and change state when price crosses that level. The key value controls how far the trailing level sits from price. ATR measures volatility, not direction: TradingView defines true range as the largest of the current high-low range and the absolute gaps from the previous close, then smooths true range into ATR. A trailing stop based on ATR therefore expands when the market becomes more volatile and contracts when it becomes quieter.
The alert is only as reliable as the event definition. A script may fire on an intrabar touch, on a confirmed close, or on a state change that is different from the visual color. TradingView’s Pine documentation explains that realtime high, low, close, and volume can change until the bar closes; alerts set to fire before close can therefore produce signals that disappear after confirmation. For a five-minute strategy, “once per bar close” is usually the safer baseline.
Why do Nifty and Bank Nifty need different settings?
Nifty 50 and Nifty Bank do not have identical volatility or intraday behavior. Bank Nifty has historically experienced larger intraday swings and sharp event-driven moves, while Nifty often rotates through more balanced ranges. The same ATR multiplier can therefore create a very different number of flips. A setting that appears smooth on Nifty may be too slow on Bank Nifty; a setting that catches a Bank Nifty trend may overtrade Nifty during a range.
The index chart is also not the same as the derivative you execute. An index signal may be generated on spot or futures data while the option you buy includes spread, implied volatility, time decay, and gap risk. Backtest the instrument you intend to trade, or explicitly model the translation from index signal to derivative execution.
Which UT Bot settings should you test first on the 5-minute chart?
Use a small test grid rather than a huge optimization sweep. The following ranges are deliberately narrow:
| Test dimension | Conservative starting range | What it changes |
|---|---|---|
| ATR period | 10, 14, 20 | Shorter reacts faster; longer smooths noise |
| Key value / sensitivity | 1.5, 2, 2.5, 3 | Higher value places the trail farther away |
| Signal confirmation | close only | Reduces intrabar flip risk |
| Session filter | regular cash session | Avoids accidental overnight assumptions |
| Trend filter | optional 20/50 EMA or structure | Removes some counter-trend signals |
Do not choose the row with the highest historical net profit automatically. Prefer a parameter region that behaves similarly across multiple years, instruments, and volatility regimes.
How do you run UT Bot on a 5-minute Nifty chart, step by step?
Step 1: Define the market and session
Choose one symbol and one feed. Decide whether you are analyzing NSE cash, futures, or a broker’s CFD. Record the timezone and the exact session. If your rules operate only during Indian regular hours, exclude candles outside that window. If you trade futures or options, document expiry-day behavior separately.
Step 2: Add the exact script
Open the script’s source or description. Verify the ATR formula, smoothing type, source, key-value meaning, and alert logic. Do not assume “UT Bot” means the original QuantNomad concept or that every community script is identical. Some versions add EMA filters, cooldown periods, dynamic ATR, or session adjustments.
Step 3: Use a moderate baseline
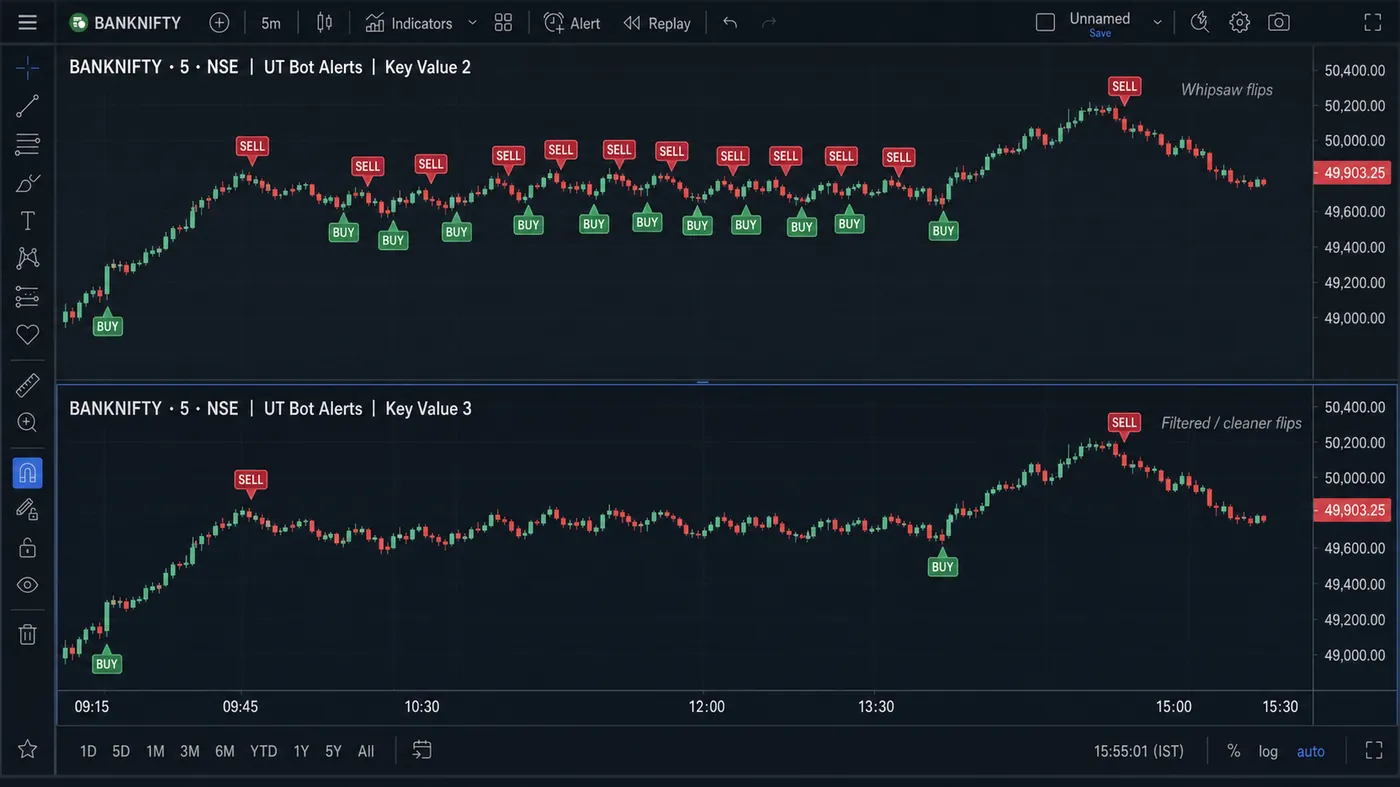
Start with ATR 14 and key value 2. This is not a recommendation to trade live; it is a transparent baseline. If the five-minute chart flips repeatedly during a narrow range, test key value 2.5 or 3 and retain ATR 14. If the signals arrive too late in a clean trend, test ATR 10 before reducing the multiplier aggressively.
Step 4: Confirm with price structure
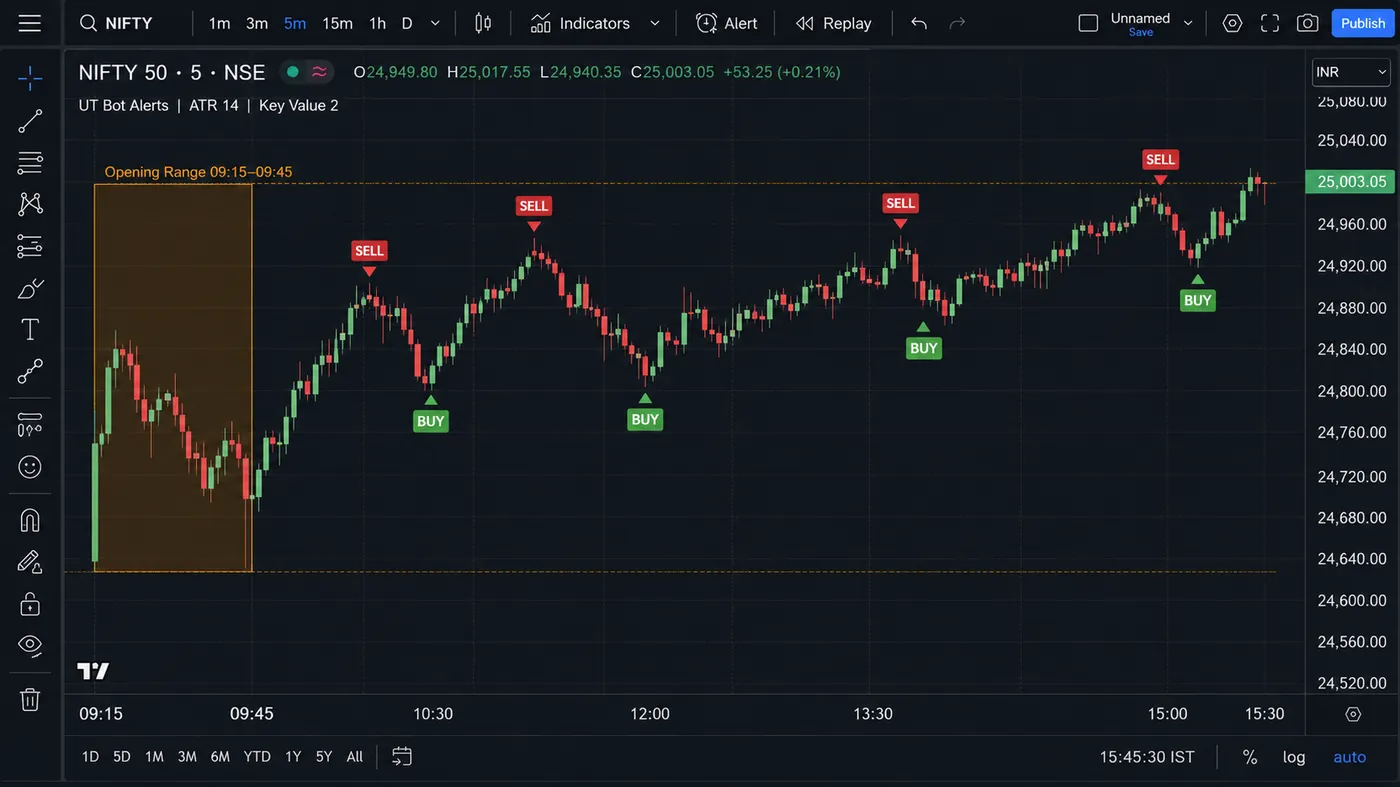
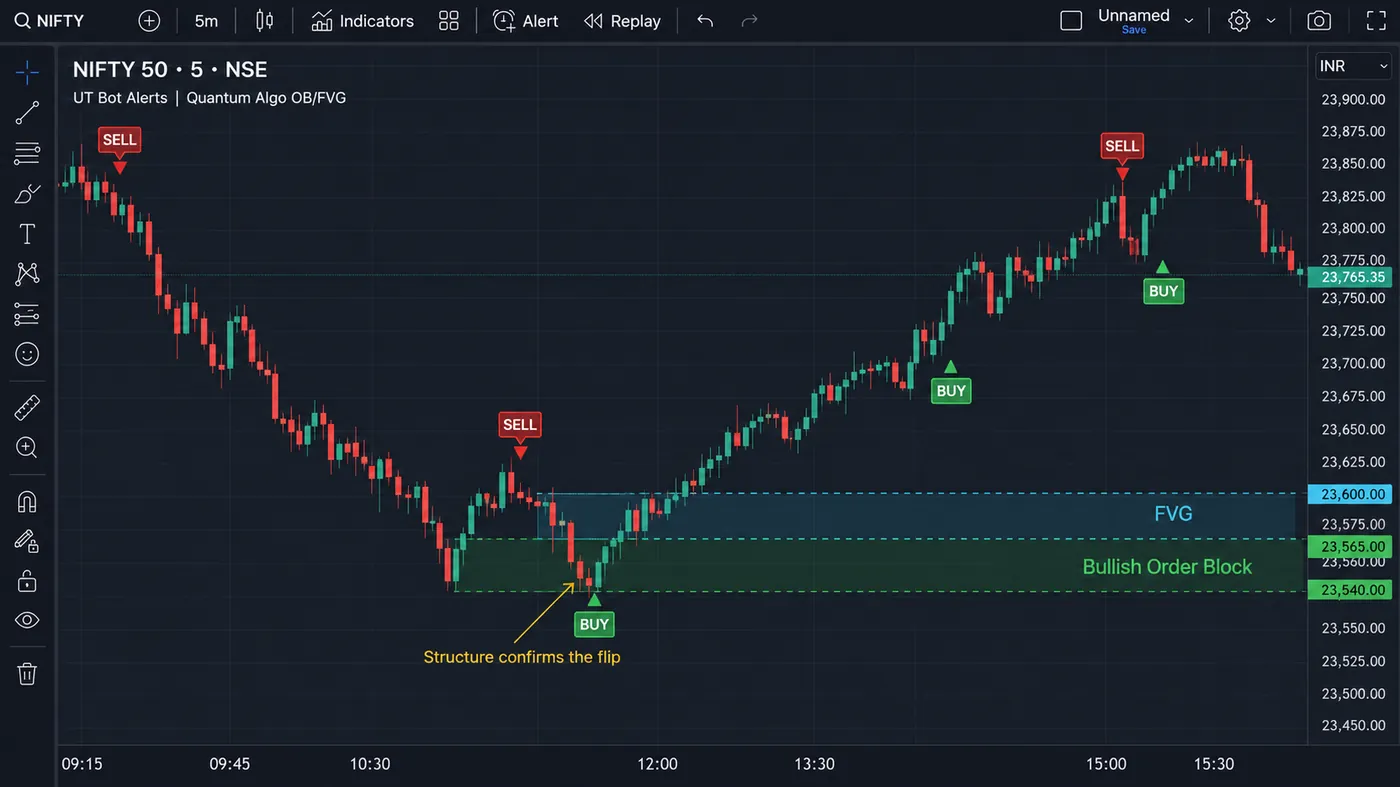
A UT flip is stronger when it aligns with a break of a swing high/low, an opening-range breakout, or a higher-timeframe trend. A green label in the middle of a range is not automatically a long trade. The indicator should tell you that the trailing state changed; price structure tells you whether the location is attractive.
Step 5: Define the stop and size before entry
The UT trailing line can be a reference, but it should not replace a pre-defined risk level. Set the invalidation at a price structure level or at a tested ATR distance. Risk a fixed fraction of equity, calculate the quantity, and include brokerage, exchange fees, taxes, spread, and slippage.
How do the ATR period, key value and EMA filter change the signals?
ATR period
The ATR period determines how much history is used to estimate volatility. A shorter period adapts faster to an opening burst or news shock, but it can overreact to one candle. A longer period is steadier but can remain too wide after volatility has already collapsed. TradingView’s ATR documentation notes that the default is commonly 14 and that the smoothing type can vary; matching the smoothing across tests matters.
Key value or sensitivity
The key value is often a multiplier applied to ATR. Increasing it generally makes the stop more distant and the signal less sensitive. Decreasing it brings the stop closer and creates more reversals. Because the relationship is not perfectly linear once trailing logic is applied, inspect the actual signal count, average trade, drawdown, and whipsaw clusters rather than relying on intuition.
Optional EMA filter
Some scripts include an EMA filter. An EMA filter can remove trades against a broad trend, but it can also delay reversals. Keep the filter separate in your test so you know whether the improvement comes from UT logic or from the added trend constraint.
Which session filters matter for the Indian open?
The Indian session often has a high-energy open, a period of digestion, and a later volatility window around global markets. A five-minute indicator can generate several flips during the first minutes. One research rule is to wait for a completed opening range and allow signals only when price closes outside it. Another is to trade the open but use a wider ATR regime threshold. A third is to skip a low-liquidity midday window.
These are hypotheses, not universal truths. Define the time window in Indian Standard Time, test it across years, and include days with gaps and major events. Never remove losing days after the fact simply because they “look abnormal.”
How do you compare Nifty and Bank Nifty settings fairly?
Use volatility-normalized comparisons. Instead of saying Bank Nifty needs a key value of 3 because it “moves more,” compare the ATR as a percentage of price, the average signal distance in points, and the expected slippage in the traded product. The same percentage volatility can justify similar logic even when the point values differ.
For options, a spot-chart UT signal may be difficult to execute faithfully. Option prices can move because of delta, gamma, implied volatility, and time decay. If you use these signals to buy options, add rules for minimum liquidity, spread width, strike selection, and maximum premium risk. If the guide is used for futures, model margin and point value directly.
How should you configure the TradingView alert?
Create the alert from the exact indicator condition. Check whether the script exposes “Buy,” “Sell,” or a generic alert() event. Set the timeframe to five minutes and verify the alert frequency. TradingView distinguishes conditions, operators, and trigger frequency; changing the indicator’s settings after creating an alert may leave the alert running on old settings, so recreate or verify it after every change.
For non-repainting behavior, prefer bar-close confirmation. If you intentionally trade intrabar, record the precise execution assumption and accept that historical plots will not show every tick. Alerts should not be connected to an execution bot until you have tested duplicate alerts, missed webhooks, market-closed behavior, and emergency shutdowns.
How do you backtest UT Bot without fooling yourself?
Pine strategies use a broker emulator. TradingView documents that order timing, slippage, commissions, and non-standard charts can change results, and that lookahead bias or overfitting can create unrealistic equity curves. Use standard candles for execution tests, specify next-bar or close processing, and model the spread.
Use at least three slices: in-sample for initial design, out-of-sample for selection, and a final forward or paper period. Test Nifty and Bank Nifty separately, then test a third related market to see whether the idea generalizes. Keep the parameter grid small. If the best result jumps from key value 2 to 3 every time the date range changes, the strategy is not stable enough to call “best.”
What does a complete 5-minute UT Bot trade plan look like?
Consider a five-minute Nifty futures test with ATR 14 and key value 2.5. The higher timeframe is above a rising 50 EMA. After the opening range, price closes above the range high and the UT state flips long on the confirmed candle. The planned stop is below the breakout candle’s swing low, with a maximum loss of 0.5% of equity. The trade is skipped if the stop is so wide that the quantity rounds below the minimum tradable size, if spread is abnormal, or if the remaining distance to the next resistance is less than the required reward-to-risk.
The example demonstrates sequencing, not a signal to copy. In a live market, the fill may be worse than the chart close, and the next candle may gap.
When does UT Bot fail on Indian indices?
- Whipsaw in ranges: the trailing state changes repeatedly without directional follow-through.
- News shock: one candle can leap across the stop before an alert or fill occurs.
- Option translation error: an index signal does not equal an option entry with the same risk.
- Intrabar repainting: a temporary cross disappears at the close.
- Feed mismatch: the broker’s candle or volume differs from the chart used for research.
- Parameter overfit: a perfect setting works only on one period.
- Alert drift: the alert remains on old settings after the chart is changed.
How do you run a walk-forward test you can reproduce?
Create a spreadsheet or Pine strategy with columns for date, symbol, session, ATR period, key value, signal bar, entry price, stop, exit, quantity, gross P&L, costs, net P&L, and reason for exit. Divide the history chronologically rather than randomly. For example, use the first 60% to reject obviously poor ideas, the next 20% to select between a few robust candidates, and the final 20% only once for a holdout evaluation. Do not move the boundaries after seeing the result.
Within each slice, report more than total return. Record the number of trades, profit factor, expectancy per trade, maximum drawdown, average adverse excursion, average favorable excursion, percentage of days traded, and the longest losing streak. A setting that earns more with half as many trades can simply be exposed to more sampling error. A setting with a lower return but smaller drawdown may be more usable, especially after taxes and slippage.
Run a sensitivity check around the selected value. If ATR 14/key 2.5 is your candidate, inspect ATR 10–20 and key 2–3 in small increments. The goal is a plateau: neighboring settings should remain acceptable. A narrow spike is a warning that the model has memorized the sample.
What execution details are specific to NSE products?
Keep the chart timezone, exchange session, and broker session aligned. A five-minute candle built from different session boundaries can shift the opening-range signal. Verify the current NSE contract specification, lot size, expiry calendar, and trading hours before you rely on a numerical example; exchange rules can change. For index options, include bid/ask spread, liquidity, implied-volatility changes, and the possibility of partial fills. For futures, include initial and maintenance margin, mark-to-market mechanics, and gap risk.
Avoid presenting a backtest on spot Nifty as if it were a tradable options equity curve. Label every test by instrument. If the strategy generates a spot signal but executes futures, model the basis and roll. If it executes options, model strike selection and option Greeks. This distinction is a major quality signal for readers and protects the guide from making an apples-to-oranges claim.
Treat ATR 14 / key value 2 as a transparent baseline, not an answer. The setting you keep is the one that survives a walk-forward test on the exact NSE instrument, with close-only alerts, a session filter for the Indian open and a cost model that includes brokerage, STT and slippage. Structure decides whether a flip deserves risk.
◆ Interactive check
Can you separate the setting from the system?
Questions traders ask about UT Bot on Nifty and Bank Nifty
It is more sensitive and will usually generate more signals, but “more” is not the same as “better.” Test the resulting spread-adjusted expectancy and whipsaw rate.
Start with the same baseline for comparability, then test separately. Different volatility and execution products may justify different settings.
The answer depends on the script. A bar-close implementation can avoid many intrabar changes, while a script using unconfirmed values or higher-timeframe requests can repaint. Inspect the code and test live-versus-historical behavior.
Technically, TradingView alerts can send webhooks, but automation adds operational and financial risk. Test paper execution, duplicate events, rejected orders, timeouts, and a kill switch before using real money.
Start with ATR period 14 and key value 2, close-only alerts, regular NSE session. Keep it only if it survives a walk-forward test on the instrument you execute. If Nifty flips repeatedly inside its range, test key value 2.5 with the same ATR.
Bank Nifty moves more points per candle, so most traders end up at key value 2.5–3 with ATR 14 on the 5-minute chart. Compare ATR as a percentage of price, not raw points, before concluding Bank Nifty “needs” a different setting.
Only with extra rules. An index flip is not an option entry: premium moves with delta, implied volatility and time decay. Add minimum liquidity, a maximum premium, expiry-day exclusions and a stop defined in premium, then test that plan separately.
Test it as a separate variable. A 20/50 EMA direction filter removes counter-trend flips but delays reversals. Keep the filter isolated in your test so you know whether the improvement comes from UT logic or from the EMA.
Ignore flips until the 09:15–09:45 opening range is complete, avoid the lunchtime lull unless a range breaks, and pay attention to the 14:30 window when global markets add volume. Define the windows in IST and test them across years.
Different job. Quantum Algo’s free public indicators mark order blocks, fair value gaps and liquidity so a UT flip lands at a defensible level; Zeno is the paid signal layer with SL, TP1/TP2 and built-in risk management. QuantumBot can execute a fully specified plan.
References & Related Guides
Read next
- UT Bot Alerts: Complete Trading Guide
- ATR (Average True Range) Complete Guide
- What Is ORB (Opening Range Breakout)?
- Non-Repaint Indicators: Reliable Signals
- Backtesting Trading Strategies
- Supertrend Indicator Guide
- Best Trading Bots
Authoritative sources
- TradingView: Average True Range (ATR)
- TradingView: how to configure alerts and trigger frequency
- TradingView Pine Script: strategies, bias and costs
- NSE: equity derivatives contract information
- SEBI: study of individual traders in equity derivatives