COT Report: How to Read the Commitments of Traders for Gold, Forex and Futures
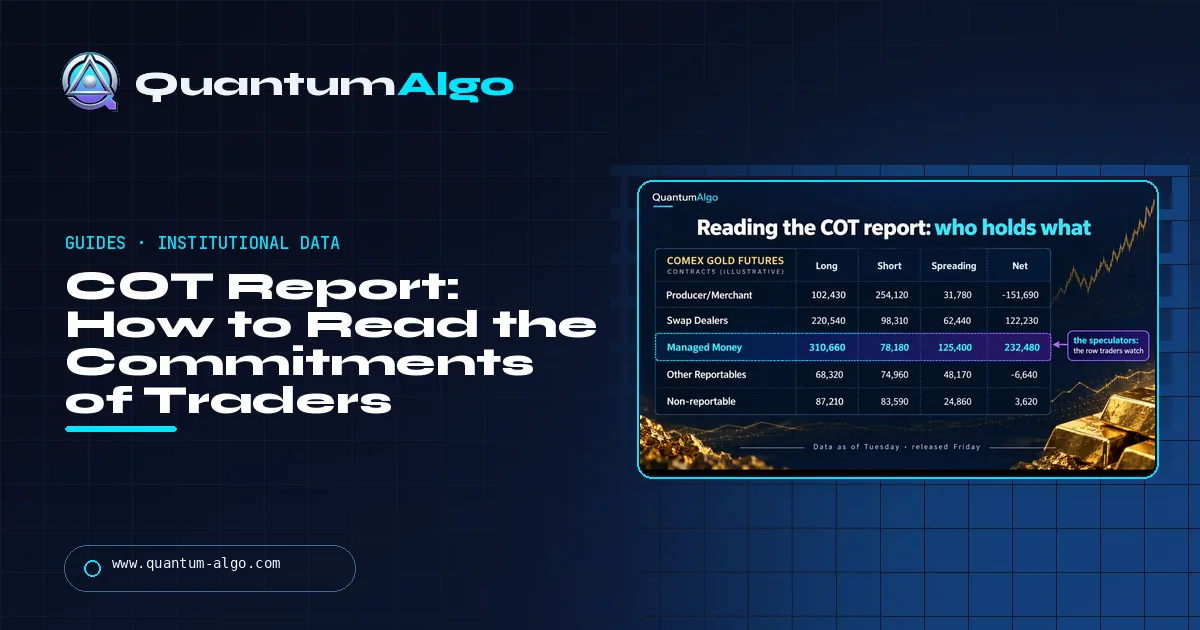
The COT report is the CFTC's weekly breakdown of who holds futures positions — commercial hedgers, funds (managed money) and small traders — published Friday at 3:30 pm ET with Tuesday's data. Traders read the net positions and the COT Index (0–100) to spot crowded extremes in gold, currencies and indices. It is context, not a timing signal.
Price shows where a market is; the Commitments of Traders report shows who is carrying it there. Once a week the CFTC publishes the positions of hedgers, funds and small traders in every major futures market, and a trader who knows which row to read can tell when a trend is running on fresh money and when it is running on fumes. This guide covers what the report is, the four layouts and the trader groups in each, a seven-step reading method, the COT Index, how to apply it to gold, currencies and index futures, where to find the data on TradingView, its limits, a worked gold example, and a positioning reader that turns the numbers into a read.
Indicators that prove themselves in public.
One engine, four precision tools — the Gold (XAU) Scalper, the institutional Gravity Zone, the Zeno momentum Oscillator, and Zeno Stocks for equities.



What is the COT report?
The Commitments of Traders (COT) report is a weekly breakdown, published by the US Commodity Futures Trading Commission (CFTC), of who holds positions in the futures and options markets. Every market where 20 or more traders hold positions above the CFTC's reporting levels is covered: gold, oil, the grains, the currency futures, the stock-index futures, Treasuries and more. Reporting firms — clearing members, futures commission merchants and foreign brokers — report large traders' positions to the CFTC every day; the CFTC aggregates them by type of trader and publishes the snapshot every Friday at 3:30 pm Eastern, using the positions as of the Tuesday of that week.
For a chart trader the report answers one question the chart cannot: who is on the other side, and how stretched they are. Price tells you where the market is; the COT report tells you whether the hedgers, the funds or the small traders are carrying the position, and whether that position is at an extreme. The data goes back a long way — futures-only reports to 1986 and weekly publication since 2000 — so today's positioning can be compared with years of history, which is what turns a number into a signal.
It sits naturally beside the rest of the institutional toolkit: open interest shows how much money is in a market, the put/call ratio shows options sentiment, and the COT report shows which group owns the futures.
Which COT report should you read, and who is in each group?
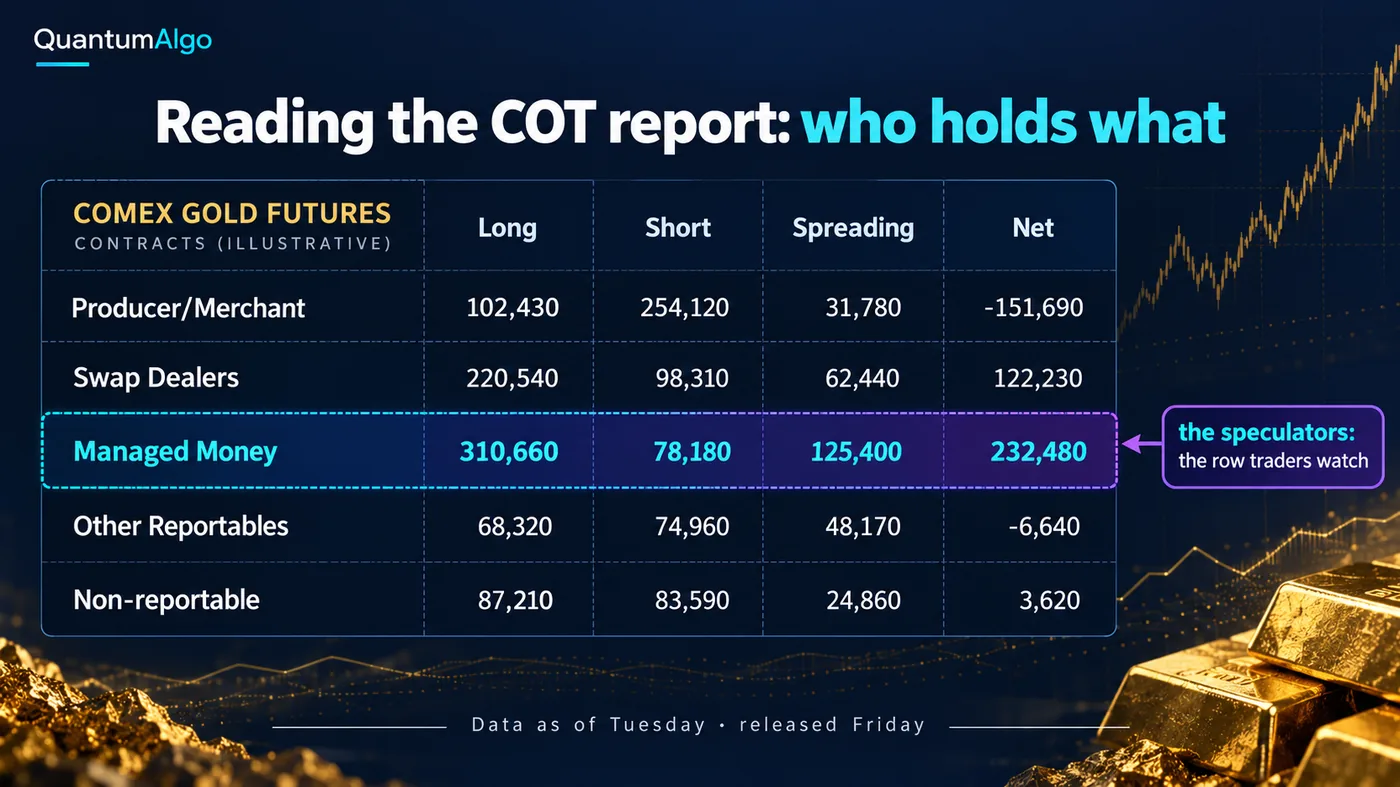
The CFTC publishes the same underlying data in four layouts. Choosing the right one is most of the work, because the groups differ by report and the useful group differs by market.
| Report | Markets | Trader groups | Use it for |
|---|---|---|---|
| Legacy | All reported markets | Commercial, Non-commercial, Non-reportable | Long history; the classic commercials-vs-speculators read |
| Disaggregated (since September 2009) | Physical commodities: metals, energy, agriculture | Producer/Merchant/Processor/User, Swap Dealers, Managed Money, Other Reportables | Gold, silver, oil: Managed Money is the fund money |
| Traders in Financial Futures (TFF) | Currencies, stock indices, interest rates | Dealer/Intermediary, Asset Manager/Institutional, Leveraged Funds, Other Reportables | Forex and index futures: Leveraged Funds are the hedge funds and CTAs |
| Supplemental (CIT) | Selected agricultural markets | Adds Commodity Index Traders | Index-fund flows in the grains and softs |
The CFTC's own definitions are worth knowing because they decide what each row means. A Producer/Merchant/Processor/User is an entity that handles the physical commodity and uses futures to hedge it. A Swap Dealer deals in swaps and hedges them in futures. Managed Money is a registered commodity trading adviser, a registered commodity pool operator or an unregistered fund the CFTC identifies — in practice, the trend-following and macro funds. Everyone else above the reporting level is Other Reportables, and the positions left over after all reportable traders are subtracted from open interest are Non-reportable — the small traders, whose individual identities the CFTC does not know.
Two habits follow. In commodities, read Managed Money for the speculative pressure and Producer/Merchant for the hedging response. In financial futures, read Leveraged Funds for the fast money and Asset Managers for the slow, structural money. The Legacy report lumps several of these together, which is why most COT work on gold and currencies now uses the Disaggregated and TFF layouts.
How do you read the COT report?
- Pick the market and the layout. Disaggregated for gold, silver and oil; TFF for currencies and index futures; Legacy when you need the longest history.
- Find the group that matters. Managed Money in commodities, Leveraged Funds in financials. These are the traders who move with the trend and get forced out of it.
- Calculate the net position. Long minus short. Spreading positions (equal longs and shorts held by the same trader) are excluded from the net.
- Look at the change, not just the level. A net long that grew by 15,000 contracts this week says more about current pressure than the level alone.
- Put it in context with the COT Index. Rescale the net position against its own range over 26, 52 or 156 weeks. Readings above 80 or below 20 are the extremes that matter.
- Check the hedgers. At a speculative extreme the commercials are usually at the opposite extreme. Agreement between the two strengthens the read.
- Then go to the chart. Positioning tells you where the fuel is; structure on the daily or 4-hour chart tells you whether it is igniting.
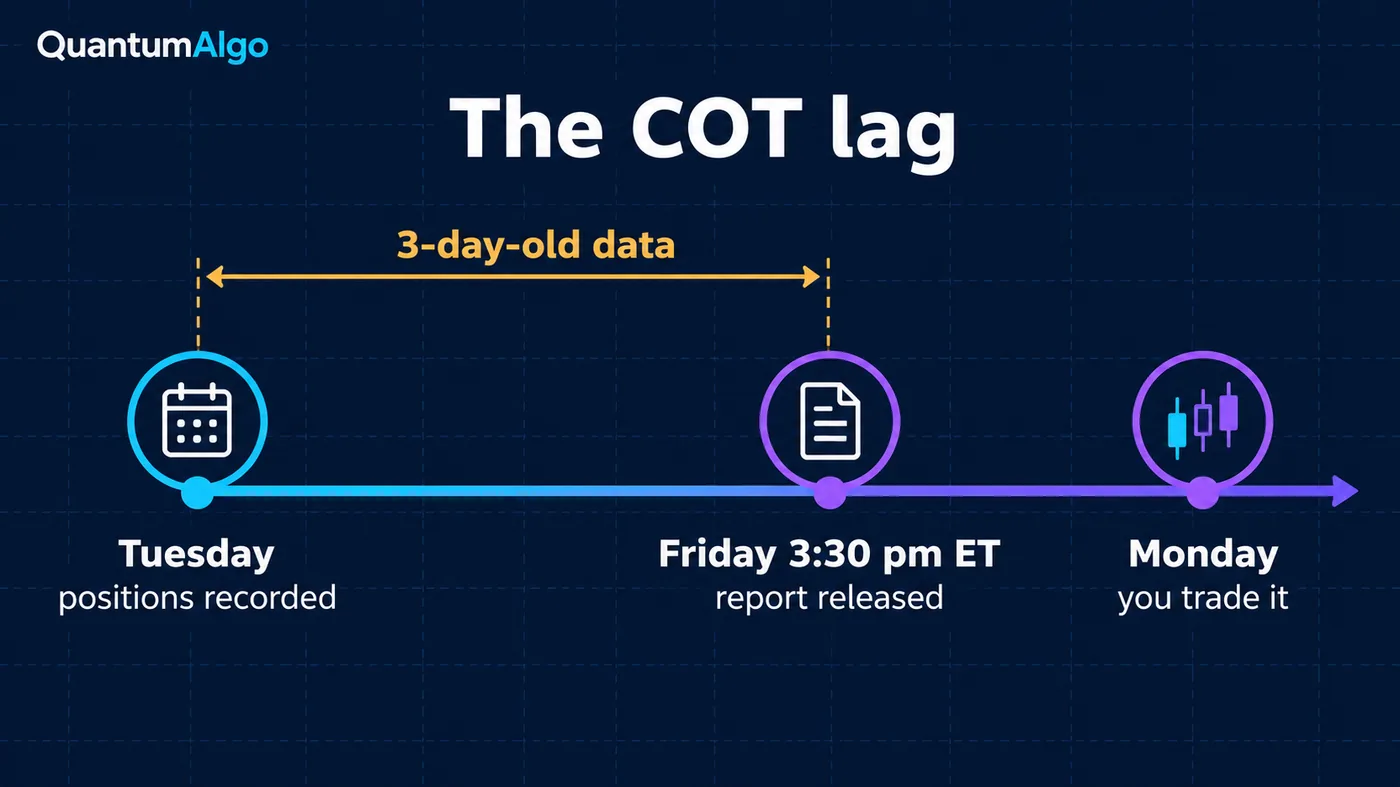
The lag is the first thing to respect. Positions are recorded at Tuesday's close, published on Friday afternoon after the US cash session, and in practice traded on Monday. By then price may already have moved a long way, which is why the report is read for the regime of the next few weeks, not for an entry on Monday morning.
What is the COT Index?
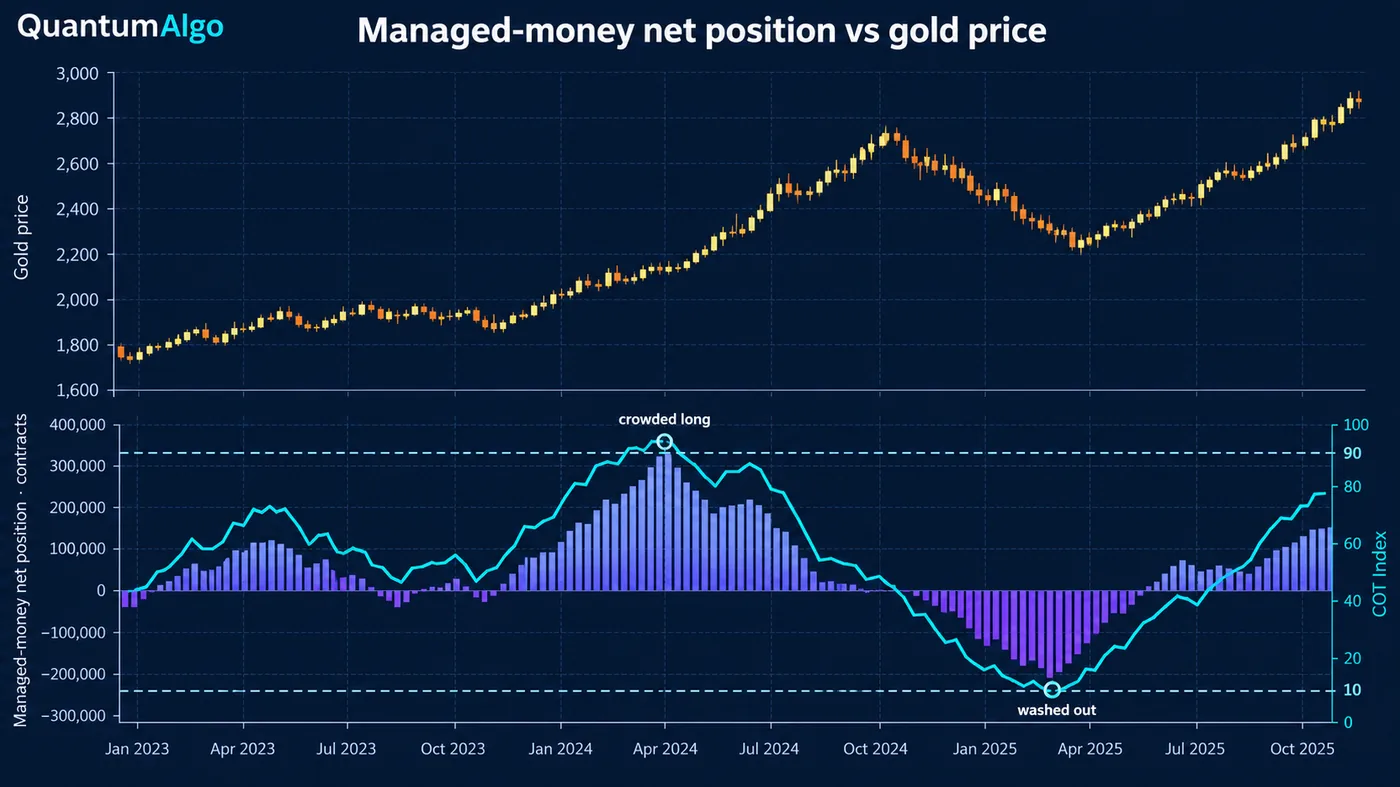
Raw net positions are hard to compare: 150,000 contracts long in gold meant something different in 2016 than it does now, because open interest and the size of the funds have changed. The COT Index solves this by asking a simpler question — where is this week's net position within its own range over the lookback? The formula, popularised by Larry Williams and later by Stephen Briese, is:
COT Index = (this week's net − lowest net in lookback) ÷ (highest net − lowest net) × 100
A reading of 100 means the group is the most long it has been in the lookback; 0 means the most short. The lookback sets the sensitivity: 26 weeks reacts quickly and flags more extremes, 156 weeks (three years) flags fewer and more meaningful ones. Readings above 80 or below 20 are the common convention for an extreme, and some traders use the stricter 90 and 10. For the speculative groups an extreme is a warning that the trade is crowded; for the hedgers it is read the other way round, because commercials buy into weakness and sell into strength.
The index does not say when. A crowded long can stay crowded for months in a strong trend, and the funds are crowded long precisely because they have been right. What the extreme tells you is asymmetry: when everyone who wanted to buy has bought, the next piece of bad news has more sellers than buyers, and the move down is faster than the move up was.

Automate your trades. Let Quantum Algo trade for you.
Every signal executed on your own account — on your account, with the plan you define.
How do you use the COT report for gold?
Gold is the market where the COT report earns its keep for most retail traders. The COMEX gold contract (CFTC code 088691) is covered in the Disaggregated report, and the read is usually framed as Managed Money against Producer/Merchant and Swap Dealers. The funds trend-follow: they add longs as gold rises and cut them as it falls. The bullion banks and producers sit on the other side as hedgers and dealers. When Managed Money is near its three-year maximum net long, a lot of the buying that drove the rally has already happened; when it is near its minimum, the selling is largely done.
That is why the gold COT pairs well with the dollar. A crowded fund long in gold at the same time as the dollar index is basing is a weaker position than the same long while the dollar is falling. The gold trading guide and the gold correlation page cover the macro side; the COT report tells you how many traders are already positioned for it. Spot gold on most CFD platforms tracks COMEX closely, so the read transfers to XAUUSD.
How does the COT report work for forex and index futures?
Currencies are read through the Traders in Financial Futures report, using the CME currency futures. Two details trip people up. First, the futures are quoted against the dollar: a long in the euro future (CFTC code 099741) is a long EURUSD position, but a long in the Japanese yen future is a short USDJPY position, because the future is yen per dollar inverted. Second, the group to watch is Leveraged Funds — hedge funds and CTAs — with Asset Managers as the slower, structural money. A Leveraged Funds extreme in the yen future preceded several of the violent yen short-covering moves of recent years.
Index futures (E-mini S&P 500, Nasdaq) are in the same TFF report. Here Asset Managers are structurally long and Dealers structurally short because they hedge client business, so the levels mean little; the changes at extremes in Leveraged Funds are the read. For the major pairs, the best forex pairs guide covers which pairs carry enough volume for positioning to matter, and the futures beginners guide covers how the contracts themselves work.
Where can you get COT data, including on TradingView?
The source is the CFTC website, which publishes the current reports every Friday and historical files back to 1986. Free charting sites redraw the same data as charts. On TradingView, the data is available through indicators published by TradingView itself — "Commitment of Traders: Total", "Commitment of Traders: Disaggregated Metrics" for commodities such as gold and "Commitment of Traders: Financial Metrics" for currencies and index futures — and through a COT library that script authors build on. Search "Commitment of Traders" in the indicator panel on a futures chart (for gold, the COMEX contract rather than spot) and choose the report layout and trader group in the settings.
Two settings matter. Use "futures only" unless you specifically want options included; combined reports add options on a delta-adjusted basis, which changes the levels. And match the lookback of any index you calculate to your holding period: a swing trader holding for weeks gets more from a 52-week index than from a three-year one. In May 2026 the CFTC also asked for public comment on whether to change the report's timing, frequency and data recency; so far the Friday schedule with Tuesday data is unchanged, but it is worth checking the CFTC page if the release ever looks different.
What can the COT report not tell you?
- When. Extremes can last for months. The report is a regime tool, not an entry trigger.
- Intent. A commercial short is usually a hedge against physical inventory, not a bet that price will fall.
- The last three days. Tuesday's data is stale by Friday and staler by Monday; a big move in between changes the picture.
- Who exactly. Categories are assigned by the CFTC from filings. One fund can be classified differently in different markets.
- Spot and CFD positioning. The report covers US-regulated futures and options only. Spot forex and CFD books are invisible to it.
- Small markets. Thinly traded contracts have few reportable traders and noisy data; the report is most useful in the deep markets.
COT positioning reader
Enter a trader group, this week's and last week's net position, and the highest and lowest net over your lookback. The reader returns the COT Index, the weekly change, the net as a share of open interest if you give it, and what that extreme means for that group — including the inverted read for hedgers.
Reference data
| Item | Value |
|---|---|
| Publisher | US Commodity Futures Trading Commission (CFTC) |
| Release | Every Friday, 3:30 pm Eastern; holiday weeks shift to the next business day |
| Data as of | Tuesday of the same week |
| Coverage | Futures and options markets with 20 or more traders above the reporting levels |
| Layouts | Legacy; Disaggregated (since September 2009); Traders in Financial Futures; Supplemental (CIT) |
| History | Futures-only from 1986, futures-and-options combined from 1995, Supplemental from 2006; weekly since 2000 |
| Gold contract | COMEX gold, CFTC code 088691 — Disaggregated report |
| Euro contract | CME Euro FX, CFTC code 099741 — TFF report |
| COT Index | (net − lowest net) ÷ (highest net − lowest net) × 100 over 26, 52 or 156 weeks; extremes above 80 or below 20 (stricter: 90 / 10) |
| Checked | October 2026 — CFTC report pages and explanatory notes |
Worked example: reading a crowded gold long
The figures here are illustrative, rounded to show the method rather than a particular week. Gold has rallied for four months. In the Disaggregated report, Managed Money is net long 186,000 contracts, up 14,500 on the week; the highest net in the last 156 weeks is 205,000 and the lowest is −12,000. The COT Index is (186,000 + 12,000) ÷ (205,000 + 12,000) × 100 = 91 — above the usual extreme of 80 and even the stricter 90. Producer/Merchant and Swap Dealers combined are near their most net short of the same period, which is what a crowded speculative long usually looks like from the hedgers' side.
That reading does not say sell. It says the easy part of the trend is done and the next shock will meet more longs than buyers. The trader keeps the long bias but changes the playbook: no new longs into resistance, stops tightened under the last 4-hour higher low, and a short considered only if the daily chart breaks structure. Two weeks later gold sweeps the prior high, closes back below it and breaks the 4-hour higher low. That is the trigger the COT read was waiting for: a liquidity sweep into crowded positioning. The short targets the last daily demand zone, with the stop above the sweep high. The COT report did not time the trade; it told the trader which side of the market had the fuel, and the chart said when it caught.
What mistakes do traders make with the COT report?
- Shorting the moment the speculators look crowded. Crowded can last; wait for structure to break.
- Reading the commercials as bearish because they are net short. They are hedgers; their extremes are read inverted.
- Comparing raw net positions across years without an index or a share of open interest.
- Using the Legacy report for gold and currencies when the Disaggregated and TFF layouts separate the groups that matter.
- Forgetting the inversion in currency futures: long the yen future is short USDJPY.
- Trading Monday's open on Tuesday's data as if it were fresh.
- Expecting the report to cover spot forex or CFD books. It covers regulated futures and options only.
How does the COT report fit with structure and the free indicators?
The COT report answers "who is positioned"; the chart answers "is it turning". The free library covers the chart half: the Institutional Key Levels script marks the prior-week and prior-day highs and lows where crowded positions keep their stops, the Liquidity Sweeps script shows when those stops are taken, and the Smart Money Concepts Engine confirms the break of structure that follows. Zeno, the premium engine, then prints the buy or sell signal with a stop and targets, so a COT extreme becomes a planned trade rather than an opinion. The institutional trading explainer covers how the large players behind these numbers actually execute.
Read the right layout (Disaggregated for commodities, TFF for financials), the right group (Managed Money or Leveraged Funds), and the change as well as the level. Rescale with the COT Index, treat extremes as fuel rather than triggers, read the hedgers inverted, remember the three-day lag, and let structure on the chart decide when.
◆ Interactive check
Can you read the COT report?
Questions traders ask about the COT report
The Commitments of Traders report is the CFTC's weekly breakdown of open futures and options positions by type of trader — hedgers, funds and small traders — for every market where 20 or more traders hold positions above the reporting levels.
Every Friday at 3:30 pm Eastern Time, using positions as of the Tuesday of the same week. When a federal holiday falls in the week, publication moves to the next business day.
Choose the layout (Disaggregated for commodities, TFF for financial futures), find the speculative group (Managed Money or Leveraged Funds), calculate net long minus short, compare it with its range using the COT Index, check the hedgers at the opposite extreme, then confirm on the chart.
A 0–100 rescaling of a group's net position within its range over a lookback, usually 26, 52 or 156 weeks: (net − lowest) ÷ (highest − lowest) × 100. Readings above 80 or below 20 are treated as extremes, 90 and 10 by stricter traders.
Neither on its own. A large net long confirms a trend while it is building; at an extreme in the COT Index it warns that the trade is crowded and vulnerable to a sharp reversal once structure breaks.
The Disaggregated report for COMEX gold (code 088691), reading Managed Money against Producer/Merchant and Swap Dealers. Spot XAUUSD tracks the COMEX contract closely, so the read applies to CFD gold too.
Yes, through the CME currency futures in the Traders in Financial Futures report. Watch Leveraged Funds, and remember that some futures are inverted against common pairs — a yen futures long is a USDJPY short.
Yes. TradingView publishes Commitment of Traders indicators, and script authors build on its COT library. Add them on the futures contract — COMEX gold rather than spot — and choose the report and trader group in the settings.
The CFTC collects positions as of Tuesday and publishes on Friday after checking the filings. In 2026 it asked for public comment on timing and frequency, but the Friday schedule with Tuesday data is unchanged so far.
COT positioning is context for the week; the entry comes from the chart. The free indicators mark the levels and sweeps where crowded positions get forced out, and Zeno prints the buy or sell signal with a stop and targets once structure confirms.
References & Related Guides
Read next
- Gold Trading (XAUUSD) Guide
- Gold and DXY Correlation
- Open Interest Explained
- Put/Call Ratio
- Institutional Trading Strategy
- What Is Institutional Trading?
- Liquidity Sweep Trading
- Futures Trading for Beginners
- Best Forex Pairs to Trade
- Gold correlation with DXY and bonds
- Institutional Key Levels (free indicator)
- Zeno — the premium engine