TWAP: Time-Weighted Average Price — the Formula, the Algorithm and How to Trade Around It
TWAP is the time-weighted average price: the mean of an asset's prices sampled at equal intervals over a period, with every interval weighted the same regardless of volume — which is the one difference from VWAP. As an execution algorithm, a TWAP slices a large order into equal pieces sent at equal intervals so the fills average out near that benchmark. On the chart it looks like a grind: small bodies, shallow pullbacks, flat volume, and VWAP acting as a floor until the schedule ends.
The first time I recognised a TWAP live was on ES at 15:30, when a two-hour grind that had defended VWAP eleven times simply stopped, and the market fell four points in three minutes to find out what it was worth without the buyer. This page is the formula, the algorithm and its three parameters, the comparison with VWAP and POV, the four things a TWAP does to a chart, an ETHUSDT desk execution worked slice by slice, where the algorithm fails, and a calculator that both computes a TWAP and plans a slicing schedule.
Indicators that prove themselves in public.
One engine, four precision tools — the Gold (XAU) Scalper, the institutional Gravity Zone, the Zeno momentum Oscillator, and Zeno Stocks for equities.



What is TWAP?
TWAP is the time-weighted average price: the average of an asset's prices sampled at equal intervals over a period. Take the price every minute for an hour, add the sixty numbers, divide by sixty. That is the TWAP for the hour. It weights every minute the same, whether ten contracts or ten thousand traded in it, which is exactly what separates it from VWAP, where the busy minutes count for more.
The word means two things and traders conflate them. The first is the benchmark — the number above, used to judge whether an execution was good. The second is the algorithm: an execution strategy that slices a large order into equal pieces and sends one at each interval, so that the fills average out to something close to the benchmark. A desk that "TWAPs" a 600-lot over four hours is running the algorithm; the price it reports at the end is the benchmark it was chasing.
What TWAP does not do: it does not react to the market. A pure TWAP sends the next slice at the next tick of the clock whether price has run away or collapsed, whether volume is thick or absent. That is its advantage — it is unreadable if randomised and predictable in cost if not — and its weakness, which is that it will happily buy the top of a spike because it was 10:04.
The formula, and what the intervals mean
For n prices sampled at equal intervals:
| Quantity | Formula | Note |
|---|---|---|
| TWAP over a period | (P1 + P2 + … + Pn) / n | Each Pi is the price at the end of interval i. Some platforms use the bar's typical price (H+L+C)/3 or (O+H+L+C)/4 instead of the close. |
| TWAP of an execution | Σ (fill pricei) / number of slices | Equal-sized slices, so this is the same as the simple mean of the fill prices. |
| Slices | duration ÷ interval | 240 minutes at 4-minute intervals = 60 slices. |
| Slice size | parent size ÷ slices | 600 ÷ 60 = 10 per slice. |
| Slippage vs TWAP | (execution average − benchmark TWAP) ÷ benchmark | Positive for a buyer means the algorithm paid above the market's own average — usually because the slices moved the price. |
The interval is the only real decision. A one-minute TWAP on a four-hour horizon is 240 slices and reads as a steady drip; a fifteen-minute TWAP is sixteen slices and reads as a series of pushes. Shorter intervals hide better and track the benchmark better; longer intervals cost less in fees and are more visible. Desks that do not want to be read add jitter — a random offset of a minute or two and a random size within ±20% — so that the schedule cannot be recovered from the tape.
TWAP calculator and slicing planner
In calculate mode, paste prices sampled at equal intervals and the tool returns the TWAP and where the current price sits against it. In plan mode, give it a size, a horizon and an interval and it returns the slicing schedule with the caveats a desk would attach.

Automate your trades. Let Quantum Algo trade for you.
Every signal executed on your own account — on your account, with the plan you define.
TWAP as an execution algorithm
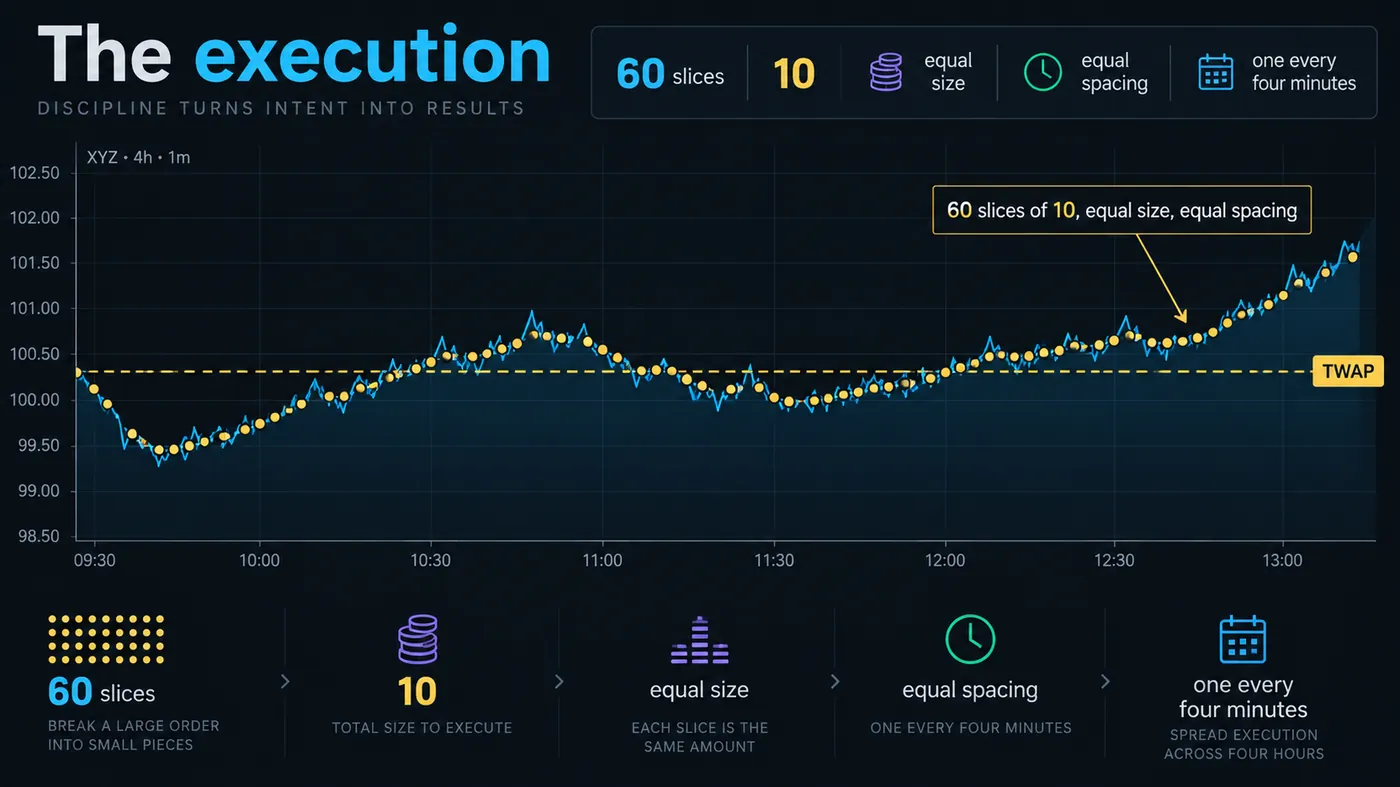
The algorithm exists because size moves price. A fund that needs to buy 600 ES contracts cannot lift the offer for 600 without paying several ticks of impact and telling every order-flow trader on the tape that a buyer is here. So it buys ten at a time, every four minutes, for four hours. Each slice is small enough to sit inside the normal flow of the market and the buyer's presence shows up only as a bias — the market grinds up on nothing in particular.
Three parameters define it: the horizon (how long), the interval (how often), and the child-order type. Market-order children guarantee completion and pay the spread sixty times; limit-order children at the bid save the spread and risk not finishing. Most implementations mix them — a limit for the first half of each interval, a market sweep if it has not filled by the end. POV and VWAP algorithms add a fourth parameter, participation in volume, which TWAP by definition ignores.
Who uses it: funds rebalancing at a set time, treasuries and corporates converting currency, crypto OTC desks working a client's order across Binance and Bybit, and increasingly retail through the TWAP order type that Binance, Bybit and OKX offer on their futures interfaces. In crypto the same idea shows up in the funding rate, which on Binance is a time-weighted average of the premium index sampled every few seconds over eight hours — a TWAP used as a benchmark rather than an execution.
TWAP versus VWAP versus POV
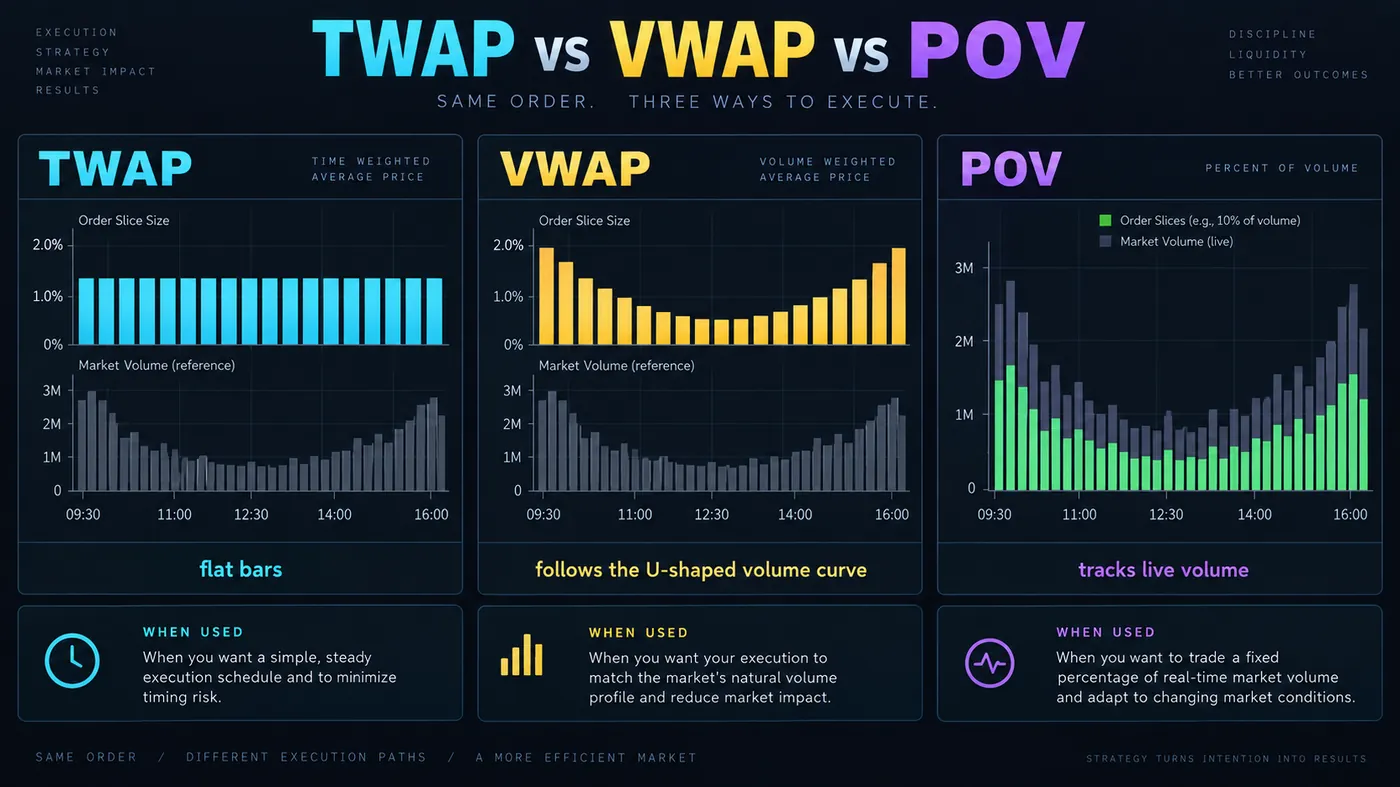
| Algorithm | Weights by | Tracks | Best when | Readable on the tape? |
|---|---|---|---|---|
| TWAP | Time — every interval equal | The time average | Volume is unpredictable, or you want a fixed schedule regardless of activity (overnight, illiquid hours, crypto weekends) | Yes, unless jittered — the regularity is the tell |
| VWAP | Volume — busy intervals get more | The volume-weighted average | Volume follows a known intraday curve (cash-session equities, index futures) | Less so — the slices scale with the crowd |
| POV | A fixed share of live volume | Nothing — it participates | You must finish and are willing to pay for it; or you want to hide inside a busy tape | Rarely — it moves with the market |
| Iceberg | Displayed size, not time | A price level | You want a price, not a schedule | Only by the reload at one level — see iceberg orders |
The rule of thumb on a desk: VWAP when you trust the volume profile of the day, TWAP when you do not, POV when you have to be done. For a trader reading the tape rather than running the algorithm, the distinction matters because each one leaves a different footprint, and TWAP's footprint is the easiest to spot.
How a TWAP looks on the chart
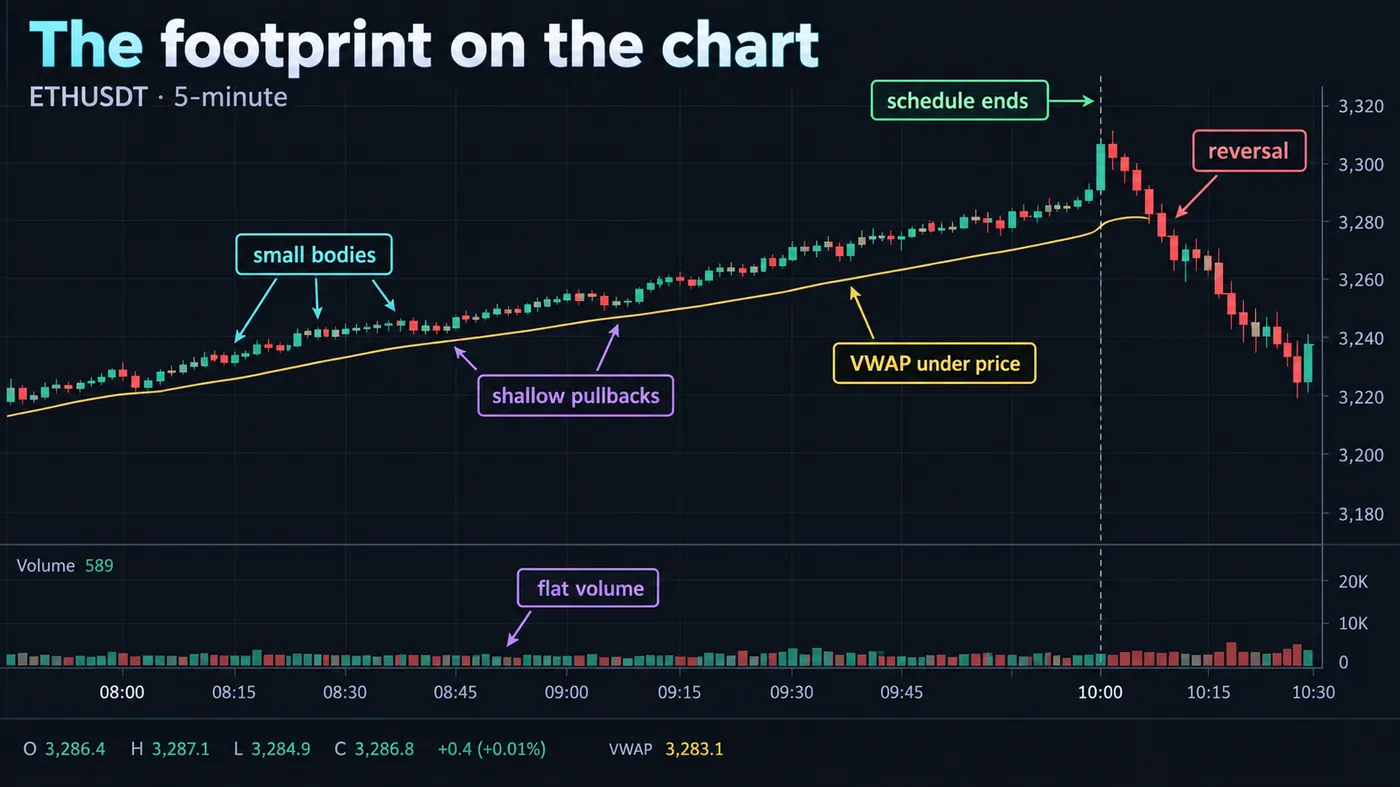
You will not see the algorithm; you will see its consequences. Four of them, in the order you notice them.
The grind. Price rises (or falls) in small bodies with shallow pullbacks that never quite reach the last swing. Every dip gets bought by the next slice, so the pullbacks are half the size they should be. On a 5-minute chart the candles are the same size for two hours.
Flat volume. No climax, no spike, no exhaustion bar. A TWAP adds the same amount every interval, so the volume histogram looks like a fence. A breakout with fence volume is usually a TWAP, not a crowd.
VWAP as a floor or ceiling. Because the buyer is a large share of every interval, the buyer's average and the market's average converge, and price rarely gets far under VWAP without the next slice arriving. A market that touches VWAP six times in a morning and bounces every time has a scheduled buyer.
Regular prints. On the footprint or time-and-sales, similar sizes at similar intervals: 10 lots at 10:04, 10 at 10:08, 10 at 10:12. Jittered TWAPs blur this, but the average spacing still shows in a histogram of trade times.
The trade around it is not to fade it. A TWAP with two hours to run will keep buying for two hours. The trade is to join it early — the first clean pullback to VWAP after the grind is identified — and to leave before it finishes, because when the schedule ends the bid disappears and the market discovers what it was worth without the buyer. Many of the sharp reversals at 11:30 or 15:30 in index futures are TWAPs ending on the hour.
Reference data
| Item | Value |
|---|---|
| Definition | Arithmetic mean of prices sampled at equal time intervals |
| Formula | (P₁ + P₂ + … + Pₙ) / n |
| Differs from VWAP by | Ignoring volume; every interval weighted equally |
| As an algorithm | Parent order ÷ (duration ÷ interval) = slice size, one slice per interval |
| Typical intervals | 1–15 minutes; jitter ±30% of the interval to hide the schedule |
| Typical horizons | 30 minutes to a full session; overnight and multi-day in crypto OTC |
| Child orders | Market (certain, pays spread), limit (cheaper, may not finish), or limit-then-market per interval |
| Where offered to retail | Binance, Bybit and OKX futures (TWAP order type); Interactive Brokers (TWAP algo); most institutional EMS platforms |
| Crypto benchmark use | Funding rates on Binance and Bybit use a time-weighted premium index over the funding interval |
| Chart footprint | Small bodies, shallow pullbacks, flat volume, VWAP acting as a floor or ceiling, regular print sizes |
Worked example: ETHUSDT, a desk working a buy over four hours
A crypto OTC desk has a client order to buy 1,200 ETH on Binance perpetuals between 08:00 and 12:00 UTC on a Thursday. The book shows about 60 ETH per level near the touch; lifting 1,200 at once would clear twenty levels and pay perhaps 0.4% of impact. The desk runs a TWAP: 60 slices of 20 ETH, one every four minutes, limit at the bid for the first two minutes of each interval and a market sweep of the remainder at the end.
Prices at 08:00, 08:04, 08:08 and so on ran from 3,412.5 to 3,423.9 across the first half hour — the eight prices pre-loaded in the calculator above — and the first eight fills averaged 3,417.8. By 10:30 ETH had ground up to 3,441 with no candle larger than 6 dollars and volume flat at around 900 ETH per 5-minute bar, of which the desk was 20 to 25. The session VWAP sat 4 to 7 dollars under price the entire time. At 11:58 the last slice filled at 3,452.2. The execution average was 3,431.6 against a benchmark TWAP of 3,430.9 for the same four hours: 0.02% slippage, which is what a well-run TWAP looks like.
At 12:00 the buyer was gone. ETH traded down to 3,429 by 12:40 — VWAP, more or less — before finding real bids. Anyone who bought the 11:50 breakout above 3,450 on "momentum" bought the last three slices of someone else's order. Anyone who bought the 12:40 touch of VWAP after the grind had ended bought the market's price, not the desk's.
Where TWAP fails
Trending markets. A buyer TWAP in a rising market buys every slice higher than the last and finishes far above where it started; the benchmark rises with it so the slippage looks fine, but the client paid more than a front-loaded execution would have. This is the argument for POV when direction is known.
Thin intervals. On a quiet tape a 20-ETH slice is the whole interval's volume, and the algorithm becomes the market. Impact per slice rises, and the footprint becomes obvious. TWAP is worst exactly where people reach for it — illiquid hours — unless the interval is stretched.
Readability. An unjittered TWAP is a schedule anyone with time-and-sales can reverse-engineer in twenty minutes. Once read, it gets front-run: the market lifts a tick ahead of each slice. The fix is jitter, and the cost of jitter is tracking error against the benchmark.
The end. A TWAP ends on the clock, not on the chart. The support it provided ends with it, often at a round time, and the reversal that follows is the single most reliable thing about the whole pattern. Traders who identify a TWAP and then hold through its end give back the trade.
Benchmark gaming. A trader paid against a TWAP benchmark can make the execution look good by trading exactly on the sample times, which is the metric and not the goal. Compare against arrival price as well.
Mistakes traders make with TWAP
- Confusing it with VWAP. TWAP ignores volume. If you are describing a "volume-weighted" average, you mean VWAP.
- Fading the grind. A scheduled buyer with time left will absorb every short entered against it. Join or wait.
- Buying the last slices. A breakout at 11:55 on flat volume after a two-hour grind is the algorithm finishing, not a crowd arriving.
- Running an unjittered TWAP yourself. Retail-sized TWAPs on Binance and Bybit are small enough not to matter, but on an illiquid altcoin the schedule is readable and will be traded against.
- Using a TWAP benchmark for an execution that had a directional view. If you expected price to rise, arrival price is the honest yardstick.
- Treating the TWAP line as support. It is not a level; it is an average. It holds because someone is defending it, and stops holding when they finish.
TWAP and the free indicators
There is no TWAP script in the library because a TWAP line is a simple moving average of the close by another name — TradingView's built-in SMA on a 5-minute chart with length 48 is a four-hour TWAP. The useful scripts are the ones that show the footprint: the Anchored VWAP Engine for the floor the algorithm builds, and the Pressure Oscillator for the steady one-sided volume pressure that a slicing buyer produces without a spike. The premium engine, Zeno, gives buy and sell signals with a stop and targets; on a grind day the signals fire in the direction of the schedule and the reversal signal tends to print after the top-of-the-hour end.
TWAP is the time average, and the algorithm that chases it by slicing an order evenly across the clock. It ignores volume, which makes it unreadable when jittered and predictable in cost when not. Its footprint is a grind with flat volume and a defended VWAP; join early, leave before the schedule ends, and never fade a buyer with time left. Use VWAP when you trust the day's volume curve, TWAP when you do not, POV when you must finish.
◆ Interactive check
Do you know the difference?
Questions traders ask about TWAP
Time-weighted average price — the mean of prices sampled at equal intervals over a period. Sample every minute for an hour, add the sixty prices, divide by sixty. Each interval counts the same whatever its volume.
VWAP weights each interval by its volume, so busy minutes pull the average more; TWAP weights every interval equally. On a normal cash-session day the two sit close together; they diverge when volume is lumpy — around news, at the open and close, and on crypto weekends — which is when the choice between them matters.
It divides a parent order into equal child orders and sends one at each interval across a chosen horizon: 600 contracts over four hours at four-minute intervals is 60 orders of 10. Children can be market orders (certain, pay the spread) or limit orders (cheaper, may not fill), and good implementations randomise the interval and size slightly so the schedule cannot be read.
It is an execution strategy, not a directional one — it decides how to fill an order, not whether to. For a trader it is more useful as something to recognise on the tape than something to run: a TWAP buyer produces a grind you can join early and should leave before the schedule ends.
Small-bodied candles grinding in one direction with pullbacks that never reach the last swing, a volume histogram with no spikes, VWAP acting as a floor (buyer) or ceiling (seller) the whole time, and on time-and-sales similar sizes at similar intervals. The reversal when it ends, often at a round time, is the confirmation.
An order type on their futures interfaces that runs the algorithm for you: you set the total size and the duration, and the exchange sends equal slices at regular intervals, optionally with a price limit. It is meant for sizes that would otherwise walk the book; on a liquid pair a retail-sized TWAP is invisible.
Because a time-weighted premium index over the funding interval cannot be pushed by one large trade at the settlement time. Binance samples the premium index every few seconds across eight hours and averages; a single spike at 15:59 UTC barely moves it.
VWAP when the day's volume follows a shape you trust — cash-session equities and index futures — because the algorithm hides inside the crowd. TWAP when you do not trust the volume curve or you need a fixed schedule: overnight, illiquid hours, crypto weekends, or an order that has to finish by a set time regardless of activity.
Not while it is running — a scheduled buyer with time left absorbs every short. The trades are joining it on the first pullback to VWAP after you have identified it, and fading the market when the schedule ends and the bid disappears.
No, because a TWAP line is a simple moving average of the close under another name. The Anchored VWAP Engine shows the floor a TWAP buyer builds, and the Pressure Oscillator shows the steady one-sided pressure without a volume spike. Zeno, the premium engine, gives signals with stops and targets and does not label execution algorithms.
References & Related Guides
Read next
- VWAP: Complete Guide
- POV Trading Algorithm
- Best VWAP Settings
- Iceberg Orders
- Order Flow Trading
- What Is Institutional Trading?
- What Is Slippage in Trading?
- Funding Rate Trading
- Cumulative Volume Delta (CVD)
- Anchored VWAP Engine (free indicator)
- Institutional Order Flow — glossary
- Zeno — the premium engine
Primary sources
- Interactive Brokers Campus: what is TWAP (the benchmark and the algo)
- Hummingbot: TWAP executor documentation (an open-source implementation with its parameters)
- TradingView: Anchored TWAP open-source script
- Binance: futures funding rate methodology (time-weighted premium index)
- CME Group: trading hours (session boundaries where schedules end)