Gann Square of 9: How It Works, How to Calculate the Levels, Gann Angles and the Limits
The Gann Square of 9 is a number spiral with 1 at the centre that turns a price into support and resistance levels. Take the square root of a pivot price, add or subtract 0.25 per 45° (2 per full turn) and square it. It is popular for Nifty intraday levels; no tested evidence shows it predicts.
Few trading tools have a reputation like W.D. Gann's. The Square of 9 promises that a single number — a swing low, yesterday's close — contains the support and resistance levels of the days ahead, and on Indian index charts it is everywhere. The arithmetic behind it is simple and worth knowing: square roots, quarter-turn increments, squared back. What deserves more scrutiny is the claim that it predicts anything. This guide covers who Gann was and what he actually wrote, how the number spiral is built, how to calculate levels with worked examples from 100 and from a 22,500 Nifty low, how traders use the levels on Nifty and Bank Nifty, Gann angles and the Gann fan with their scaling problem, what the evidence says, a worked two-day example that shows both the hits and the misses, the common mistakes, and a calculator.
Indicators that prove themselves in public.
One engine, four precision tools — the Gold (XAU) Scalper, the institutional Gravity Zone, the Zeno momentum Oscillator, and Zeno Stocks for equities.



What is the Gann Square of 9?
The Square of 9 is a square spiral of numbers — 1 in the centre, then 2, 3, 4 and onward in rings around it — that traders use to turn a price into a set of support and resistance levels. It is attributed to W.D. Gann (William Delbert Gann, 1878–1955), a trader and writer from Lufkin, Texas, who moved to New York in 1903, set up his own firm in 1908 and published books including Truth of the Stock Tape (1923), Wall Street Stock Selector (1930), How to Make Profits in Commodities (1941, revised 1951) and 45 Years in Wall Street (1949). His methods mix geometry, numbers and time cycles, and the Square of 9 is the best known of his price tools.
Two facts frame everything that follows. Gann wrote very little about the Square of 9 itself — it appears in his course material as a calculator chart, and the square-root method most traders use today is a later reconstruction by practitioners, not something Gann spelled out. And his trading record is disputed: a 1909 magazine interview credited him with 264 winning trades out of 286 in one month, while later accounts, including from his son, said he earned his living mainly by selling courses. The Square of 9 is worth understanding as a level-generating tool, not as a proven secret.
How is the Square of 9 built?
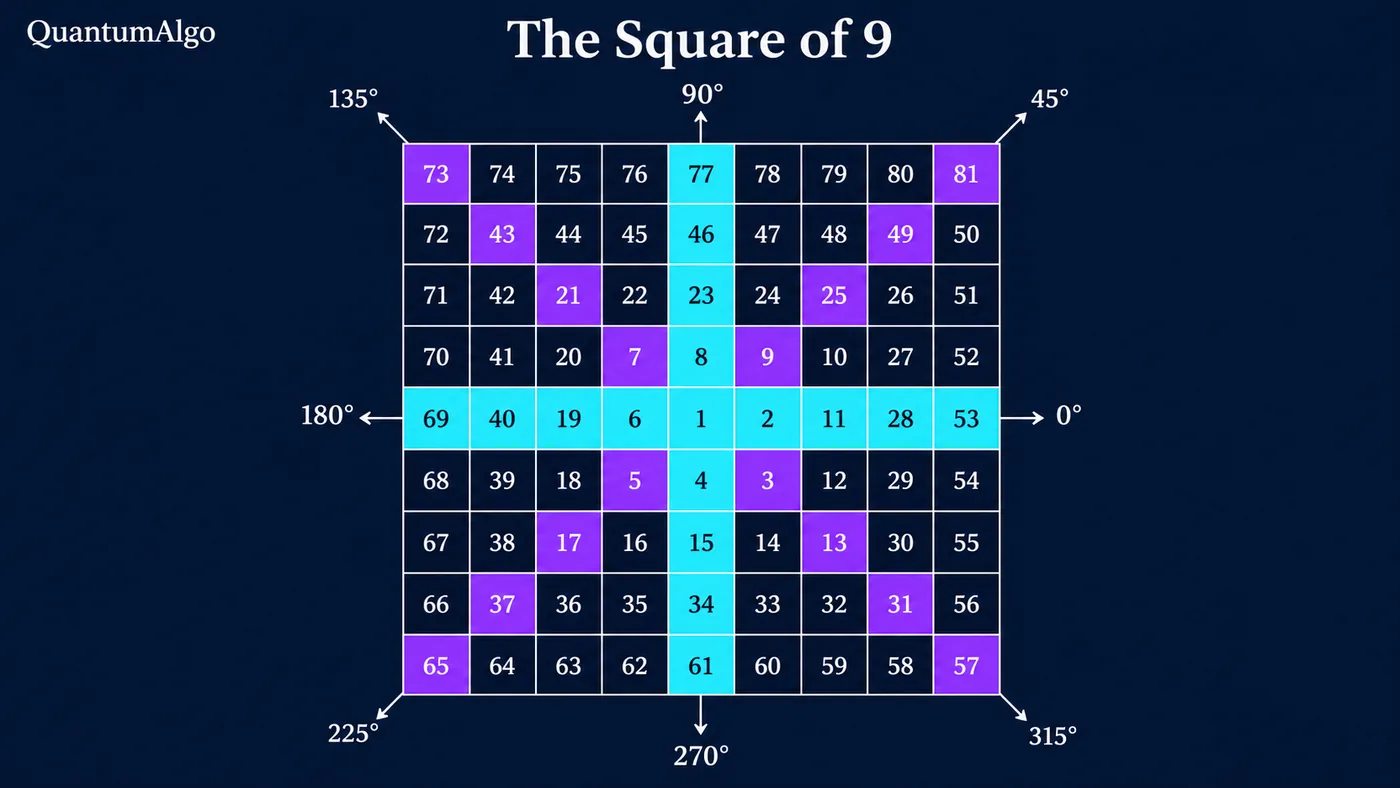
Start with 1 in the centre and write the numbers in a spiral: 2 to 9 make the first ring, 10 to 25 the second, 26 to 49 the third and 50 to 81 the fourth, which gives the 9 × 9 square. The odd squares — 9, 25, 49, 81 — fall on one diagonal, which is a quick way to check a chart is drawn correctly. Every full ring is one 360° turn, and the key property is that one full turn adds exactly 2 to the square root of the numbers on it: √9 = 3, √25 = 5, √49 = 7, √81 = 9.
Because of that, any number on the square can be described by an angle. The cardinal cross — the row and column through the centre (0°, 90°, 180°, 270°) — and the diagonal cross (45°, 135°, 225°, 315°) are where practitioners look for levels, and most treat the cardinal cross as the stronger of the two. Charts differ on whether the spiral runs clockwise or counter-clockwise and where 0° sits; the arithmetic below is the same either way.
How do you calculate Square of 9 levels?
| Angle | Add to (or subtract from) the square root | From 100 | From 22,500 |
|---|---|---|---|
| 45° | 0.25 | 105.06 / 95.06 | 22,575 / 22,425 |
| 90° | 0.5 | 110.25 / 90.25 | 22,650 / 22,350 |
| 180° | 1 | 121 / 81 | 22,801 / 22,201 |
| 270° | 1.5 | 132.25 / 72.25 | 22,952 / 22,052 |
| 360° (one full turn) | 2 | 144 / 64 | 23,104 / 21,904 |
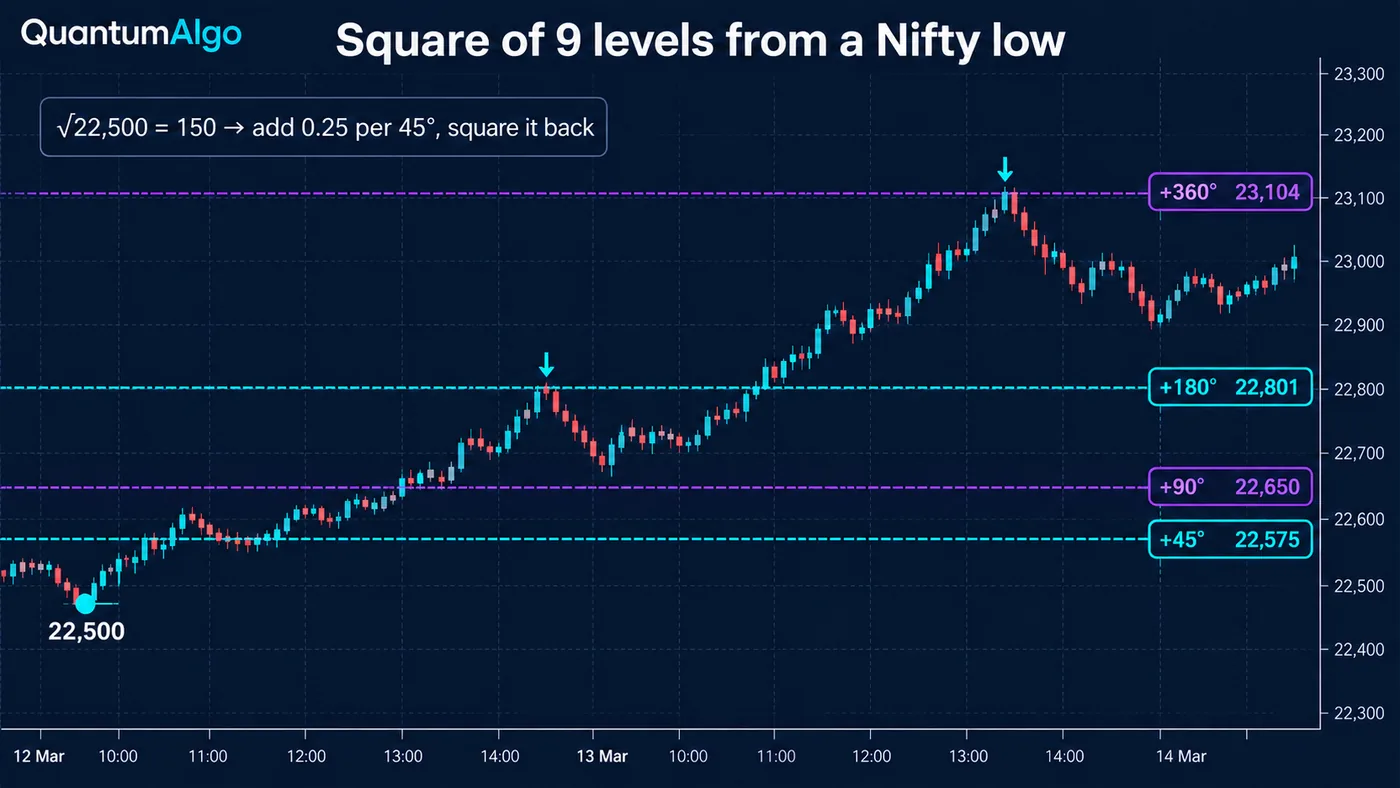
The method practitioners use is three steps: take the square root of a significant price, add or subtract an increment for the angle you want, and square the result. As a formula, level = (√price ± degrees ÷ 180)². From 100, the square root is 10; one full turn up gives 12² = 144 and one turn down gives 8² = 64 — both perfect squares, which is a useful sanity check. From a Nifty swing low of 22,500, the square root is 150, so the 45° level above is 150.25² = 22,575, the 90° level 150.5² = 22,650, the 180° level 151² = 22,801 and the full turn 152² = 23,104.
One property of the method is rarely mentioned: because the increments are fixed, the levels get closer together in percentage terms as the price gets larger. A full turn from 100 is a 44% move; from 25,000 it is about 2.5%. That is why the Square of 9 produces usable intraday levels on an index in the tens of thousands, and why practitioners rescale small prices before using it — a EURUSD price of 1.0850 is treated as 10,850, for example. The choice of scale changes the levels, which is one of the reasons two practitioners can get different answers from the same chart.

Automate your trades. Let Quantum Algo trade for you.
Every signal executed on your own account — on your account, with the plan you define.
How do traders use Square of 9 levels on Nifty and Bank Nifty?
- Choose the anchor. A significant swing high or low, the day's open or the previous close. The anchor decides every level, so pick it before the session and do not change it to fit the chart.
- Calculate the levels. At least 45°, 90° and 180° above and below; add 360° for wider moves.
- Treat them as zones. On Nifty, a few points either side of the level.
- Wait for a reaction. A rejection candle, a failed break or a break-and-retest at the level — not the touch itself.
- Look for agreement. Levels that line up with the CPR, classic pivot points, the previous day's high or low or a round number carry more weight.
- Use the next level as the target and the previous one as the stop. A long from the 90° level aims for 180° with a stop beyond 45°.
The Square of 9 is especially popular for Indian index trading: Indian research and broker sites publish Square of 9 levels and tutorials for Nifty, and there are many free calculators. That popularity has a side effect worth being honest about — when many traders watch the same levels, especially ones near round numbers, some reactions may come from the crowd rather than the geometry. For the session context on Nifty, the UT Bot settings for Nifty and Bank Nifty and the opening range breakout guide pair naturally with any level method.
What are Gann angles and the Gann fan?
| Angle | Price units per time unit | Conventional degrees |
|---|---|---|
| 1×8 | 8 per bar | 82.5° |
| 1×4 | 4 per bar | 75° |
| 1×3 | 3 per bar | 71.25° |
| 1×2 | 2 per bar | 63.75° |
| 1×1 | 1 per bar | 45° |
| 2×1 | 1 per 2 bars | 26.25° |
| 3×1 | 1 per 3 bars | 18.75° |
| 4×1 | 1 per 4 bars | 15° |
| 8×1 | 1 per 8 bars | 7.5° |
Gann angles are trend lines drawn from a significant high or low at fixed rates of price per unit of time; the 1×1 line rises one price unit per bar and is the one Gann treated as the balance between price and time. A Gann fan draws the whole set from one pivot. The degree labels above are conventions used by platforms such as MetaTrader — the true slopes differ (a 2-to-1 line is about 63.4°, not 63.75°) — and platforms even disagree on naming: TradingView calls the steep line rising two points per bar "2×1", while MetaTrader and many books call that line "1×2". Check your platform's definition before reading anyone else's chart.
The deeper problem is scaling. An angle only means something once you decide how many price units equal one time unit — one Nifty point per 5-minute bar, ten points, or something else. Gann left no rule for that, so the same fan can be steep or flat depending on the choice, and critics call angle placement arbitrary for exactly that reason. On TradingView, the Gann tools sit in the "Fibonacci and Gann" drawing group: Gann box, Gann square fixed, Gann square and Gann fan. TradingView's Gann square is based on the Gann wheel and is not labelled Square of 9; most traders use a calculator for the Square of 9 and the fan tool for angles.
Does the Square of 9 work?
There is no peer-reviewed, out-of-sample test of Square of 9 price levels that we could find. The research that exists is thin and mostly about other parts of Gann's work. A 2021 paper in Mathematics found that most turning points in Chinese stock indices fell within four days of the 24 traditional solar terms — but with a turning point allowed four days either side of 24 dates a year, a large share of all trading days falls inside the window by chance, so the result is weaker than it sounds and says nothing about price levels. A 2011 master's thesis that tested Gann swing rules on UK stocks found mixed results, with one entry rule losing money and another making it, in-sample only.
The criticisms are consistent. The anchor and the scaling are discretionary, so published levels differ between practitioners. The method generates many levels — eight per ring in each direction — so it is easy to find hits after the fact. There is no accepted market mechanism for why the square root of a price should matter. And because the rules are subjective, meaningful backtesting is difficult. None of that means a level cannot be useful as a reference; it means the Square of 9 should be judged like any level tool — by whether price confirms it — rather than trusted because of its history.
Square of 9 calculator
Enter a pivot price — a swing high or low, the open or the previous close — and choose a scale for small-priced instruments. The calculator returns the Square of 9 levels above and below at every 45° (or only 45°, 90°, 180° and 360°), and how large one full turn is in percentage terms at that price.
Reference data
| Item | Value |
|---|---|
| Attributed to | W.D. Gann (1878–1955); the square-root method is a later practitioner reconstruction |
| Structure | Number spiral from 1 in the centre; each ring = one 360° turn = +2 on the square root |
| Level formula | (√price ± degrees ÷ 180)²; 45° = 0.25, 90° = 0.5, 180° = 1, 360° = 2 |
| Strongest levels (by convention) | Cardinal cross (0°, 90°, 180°, 270°), then the diagonal cross |
| Small prices | Rescale first (e.g. × 10,000 for forex); the scale changes the levels |
| Gann angles | 1×1 = one price unit per time unit; requires a chosen price-to-time scale |
| On TradingView | Gann box, Gann square fixed, Gann square, Gann fan (Fibonacci and Gann tools) |
| Evidence | No peer-reviewed out-of-sample test of Square of 9 price levels found |
| Checked | October 2026 |
Worked example: Square of 9 levels from a Nifty swing low
An illustrative two-day move. Nifty makes a swing low at 22,500 on the morning of day one. The square root is 150, so the levels above are 22,575 (45°), 22,650 (90°), 22,725 (135°), 22,801 (180°) and 23,104 (360°). Price grinds higher through 22,575 and 22,650, then stalls in the afternoon at 22,801 — the 180° level — and prints a bearish rejection candle on the 15-minute chart. The next morning it pulls back to 22,650, the 90° level, holds it and forms a higher low.
A trader working the method would ignore the touch of 22,801 as an entry signal on its own, but treat the pullback to 22,650 as the opportunity: a long on the higher low with a stop below the 45° level at 22,575, about 75 points of risk, and a first target back at 22,801. Price breaks through 22,801 on the second day and runs to 23,104, the full turn, where it reverses. The levels look impressive on the finished chart. The honest test is the one the example also shows: price passed through 22,575, 22,650 and 22,725 on day one without reacting, and a trader shorting every level would have lost on most of them. Levels tell you where to pay attention; the reaction tells you what to do.
What mistakes do traders make with Gann methods?
- Changing the anchor until the levels fit the chart. Pick it before the session.
- Trading every level. Eight levels per turn in each direction means most will be passed through.
- Treating levels as exact prices instead of zones.
- Using the Square of 9 on small prices without deciding a scale — and then comparing levels with someone who chose a different one.
- Drawing Gann angles without fixing the price-to-time scale, so the "1×1" changes with the zoom level.
- Believing the history. Gann's methods are interesting; his claimed record is unverified.
- Ignoring confirmation from price, volume and structure.
How does the Square of 9 fit with structure and the free indicators?
The Square of 9 produces levels; the chart has to supply the decision. Institutional Key Levels plots the previous day's and week's highs and lows, and a Square of 9 level that lines up with one of them carries more weight; the Smart Money Concepts Engine prints the break of structure or change of character that turns a touch into a trade; and Liquidity Sweeps shows when price runs a level and snaps back. Zeno, the premium engine, prints buy and sell signals with a built-in stop and targets; a signal that fires at a Square of 9 level which also agrees with the CPR bias is the kind of confluence the method is best used for. For other level frameworks, see pivot points and Fibonacci retracement.
The Square of 9 turns a price into levels by rotating its square root: add or subtract 0.25 per 45°, square it back. The method is mechanical and easy to calculate; the anchor and the scale are choices, the levels are many, and there is no tested evidence they predict. Fix the anchor before the session, treat levels as zones, act only on a reaction, and give the most weight to levels that agree with the pivots, the CPR and market structure.
◆ Interactive check
Do you understand the Square of 9?
Questions traders ask about the Gann Square of 9
A square spiral of numbers with 1 at the centre, attributed to W.D. Gann, used to convert a significant price into support and resistance levels at angles of rotation — 45°, 90°, 180°, 360° and so on.
Take the square root of a pivot price, add or subtract 0.25 for each 45° (0.5 for 90°, 1 for 180°, 2 for 360°), then square the result. As a formula: (√price ± degrees ÷ 180)².
Choose an anchor before the session — a swing high or low, the open or the previous close — calculate the 45°, 90° and 180° levels above and below, treat them as zones, and act only when price reacts at a level, ideally where it agrees with the CPR, pivots or the previous day's range.
By convention, levels on the cardinal cross (0°, 90°, 180°, 270°) are treated as stronger than those on the diagonal cross (45°, 135°, 225°, 315°). This is practitioner convention, not tested evidence.
Gann wrote very little about the Square of 9. The square-root calculation most traders use is a later reconstruction by practitioners of how the chart works.
Trend lines drawn from a significant high or low at fixed rates of price per unit of time. The 1×1 line moves one price unit per time unit; others such as 1×2 and 2×1 are twice as steep or half as steep. They depend on a chosen price-to-time scale.
A set of Gann angles drawn from one pivot — typically 1×8 through 8×1 — used to read whether a trend is moving faster or slower than its balance line. TradingView and MetaTrader both include a Gann fan tool.
There is no peer-reviewed, out-of-sample evidence that Square of 9 levels predict price. Some reactions may come from the levels coinciding with round numbers, pivots or crowd attention. Use the levels as references that price must confirm.
Yes, but small prices must be rescaled first — a EURUSD price of 1.0850 is usually treated as 10,850 — and the choice of scale changes the levels. Crypto prices in the thousands can be used as they are.
Gann levels work as reference zones on TradingView alongside the free key-level, liquidity and structure indicators. Zeno prints its own buy and sell signals with a stop and targets, and a Square of 9 level that agrees with structure is a useful confluence.
References & Related Guides
Read next
- CPR Indicator
- Pivot Points Guide
- Fibonacci Retracement
- UT Bot Settings for Nifty & Bank Nifty
- Opening Range Breakout (ORB)
- Support and Resistance
- Elliott Wave Theory
- Harmonic Patterns
- Trendline Trading
- Golden Pocket Trading
- Institutional Key Levels (free indicator)
- Zeno — the premium engine