Murrey Math Lines: How the Indicator Works and How to Trade It
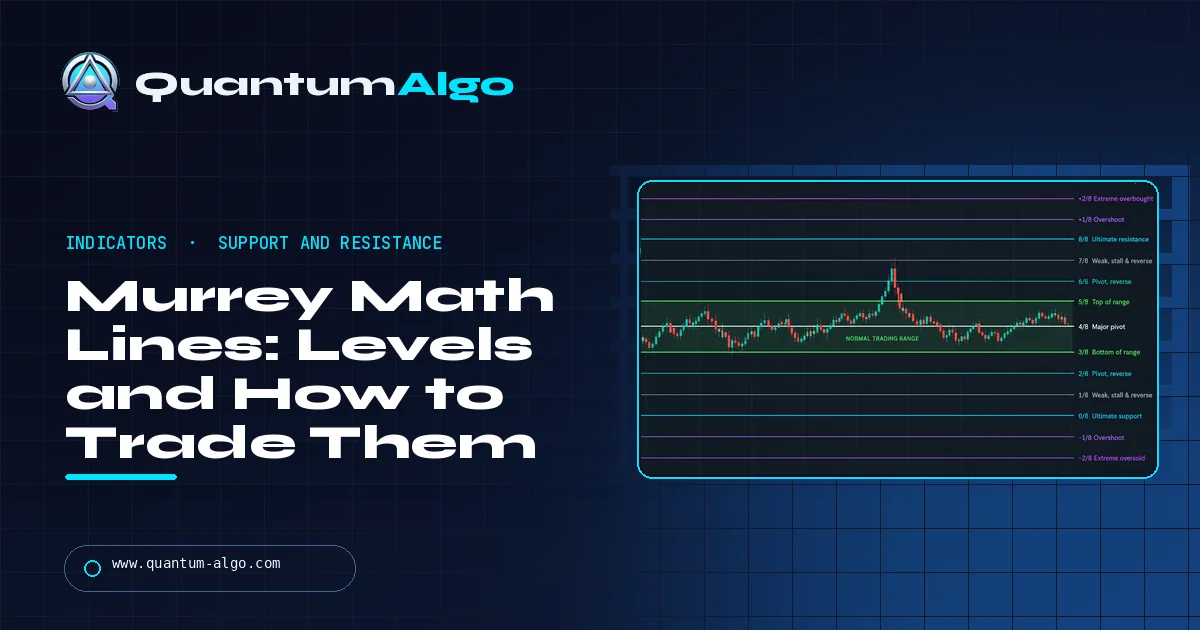
Murrey Math Lines divide price into eighths, an idea taken from W.D. Gann and simplified by T. Henning Murrey in the 1990s. The indicator draws nine main levels, from 0/8 to 8/8, plus overshoot lines at ±1/8 and ±2/8, on a frame that snaps to clean price fractions. Each level has a role: 8/8 and 0/8 are the strongest resistance and support, 4/8 is the main pivot, 3/8 and 5/8 bound the normal trading range, 2/8 and 6/8 are pivot reversal points, and 1/8 and 7/8 are weak levels where fast moves stall. Traders use the lines for mean reversion inside the range, breakouts beyond it and placing stops and targets.
Murrey Math Lines look like a grid of horizontal lines, but every line has a job. The system takes Gann's idea that markets move in eighths, fixes the grid to round price fractions so different traders see the same levels, and gives each level a simple meaning. This guide explains how the levels are calculated, what each one is supposed to do, the strategies traders use with them, where the method breaks down and how to set it up on TradingView. A calculator below gives you the full set of levels for any high and low.
Indicators that prove themselves in public.
One engine, four precision tools — the Gold (XAU) Scalper, the institutional Gravity Zone, the Zeno momentum Oscillator, and Zeno Stocks for equities.
What are Murrey Math Lines?
Murrey Math Lines are a set of horizontal support and resistance levels that divide price into eighths. They were developed in the 1990s by T. Henning Murrey, who wanted to make the price geometry of W.D. Gann usable without Gann's complicated angles and squares. His book, The Murrey Math Trading System, set out the idea that all markets, whatever the asset or timeframe, move in the same proportions.
The indicator draws a frame, called an octave, around recent price and splits it into eight equal parts. The lines are labelled 0/8 to 8/8, with extra overshoot lines at −1/8, −2/8, +1/8 and +2/8. What makes the system distinctive is that each line has a defined role, and that the frame snaps to clean fractions of price, so two traders looking at the same market usually see the same grid.
Murrey Math is part of the same family as Gann's Square of 9 and pivot points: rule-based levels that are drawn before price gets there, rather than lines traders fit by eye afterwards.
What does each Murrey Math level mean?
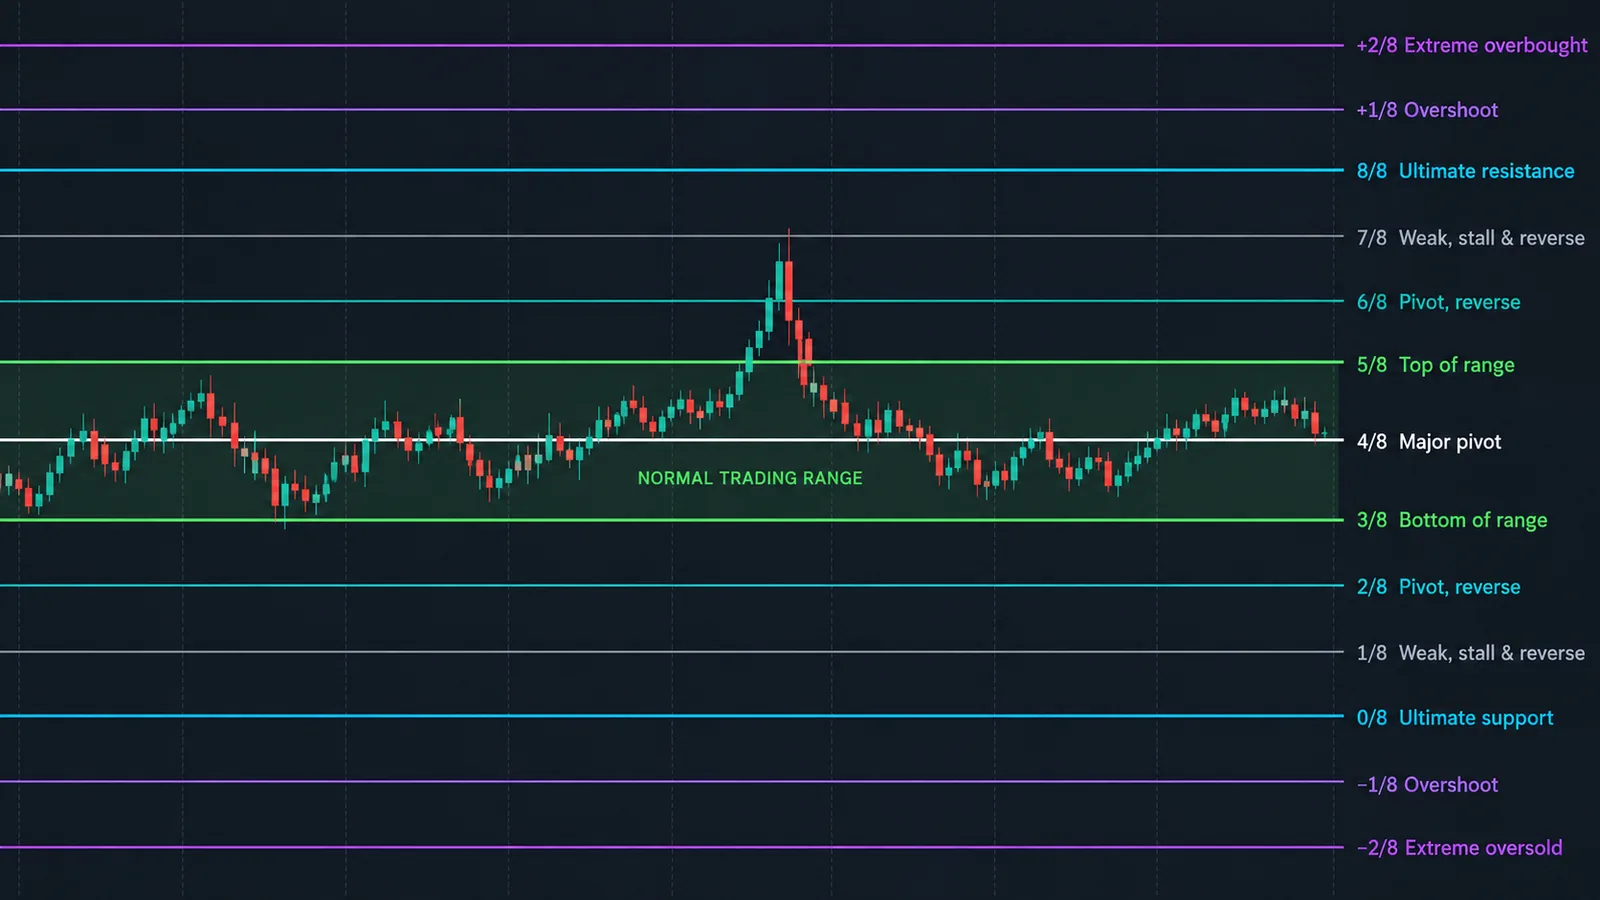
Murrey gave every line a job. The table is the standard interpretation used in his book and in most platform versions of the indicator.
| Level | Name | What it means |
|---|---|---|
| +2/8 | Extreme overshoot | Strongest overbought level; price above it usually forces the frame to shift up |
| +1/8 | Overshoot | Overbought; a common spot for stops on shorts taken at 8/8 |
| 8/8 | Ultimate resistance | The hardest level to break; a frequent reversal point |
| 7/8 | Weak, stall and reverse | Fast rallies often stall here; if it breaks, 8/8 is the next stop |
| 6/8 | Pivot, reverse | One of the two levels where most reversals start, after 4/8 |
| 5/8 | Top of trading range | Upper edge of the zone where price spends most of its time |
| 4/8 | Major support and resistance | The pivot of the whole grid: above it price is strong, below it weak |
| 3/8 | Bottom of trading range | Lower edge of the normal range |
| 2/8 | Pivot, reverse | Mirror of 6/8: a frequent reversal level |
| 1/8 | Weak, stall and reverse | Fast declines often stall here; if it breaks, 0/8 is next |
| 0/8 | Ultimate support | The hardest level to break on the downside |
| −1/8 | Overshoot | Oversold |
| −2/8 | Extreme overshoot | Strongest oversold level; price below it usually forces the frame to shift down |
A useful way to read the grid is in zones. Between 3/8 and 5/8 is the trading range, where price drifts most of the time. 6/8 and 2/8 are where moves out of that range often reverse. 7/8 and 1/8 are speed bumps, and 8/8 and 0/8 are walls. The overshoot lines show how far a move has gone beyond the frame.
How are Murrey Math Lines calculated?
The calculation has three steps.
- Take a frame. Find the highest high and lowest low over a lookback. Murrey used multiples of 8 bars; 64 bars is the most common setting, with 32, 128 or 256 used for shorter or longer views.
- Snap to an octave. Rather than using the raw high and low, the indicator finds a "fractal" scale based on the price level (for example 100 for prices between 25 and 250, 1,000 for prices between 250 and 2,500), then repeatedly halves it until the octave just contains the price range. The bottom of the octave is rounded down to a multiple of that size. This is why the levels land on clean numbers.
- Divide by eight. The octave is refined to the half or quarter that best fits the frame, then split into eight equal steps. Two more steps are added above and below for the overshoot lines, giving 13 lines in total.
A worked example: gold trading between 2,540 and 2,685 over the last 64 bars. The scale for prices between 2,500 and 25,000 is 10,000, which halves down to an octave of 156.25. The octave starts at 2,500, and the algorithm fits the frame from 2,500 (0/8) to 2,656.25 (8/8), so each eighth is 19.53. That puts 4/8 at 2,578.13, 3/8 at 2,558.59 and 5/8 at 2,597.66. The recent high of 2,685 sits above 8/8, between +1/8 (2,675.78) and +2/8 (2,695.31): the market is in overshoot territory, and a further rise would shift the frame. The calculator below does the full calculation for any market.
Because the frame snaps to fixed fractions, the lines can jump when a new high or low moves the octave. That is normal behaviour, not a bug, but it means levels should be checked again after big moves.
Murrey Math Lines calculator
Enter the highest high and lowest low of your frame (the last 64 bars is a good default) and the current price. The calculator applies the standard Murrey Math algorithm, lists all 13 levels with their roles, highlights the level closest to price and tells you which zone price is in.
How do you trade Murrey Math Lines?
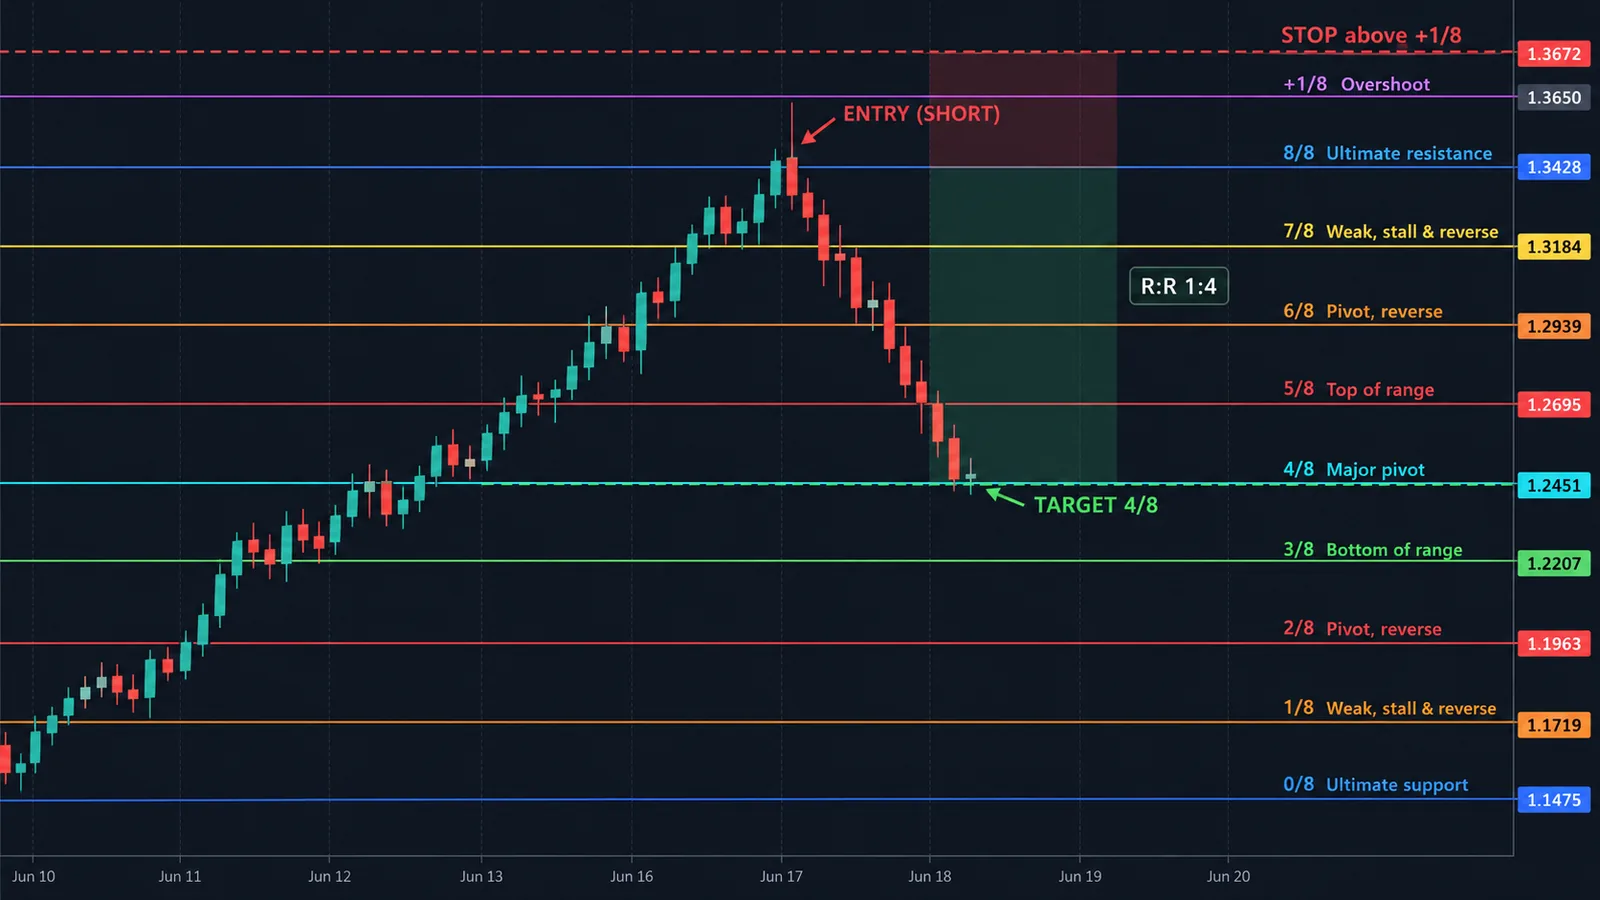
There are three common ways to use the grid.
1. Mean reversion inside the range
When the market is ranging, fade the extremes back toward the middle. Short a rejection at 8/8 or 7/8 with a stop above +1/8 and a target at 4/8; buy a rejection at 0/8 or 1/8 with a stop below −1/8 and a target at 4/8. Confirm the rejection with a candle pattern or a momentum reading such as RSI turning from overbought or oversold. This is the classic Murrey use, and it works best when the frame has been stable for a while.
2. The 4/8 pivot as a trend filter
Only take long setups while price holds above 4/8 and short setups while it holds below. A clean break and retest of 4/8 is one of the most watched signals in the system: price that reclaims 4/8 often travels to 5/8 or 6/8, and price that loses it often travels to 3/8 or 2/8.
3. Breakouts beyond the frame
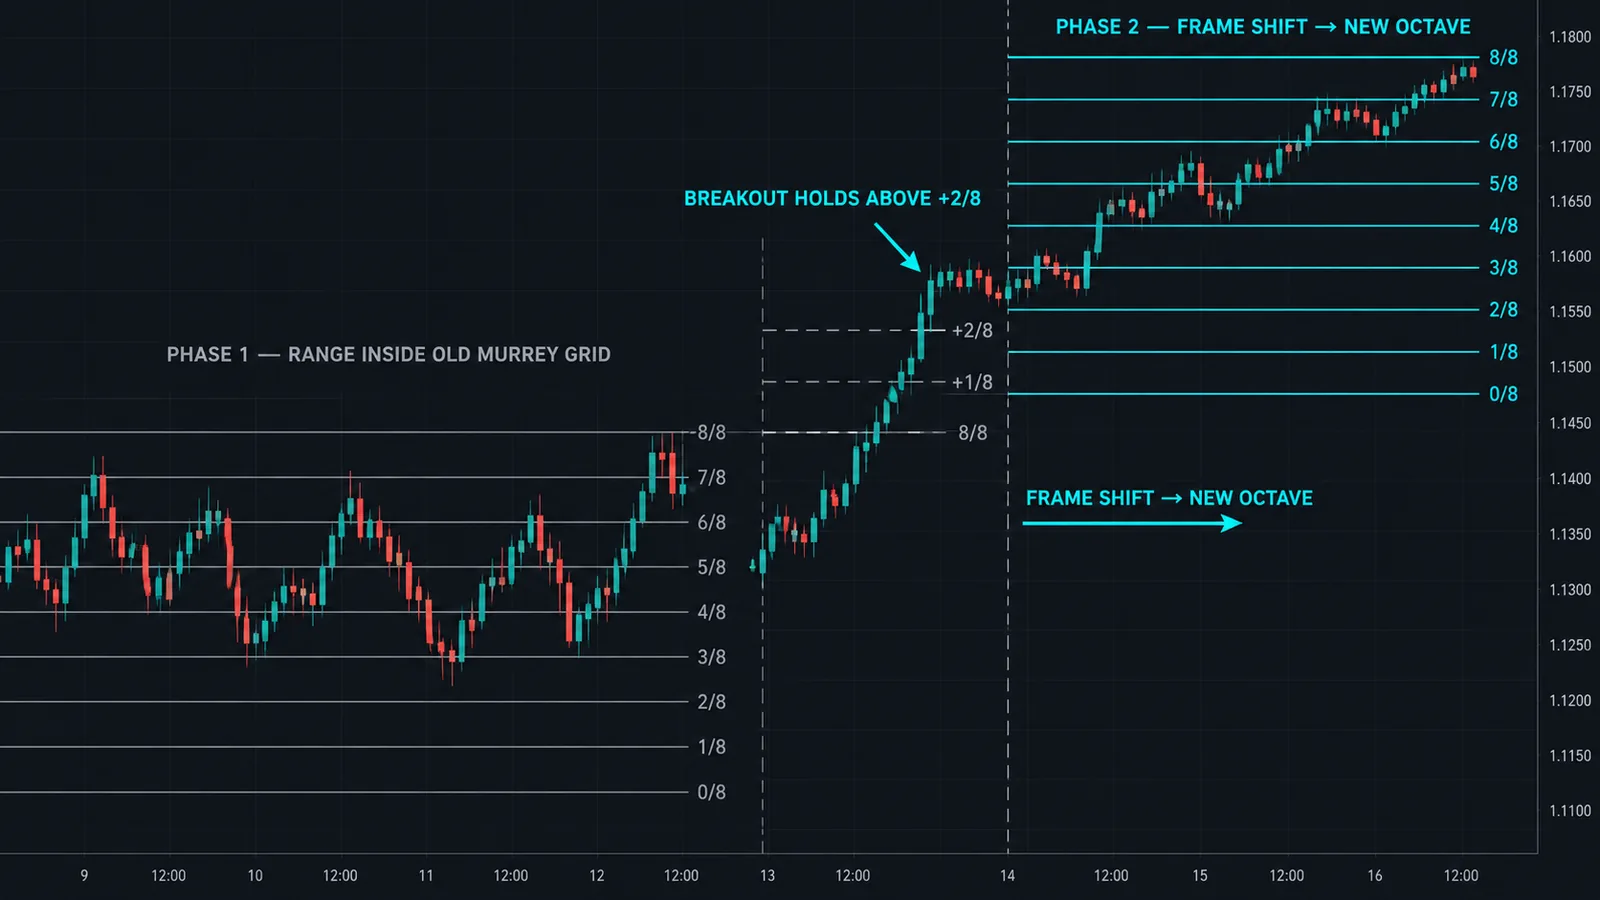
When price closes beyond 8/8 or 0/8 and holds the +1/8 or −1/8 line, the frame is likely to shift and a new octave will be drawn. Breakout traders enter on the retest of the broken 8/8 or 0/8 line and target +2/8 or the next octave. See the breakout trading guide for how to tell real breakouts from failed ones.
In every case, the lines give natural places for stops and targets, which makes it easy to calculate reward to risk before entering. A short at 8/8 with a stop at +1/8 and a target at 4/8 risks one eighth to make four.
Murrey Math on different markets and timeframes
Murrey claimed his levels work on every market and timeframe, and in practice the indicator is used widely in forex, gold, indices and crypto. A few practical points:
- Forex: the levels often line up with round numbers, which already act as support and resistance. That overlap is part of why traders find them useful.
- Crypto: volatility is high, so price spends more time at overshoot lines and frames shift more often. A longer frame (128 or 256 bars) gives steadier levels.
- Indices and gold: 4/8 and the 3/8 to 5/8 range are especially useful for intraday mean reversion on 15-minute and 1-hour charts.
- Multiple timeframes: the strongest levels are those where a daily Murrey line sits close to a 4-hour or 1-hour line. Check the higher timeframe first.
As with any level-based method, the reaction at a line matters more than the line itself. A level that price slices through without a pause has told you something about the strength of the move.
What are the limitations of Murrey Math Lines?
- Levels move. When the frame shifts, the whole grid redraws. A level you planned around yesterday may not exist today, which also makes historical backtests on repainted lines look better than live trading.
- No direction. The lines show where price may react, not which way it will break. Without a trend filter, traders fade strong trends at 7/8 and 8/8 and get run over.
- Settings matter. Different lookbacks (32, 64, 128 bars) and different platform versions produce different grids. Use one setting consistently.
- The theory is not proven. Murrey's claim that all markets move in eighths is a belief inherited from Gann, not a tested law. The levels work partly because they overlap with round numbers and partly because many traders watch them.
- Clutter. Thirteen lines on a chart, plus other tools, can make every price look like a level. Focus on 0/8, 4/8 and 8/8 and treat the others as secondary.
Used as a map of likely reaction zones and combined with structure and momentum, Murrey Math is a practical tool. Used as a prediction machine, it disappoints.
Murrey Math vs pivot points, Fibonacci and Gann
| Tool | How levels are set | Levels | Best for |
|---|---|---|---|
| Murrey Math Lines | Frame high and low snapped to fractions, split into eighths | 13 (−2/8 to +2/8) | Ranges, mean reversion, a clear pivot at 4/8 |
| Pivot points | Previous period's high, low and close | Usually 7 (P, S1 to S3, R1 to R3) | Intraday levels everyone sees |
| Fibonacci retracement | A swing high and low chosen by the trader | 23.6%, 38.2%, 50%, 61.8%, 78.6% | Pullbacks within trends |
| Gann Square of 9 | Square roots and angles around a spiral of numbers | Many | Time and price projections |
The 4/8 line sits at the 50% point of the frame, the same place as the 50% Fibonacci level, and 3/8 and 5/8 (37.5% and 62.5%) are close to 38.2% and 61.8%. When Murrey and Fibonacci levels from the same swing overlap, many traders treat the zone as stronger. The difference is objectivity: Murrey's frame is set by rules, while Fibonacci depends on which swing you pick.
How to add Murrey Math Lines on TradingView and MT5
On TradingView, open Indicators and search for "Murrey Math". Several community versions are available; choose one that lets you set the frame length (start with 64) and shows labels for each level. Some versions also offer multi-timeframe settings, so you can show daily levels on an hourly chart.
On MetaTrader 4 and 5, Murrey Math indicators have been shared for years and are widely available; check the frame setting (often called period or P) and whether the version uses the full Murrey algorithm or a simple division of the high-low range, which produces different levels. The calculator above uses the full algorithm.
Murrey Math Lines and Quantum Algo
Murrey Math gives you a map of where price is likely to react. It does not tell you which reactions to trade or when a level has really broken. That decision still depends on structure, momentum and risk.
The free Quantum Algo indicators mark structure breaks, liquidity sweeps and trend on TradingView, which pairs well with a Murrey grid: a liquidity sweep of 8/8 followed by a structure break down is a far better short than a touch of 8/8 alone. Zeno, the premium engine from Quantum Algo (QuantumAlgo), prints signals with an entry, a stop and two targets on forex, gold, indices and crypto, and every call is on the public track record.
Murrey Math Lines split a price frame, snapped to clean fractions, into eighths from 0/8 to 8/8 with overshoot lines beyond. 8/8 and 0/8 are the strongest resistance and support, 4/8 is the major pivot, 3/8 to 5/8 is the normal range and 2/8 and 6/8 are reversal points. Use the grid for mean reversion in ranges, 4/8 as a trend filter and breakouts beyond the frame, but remember that levels shift when the frame changes and the lines do not tell you direction on their own.
◆ Interactive check
How well do you know Murrey Math Lines?
Questions traders ask about Murrey Math Lines
A support and resistance indicator that divides a price frame into eighths, from 0/8 to 8/8, with overshoot lines at ±1/8 and ±2/8. Each line has a defined role, such as ultimate resistance, major pivot or trading range boundary.
The 4/8 line, the major support and resistance pivot. Price above it is considered strong and below it weak, and breaks and retests of 4/8 are among the most watched signals.
Fade rejections at 8/8, 7/8, 1/8 and 0/8 back toward 4/8 in ranges, use 4/8 as a trend filter, and trade breakouts that hold beyond 8/8 or 0/8. Place stops beyond the next overshoot line.
The grid redraws when a new high or low shifts the frame. Levels do not change bar to bar in normal conditions, but they can jump after big moves, so recheck them and be careful with backtests.
A frame of 64 bars is the standard. Use 32 for a faster grid or 128 to 256 for steadier levels on volatile markets such as crypto. Keep one setting consistently.
They come from Gann's idea that price moves in eighths, but Murrey simplified it into a fixed grid of horizontal levels. Gann's own tools also use angles and time, which Murrey Math does not.
They are used widely on both. In forex they often overlap with round numbers; in crypto, high volatility means more overshoots and frame shifts, so longer frames help.
Yes, as community indicators. Search for "Murrey Math" in the indicators menu and choose a version that lets you set the frame length.
References & Related Guides
Read next
- Gann Square of 9
- Pivot Points
- Fibonacci Retracement
- Support and Resistance
- Mean Reversion Trading
- Breakout Trading Strategy
- RSI Indicator
- Donchian Channels
- Keltner Channels
- Supply and Demand Trading
- Free TradingView indicators
- Zeno — the premium engine