VPOC: The Complete Guide to the Volume Point of Control
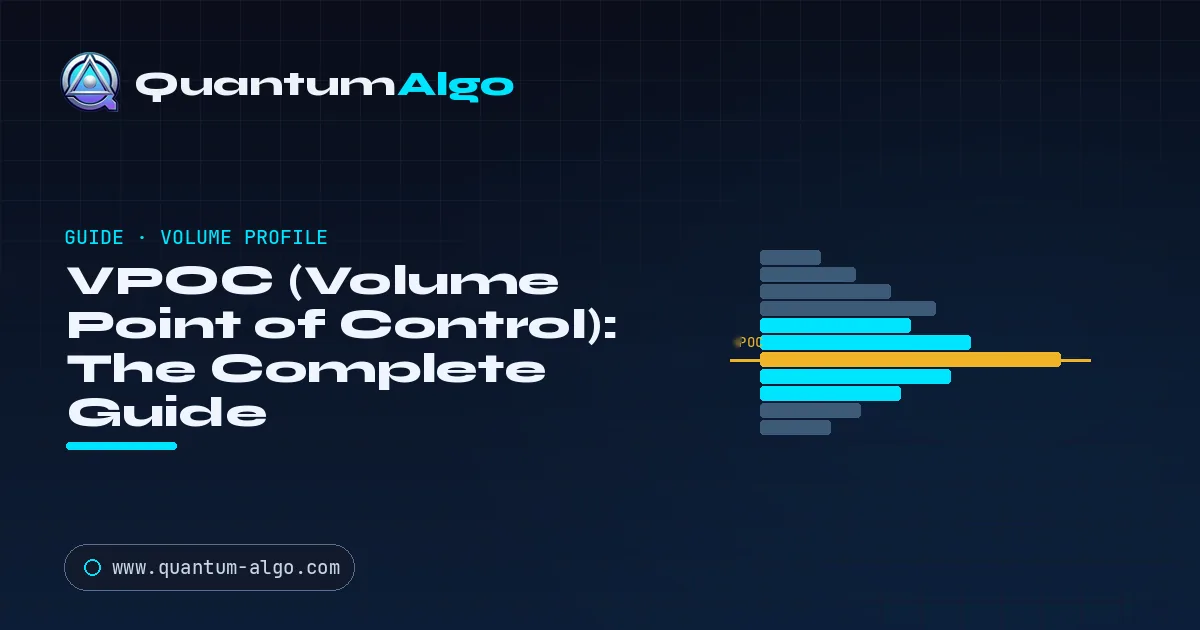
VPOC, the Volume Point of Control, is the single price level where the most volume traded during a chosen period, the longest bar on a volume profile. It marks the market's most agreed fair value and acts as a support, resistance and price magnet. VWAP is a volume-weighted average line, not a level; POC is the time-based Market Profile version.
What Is VPOC (Volume Point of Control)?
The VPOC, or Volume Point of Control, is the single price level where the most volume traded during a chosen period. On a volume profile — the horizontal histogram that shows how much volume traded at each price — the VPOC is simply the longest bar: the price the market spent the most real money agreeing on. It is the session's centre of gravity, the point of maximum acceptance between buyers and sellers.
Think of every unit of volume at a price as a vote. The VPOC is the price that won the election by the widest margin. Because it represents where the most business was actually done, price tends to treat the VPOC as a magnet: it gets pulled back toward it in ranges and reacts at it on retests. That is why volume-profile traders watch it above almost any other level.
How do VPOC, POC and VWAP differ?
These three terms get mixed up constantly, and the confusion costs traders real money. Here is the clean separation.
POC vs VPOC. Classic Point of Control (POC) comes from a Market Profile and is the price with the most TPOs (Time Price Opportunities) — the level where price spent the most time. VPOC comes from a Volume Profile and is the price with the most volume. In practice they often sit at the same or a nearby price, but when they diverge, most traders trust the VPOC because volume represents committed capital, not just time spent. Many platforms label the volume-based level simply "POC," which is why the terms are used interchangeably — but strictly, the "V" makes the volume basis explicit.
VPOC vs VWAP. This is the more important distinction. VWAP (Volume-Weighted Average Price) is a mathematical average of price across all trades — a single moving line. VPOC is not an average; it is the single price where the most volume concentrated. VWAP can sit at a price where relatively little volume traded, while VPOC is by definition the busiest price. In a trending session they can be far apart, and each tells you something different: VWAP is the fair-value benchmark, VPOC is the fair-value magnet.
How does the VPOC fit inside the volume profile?
The VPOC does not live alone. It sits at the centre of a small family of volume-profile levels you should read together:
- VPOC: the highest-volume price — the peak of the profile.
- Value Area (VA): the range containing roughly 68–70% of the period's volume, centred on the VPOC. 68% is one standard deviation; many platforms round to 70%.
- Value Area High (VAH) and Low (VAL): the upper and lower edges of the value area — dynamic support/resistance boundaries.
- High-Volume Nodes (HVN): other dense peaks where price tends to stall and consolidate.
- Low-Volume Nodes (LVN): thin gaps where price moves fast, because little business was done there.
Read together, these turn a price chart into an auction map. The VPOC is fair value; the value area is the zone of acceptance; the VAH/VAL are the edges buyers and sellers defended; HVNs are magnets and LVNs are launch pads. This is the same framework that underlies point of control trading and connects directly to premium and discount — price above the value area is expensive, below it is cheap.
VPOC, POC, VWAP and the profile levels at a glance
| Level | Built from | On the chart | What it tells you |
|---|---|---|---|
| VPOC | Volume profile: the price with the most volume | One horizontal price level | Fair value; a magnet, support or resistance |
| POC (Market Profile) | Market Profile: the price with the most TPOs (time) | One horizontal price level | Where price spent the most time |
| VWAP | Volume-weighted average of all trade prices | A moving line | Average price paid, not a concentration level |
| Value area (VAH/VAL) | Range holding about 68–70% of the period's volume | A zone around the VPOC | Zone of acceptance; its edges act as support or resistance |
| High-volume node | Other dense peaks in the profile | A horizontal zone | Price tends to stall and consolidate there |
| Low-volume node | Thin gaps in the profile | A gap in the histogram | Price tends to move fast through it |
◆The VPOC shows where a reaction is likely, not which way; direction comes from structure and bias.
Why does the VPOC act as a magnet for price?
Markets are a continuous auction. Price moves up until buyers stop paying more, moves down until sellers stop accepting less, and spends most of its time in between, at prices both sides accept. The VPOC is the exact price of maximum acceptance — where the auction found the most business. That is why it behaves so predictably as support and resistance: it is the one price the largest number of participants already agreed was fair, so when price returns there, reactions cluster.
For institutions, this is not abstract. Large desks must execute size where there is enough volume to absorb it — which is precisely at and around the VPOC and the high-volume nodes. A naked (untested) VPOC from a prior session acts as an unfinished-business magnet: price is often drawn back to it. Understanding this reframes the VPOC from "a line on a histogram" into "the price the market is most likely to revisit and defend."
![Institutional Volume Profile [Quantum Algo] indicator on the BTCUSDT 2-hour chart, showing the Control Level (VPOC) as an amber line, the Equilibrium Zone (value area) edges as dashed lines, gradient heat-mapped volume nodes, and an analytics dashboard reading Control, EQ High, EQ Low, total density and context.](/blog/guides/vpoc-volume-point-of-control-complete-guide/institutional-volume-profile-vpoc-quantum-algo.webp)
The chart above is a live example on Bitcoin. The amber "Control Level" is the VPOC — the single price with peak accumulated volume. Notice how it anchors the whole structure: the equilibrium (value area) forms around it, and price rotates relative to it. That is the auction logic made visible.
What are five practical ways to trade the VPOC?
The VPOC is a context-and-level tool, not a standalone signal. Five practical uses:
1. Mean reversion in ranges. When the market is balanced (price inside the value area), it tends to rotate back toward the VPOC. Fade the extremes: look for longs near the VAL and shorts near the VAH, targeting the VPOC.
2. Naked VPOC magnets. An un-tested VPOC from a previous session often acts as a target. If price is trading away from a prior naked VPOC, that level is a logical draw and a place to expect a reaction.
3. Acceptance vs rejection. Watch how price behaves at the VPOC. A clean rejection (wick and reverse) says the level is holding; sustained trading through it with volume says value is migrating and a directional move may be underway.
4. Breakout confirmation. A decisive break and acceptance outside the value area — with the VPOC starting to migrate in the breakout direction — confirms a genuine trend move rather than a false break.
5. Confluence with structure. The VPOC is strongest when it lines up with a Smart Money Concepts level — an order block or a swing point sitting at the VPOC is a far higher-probability zone than either alone.
What do the developing VPOC and its migration reveal?
The VPOC is not static. During a live session it is called the developing VPOC, and it shifts as new volume comes in. Watching how it moves is a genuine edge. A VPOC that stays pinned at one price all session signals institutions were committed to that level — strong acceptance, likely continuation of balance. A VPOC that steadily migrates up or down reveals active repositioning: value is being rebuilt at higher or lower prices, which frequently precedes or confirms a trend.
This "migration trace" is information most retail volume-profile tools throw away by only showing the final, completed profile. Tracking the developing VPOC in real time is exactly the kind of order-flow insight that professional platforms like Sierra Chart and Bookmap are known for. When you see the VPOC climbing session over session, higher value is being accepted — a bullish structural tell that pairs cleanly with a higher-timeframe bias read.

Automate your trades. Let Quantum Algo trade for you.
Every signal executed on your own account — 24/7, hands-off.
What VPOC mistakes should you avoid?
Confusing VPOC with VWAP. They are different tools answering different questions. Using them interchangeably leads to bad reads — VWAP is an average line, VPOC is a concentration level.
Trading the VPOC blindly. The VPOC tells you where a reaction is likely, not which way. Without a directional bias and confirmation, you are guessing at the level.
Ignoring the timeframe of the profile. A 5-minute session VPOC and a monthly VPOC are completely different in weight. Match the profile period to your holding period.
Forgetting low-volume nodes. Traders fixate on the VPOC and miss that the LVNs around it are where price accelerates. The gaps matter as much as the peak.
Using thin, unreliable volume. On illiquid instruments or fragmented venues, the volume that builds the profile can be misleading, which distorts the VPOC. It works best where volume is real and centralised, like futures and liquid crypto or large-cap equities.
Which timeframes and markets suit the VPOC best?
The VPOC scales to any period you choose, and the choice should match how you trade. Day traders lean on the session VPOC and the prior day's VPOC, VAH, and VAL as their key levels. Swing traders use weekly and monthly profiles, whose VPOCs mark major areas of long-term acceptance. Position traders and investors may look at yearly or composite profiles to find the price the market has agreed on over a whole cycle.
It also travels across markets. The VPOC is cleanest on futures, where volume is centralised at a single exchange, giving an honest read of the auction. It works well on liquid crypto perpetuals and large-cap stocks. It is least reliable where reported volume is fragmented or untrustworthy. Wherever you apply it, the principle is identical: the VPOC is the busiest price, and the busiest price is the one the market cares about most. That universality is why it is worth mastering once and using everywhere.
A Worked Example: Trading the VPOC in a Range
Suppose Bitcoin has spent two days balancing between roughly 62,000 and 65,000, and the volume profile for that balance shows a clear VPOC at 63,500 with the value area running from about 62,800 (VAL) to 64,400 (VAH). That single profile gives you a complete plan without a single lagging indicator.
While price stays inside the value area, the market is in balance and the VPOC is a magnet. If price drifts down to the VAL near 62,800 and shows a rejection — a wick and a reclaim — you have a mean-reversion long back toward the VPOC at 63,500, with a stop just below the VAL. The logic is pure auction: price reached the cheap edge of accepted value, buyers defended it, and fair value (the VPOC) is the natural target. The same works in reverse at the VAH near 64,400 for a short back to the VPOC.
Now watch what changes the plan. If price instead accepts below the VAL — trading there and building volume rather than rejecting — the balance is breaking. The developing VPOC will begin to migrate lower, and your range-trading plan is void; you switch to expecting a directional move toward the next high-volume node below. The profile told you both the setup and its invalidation. That is the discipline the VPOC imposes: every trade is anchored to a real level of acceptance, and the level itself tells you when you are wrong.
How do you combine the VPOC with market structure?
The VPOC is powerful alone, but its real strength shows up in confluence. On its own it tells you where the market is likely to react; it says nothing about which direction that reaction will resolve. Direction comes from structure and bias, so the highest-probability setups stack the VPOC on top of a Smart Money Concepts read.
Look for these overlaps. A VPOC that lines up with a bullish order block in a discount, inside an uptrend, is a far stronger long than a naked VPOC in isolation — three independent frameworks all pointing at the same price. A VPOC sitting at a swing point that just produced a market structure shift gives you both the level (VPOC) and the trigger (the shift). And when the VPOC agrees with the premium/discount read — cheap and high-volume for longs, expensive and high-volume for shorts — you are trading with the auction, the structure, and the bias all aligned.
The mistake is to treat the VPOC as a complete system. It is one exceptionally good input. Combine it with a directional bias from your higher timeframe, a structural trigger, and disciplined risk management, and the busiest price on the chart becomes one of the most reliable decision points you have.
Finding the VPOC with Quantum Algo
Standard volume-profile tools show you a flat histogram and leave you to eyeball the VPOC. Quantum Algo's free, open-source Institutional Volume Profile [Quantum Algo] on TradingView goes further. It computes the Control Level (the VPOC) as a precise amber line, draws the Equilibrium Zone (value area) edges as dynamic support/resistance, and uses gradient heat mapping so the densest levels glow — you see where institutional weight sits without reading a number.
It also solves the things basic profiles miss: a buy/sell delta mode reveals directional dominance hidden inside the profile, automatic Dense Node (HVN) and Void Node (LVN) classification flags magnets and acceleration zones, an optional Migration Trace shows the developing VPOC repositioning in real time, and a live dashboard reads the Control price, value-area edges, total density, and whether price is in Premium, Discount, or Equilibrium. Because it's open-source, you can verify exactly how it maps volume — no black box. Pair it with the volume profile framework and the Smart Money Concepts toolkit for a complete institutional read.
Get the free Institutional Volume Profile → See the full toolkitFrequently Asked Questions
VPOC (Volume Point of Control) is the single price level where the most volume traded during a chosen period. On a volume profile it is the longest bar — the price the market spent the most real money agreeing on. It acts as the session's fair value and a strong support/resistance magnet, because it is where the most business was actually done.
They refer to the same idea measured differently. Classic POC comes from a Market Profile and is the price with the most TPOs (time-based activity). VPOC comes from a Volume Profile and is the price with the most traded volume. They are often at the same or a nearby price, but when they diverge, most traders trust VPOC because volume represents committed capital rather than just time spent. Many platforms simply label the volume-based level 'POC'.
VWAP is the volume-weighted average price — a single mathematical average that plots as a moving line. VPOC is the single price with the highest concentration of volume — a fixed level, not an average. VWAP can sit where little volume traded; VPOC is by definition the busiest price. In trending sessions they can be far apart: VWAP is the fair-value benchmark, VPOC is the fair-value magnet.
A volume profile splits the period into price levels and sums the volume traded at each. The VPOC is simply the level with the highest total volume — the peak of the histogram. Volume-profile indicators do this automatically. The value area (usually 68–70% of volume) is then built outward from the VPOC, with its upper and lower edges becoming the VAH and VAL.
It can act as both, depending on which side price approaches from. Because the VPOC is the price of maximum acceptance, price tends to be drawn back to it in ranges and reacts there on retests. Below price it often acts as support; above price it often acts as resistance. What matters is the reaction — acceptance (trading through) versus rejection (wick and reverse).
A naked (or virgin) VPOC is a Point of Control from a previous session that price has not returned to and traded at since it formed. Because it represents unfinished business — a price of high past acceptance that hasn't been revisited — it often acts as a magnet, drawing price back to it. Traders use naked VPOCs as logical targets and reaction levels.
Common approaches: in a balanced range, fade the value-area extremes back toward the VPOC (mean reversion); use a naked VPOC from a prior session as a target; watch acceptance vs rejection at the level to judge whether it holds; and confirm breakouts when price accepts outside the value area with the VPOC migrating. It works best combined with a directional bias, market structure, and risk management.
VPOC migration is the movement of the developing (live) VPOC as new volume comes in during a session. A VPOC that stays pinned at one price signals strong acceptance and balance; a VPOC that steadily migrates up or down reveals institutions rebuilding value at new prices, which often precedes or confirms a trend. Tracking the developing VPOC is a professional order-flow technique.
Match the profile period to your holding period. Day traders use the session VPOC and the prior day's VPOC, VAH, and VAL. Swing traders use weekly and monthly profiles. Position traders use yearly or composite profiles. A 5-minute VPOC and a monthly VPOC carry very different weight, so always know which period built the level you are watching.
It works best where volume is real and centralised — futures (volume at a single exchange), liquid crypto perpetuals, and large-cap stocks. It is least reliable on illiquid instruments or fragmented venues where reported volume is untrustworthy, because bad volume data distorts the profile. Wherever volume is meaningful, the VPOC reliably marks the busiest, most-watched price.
High-Volume Nodes (HVN) are dense peaks in the profile where lots of volume traded — price tends to stall and consolidate around them, so they act as magnets and strong support/resistance. Low-Volume Nodes (LVN) are thin gaps where little volume traded — price moves through them fast, so they act as acceleration zones. The VPOC is the largest HVN of all.
Quantum Algo's free, open-source Institutional Volume Profile on TradingView computes the Control Level (VPOC) as a precise line, draws the value-area edges, and heat-maps volume density so institutional levels stand out. It adds buy/sell delta coloring, automatic HVN/LVN node classification, a migration trace for the developing VPOC, and a live dashboard reading the Control price and whether price is in Premium, Discount, or Equilibrium.
References & Related Guides
More in this topic
- ADX Indicator: Complete Trading Guide
- AlphaTrend Indicator: Complete Trading Guide
- ATR (Average True Range): Complete Trading Guide
- Awesome Oscillator: Complete Indicator Guide
- What Are the Best Volume Indicators?
- Bollinger Bands — Complete Trading Indicator Guide
- CCI Indicator: Complete Guide
- Chandelier Exit: Complete Trading Guide
- Donchian Channels: Complete Indicator Guide
- Fibonacci Bollinger Bands: Complete Trading Guide
- Fibonacci Retracement — Complete Trading Guide
- Hull Moving Average (HMA): Complete Trading Guide
- Gaussian Channel Indicator Guide
- Best Buy/Sell Indicator Guide
Core reading
- BOS & CHoCH: Complete Market Structure Guide
- Order Blocks Trading: Complete Guide
- Best TradingView Indicators — Complete Guide
- Risk Management in Trading — Complete Guide
- Candlestick Patterns Guide — Engulfing, Pinbar & More
- All Premium Guides
- Quantum Algo on TradingView
- Public Track Record