Squeeze (Bollinger inside Keltner)
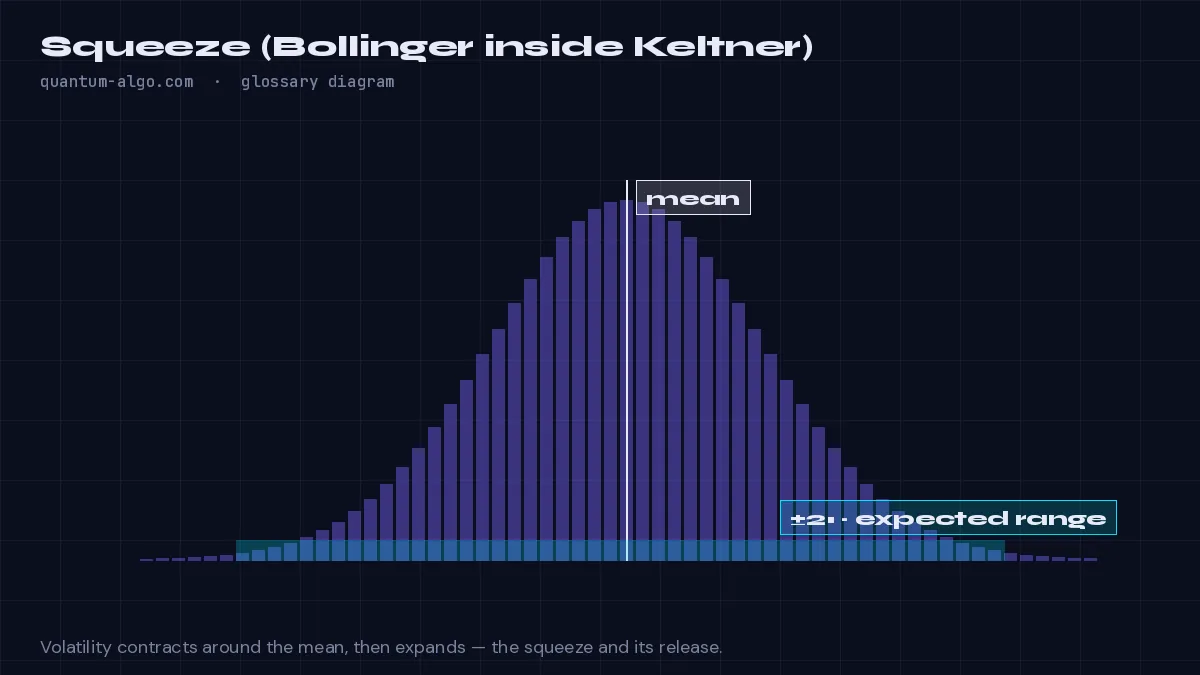
A squeeze is a volatility compression where the Bollinger Bands contract inside the Keltner Channel — a sign that a period of very low volatility is coiling energy for an expansion; the release, when the bands re-emerge, is the breakout signal.
What it means
Bollinger Bands widen and narrow with the standard deviation of price; Keltner Channels widen and narrow with the average true range. Most of the time the Bollinger Bands sit outside the Keltner Channel. When volatility collapses far enough, the bands slip inside the channel — the squeeze. John Carter's TTM Squeeze popularised the reading; the principle is that low volatility is followed by high volatility.
The squeeze itself is directionless. Direction comes from momentum at the moment of release (the histogram in the TTM version) or from structure: which side of the range breaks with displacement. Traders wait through the squeeze and act on the first bar where the bands leave the channel.
The same concept appears at other scales — the MACD Matrix's histogram squeeze, the Keltner Rings' width percentile, the Volatility Storm Tracker's BUILDING state. All read compression as the precursor of expansion.
How to identify it on a chart
- Plot Bollinger Bands (20, 2) and a Keltner Channel (20, ATR 1.5).
- When both Bollinger Bands are inside the Keltner Channel, the squeeze is on.
- When the bands re-emerge, the squeeze fires; take direction from momentum or the structure break.
Worked example
ETH ranges for 30 bars on the 1-hour; the bands close inside the channel for 12 of them. On bar 13 the upper band crosses out of the channel as price closes above the range with a rising histogram — the squeeze fires long.
See it on the chart, read it in depth
Frequently asked questions
What settings define a squeeze?
Bollinger 20 periods / 2 standard deviations and Keltner 20 periods / 1.5 ATR are the TTM defaults; the Neural Confluence Engine uses Bollinger 20/2 with Keltner ATR 10.
Does a squeeze tell direction?
No — only that expansion is likely. Read direction from momentum at release or from which side breaks with displacement.
How long can a squeeze last?
From a few bars to dozens; longer squeezes tend to release more violently.
Which free indicator shows it?
Keltner Rings marks squeeze coils and the S release signal; the Neural Confluence Engine and MACD Matrix carry squeeze factors.
Related terms
See Squeeze (Bollinger inside Keltner) on your TradingView chart
Zeno reads Smart Money structure across timeframes and prints the entry, stop and targets — with a public record of every posted trade. The free indicators draw the concepts this page defines.