Stochastic RSI: Formula, Settings and How to Trade It Without the Whipsaw
The Stochastic RSI applies the stochastic formula to RSI instead of to price: it shows where the current RSI sits inside its own highest and lowest values of the last 14 periods, scaled 0 to 100 and smoothed into a K line (3) and a D line (3). It moves far faster than RSI and pins to 0 or 100 whenever RSI makes a new short-term extreme, so a reading of 100 means RSI is at the top of its recent range, not that price is stretched. The usable signal is the K over D cross leaving the 20 zone (long) or the 80 zone (short), taken only with the higher-timeframe trend and at a level.
StochRSI was the indicator that taught me the difference between a signal and a sensitivity dial. It fires constantly, it is at 100 in every uptrend, and for a year I fought trends because a pane said overbought. This page is the formula step by step, the difference from RSI and the stochastic, the 14,14,3,3 defaults and the two that are worth changing, the cross-with-the-trend-at-a-level method, a BTCUSDT 4-hour trade and its failed twin a month later, and the ways the indicator misleads. The calculator runs the full chain from closes to K and D.
Indicators that prove themselves in public.
One engine, four precision tools — the Gold (XAU) Scalper, the institutional Gravity Zone, the Zeno momentum Oscillator, and Zeno Stocks for equities.



What the Stochastic RSI is
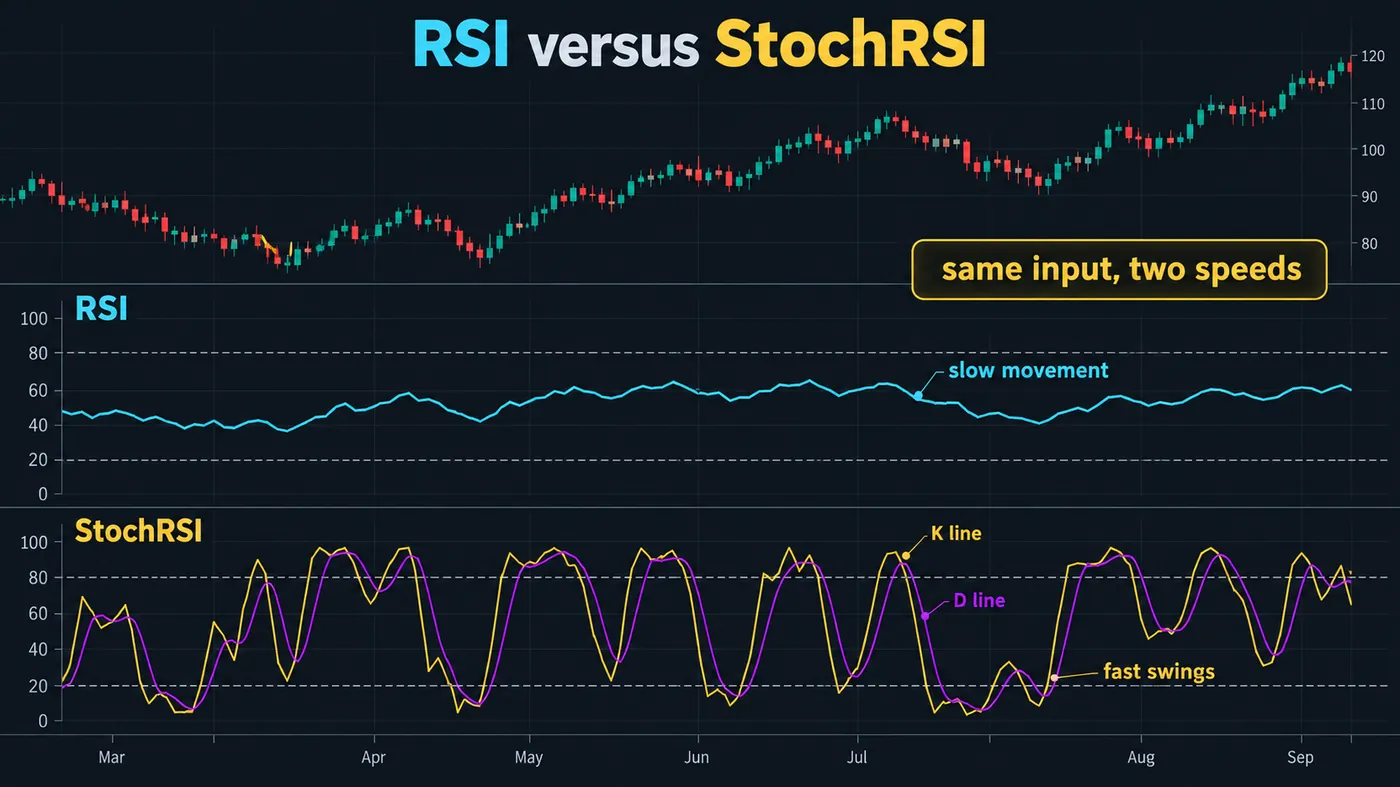
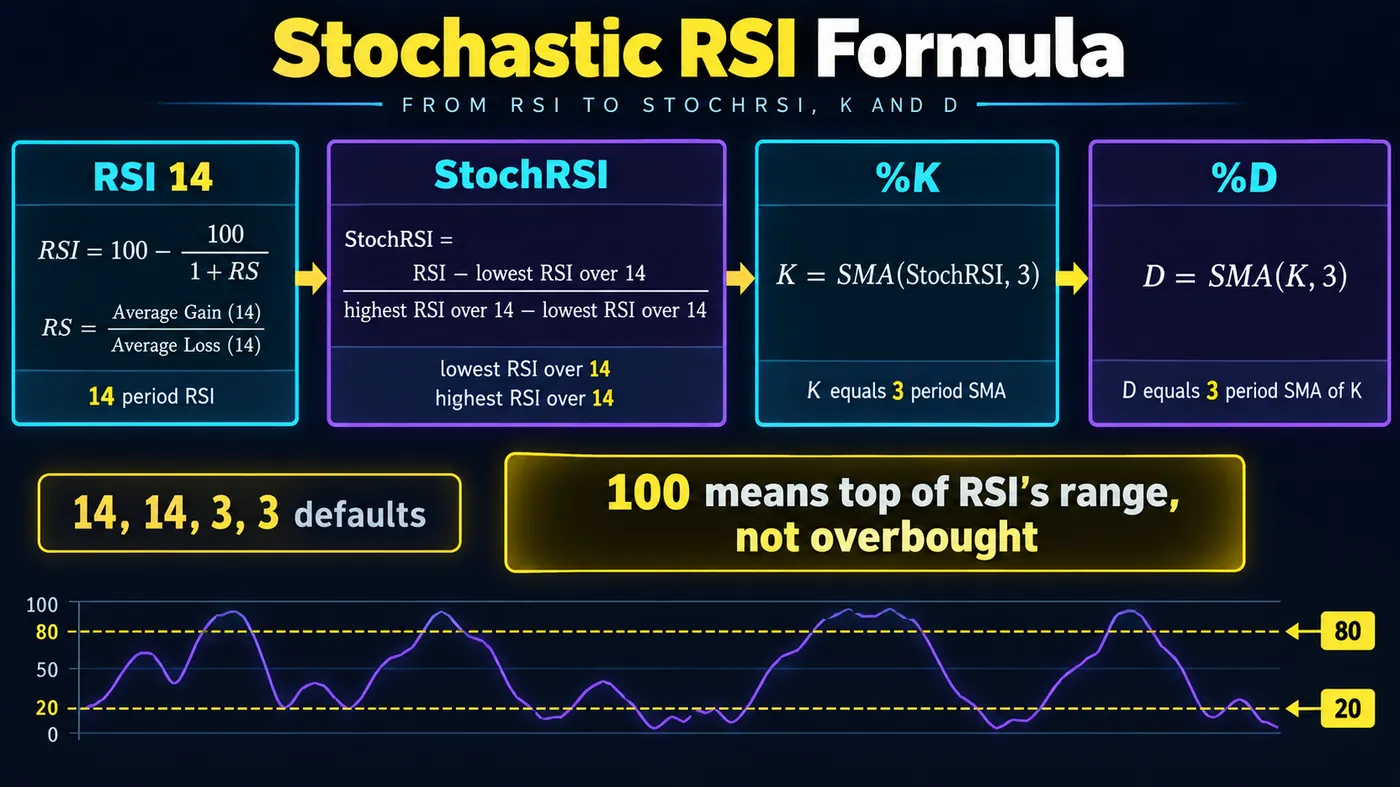
The Stochastic RSI is an oscillator applied to an oscillator. Take the 14-period RSI, then ask where today's RSI sits inside its own highest and lowest values of the last 14 periods, scaled from 0 to 100. That is the stochastic formula — the same one the stochastic oscillator applies to price — pointed at RSI instead of at closes. The result moves far faster than RSI and pins to 0 or 100 whenever RSI makes a new 14-period low or high, even if RSI itself is sitting at 55.
Tushar Chande and Stanley Kroll published it in The New Technical Trader (1994) to solve a specific complaint: RSI spends most of its life between 40 and 60 and rarely reaches the 30 and 70 lines in a trend, so RSI-based signals are rare. StochRSI produces signals constantly, which is both its point and its problem. It is a sensitivity dial, and the settings and filters around it decide whether that sensitivity is useful or noise.
What it is not: it is not a more accurate RSI, it is not a measure of how overbought price is, and a reading of 100 does not mean RSI is high. It means RSI is at the top of its recent range. On a chart where RSI has been stuck between 45 and 52 for two weeks, StochRSI will print 100 at 52 and 0 at 45. Read it as relative, always.
RSI versus Stochastic RSI
| RSI | Stochastic RSI | Stochastic oscillator | |
|---|---|---|---|
| Input | Closing prices | RSI values | Closing prices vs high–low range |
| Measures | Momentum: average gain vs average loss | Where RSI sits inside its recent range | Where price sits inside its recent range |
| Range | 0–100, mostly 30–70 | 0–100, often pinned at 0 or 100 | 0–100 |
| Speed | Slow | Very fast | Fast |
| Thresholds | 30 / 70 (or 20 / 80 in trends) | 20 / 80 | 20 / 80 |
| Signals per month (daily chart) | Few | Many | Several |
| Best at | Divergence, trend strength, regime | Timing entries inside a known trend | Range trading, timing |
| Worst at | Timing in ranges | Anything without a trend filter | Trend continuation |
The three are often confused because all run from 0 to 100 and all use "overbought" and "oversold". Only RSI measures momentum. The other two measure position inside a range, and StochRSI measures position inside RSI's range, which is a step further from price than most people realise when they read a 95 as "very overbought".
The formula and the settings
| Step | Formula | Default |
|---|---|---|
| 1. RSI | RSI over n periods (Wilder smoothing) | n = 14 |
| 2. Raw StochRSI | (RSI − lowest RSI over m) ÷ (highest RSI over m − lowest RSI over m) × 100 | m = 14 |
| 3. K line | SMA of raw StochRSI over k periods | k = 3 |
| 4. D line | SMA of K over d periods | d = 3 |
| Thresholds | Oversold below 20, overbought above 80 | 20 / 80 |
TradingView's built-in uses exactly these defaults and labels the inputs K, D, RSI Length, Stochastic Length: 3, 3, 14, 14. Two things about the settings matter in practice. First, the smoothing is what makes it usable — the raw StochRSI is a square wave, and without the 3-period K and D it produces a cross on every bar. Second, the two lengths are independent: a 14-period RSI with a 9-period stochastic length is more sensitive; with a 21-period stochastic length it is calmer and closer to what most traders mean by "oversold". If the signal count is too high, lengthen the stochastic length before touching the RSI length.
| Use | RSI len | Stoch len | K | D | Thresholds | Note |
|---|---|---|---|---|---|---|
| Default (Chande & Kroll) | 14 | 14 | 3 | 3 | 20 / 80 | Start here; most published research uses it |
| Swing trading, daily and 4H | 14 | 21 | 3 | 3 | 20 / 80 | Fewer, cleaner extremes |
| Intraday, 5M–15M | 14 | 9 | 3 | 3 | 20 / 80 | Faster, use only with a trend filter |
| Crypto 4H | 14 | 14 | 3 | 5 | 15 / 85 | Extra D smoothing cuts the whipsaw on 24-hour noise |
| Trend-following filter | 14 | 14 | 5 | 5 | 50 line | Above 50 with the trend = hold; cross of 50 = momentum shift |

Automate your trades. Let Quantum Algo trade for you.
Every signal executed on your own account — on your account, with the plan you define.
How to trade it
- Establish the trend elsewhere. A 200 EMA, higher-timeframe structure, or the daily candle. StochRSI without a trend filter is a coin flip with extra steps: in a downtrend it sits at 0 for twenty bars while price keeps falling.
- Wait for the extreme in the direction of the trend. Uptrend: StochRSI below 20. Downtrend: above 80. Ignore the extremes against the trend entirely.
- Wait for the K over D cross out of the zone. K crossing above D while below 20 (or just leaving 20) is the long trigger. The cross is the signal, not the touch of the zone — the touch happens constantly.
- Require a level. The cross should happen at something: an order block, a fair value gap, VWAP, a prior swing. A cross in the middle of nowhere is a cross in the middle of nowhere.
- Stop beyond the level, not beyond the indicator. Under the order block or the swing low that produced the cross. StochRSI has no idea where price should not go.
- Exit on structure or on the opposite extreme with a cross. Take profit at the prior swing or the next liquidity; or when StochRSI reaches 80 and K crosses below D, if you are trading the swing rather than the trend.
Stochastic RSI calculator
Paste a series of closing prices (oldest first) or of RSI values, set the four parameters, and the tool returns the latest RSI, raw StochRSI, K and D, whether a cross happened on the last bar, and what the reading means — including the reminder that StochRSI at an extreme says nothing about RSI's level.
Divergence and the 50 line
Two secondary uses are worth knowing. Divergence — price making a lower low while StochRSI makes a higher low — works about as well as it does on RSI, which is to say it is a warning, not a trigger, and it fails constantly in strong trends because StochRSI is pinned. Divergence on the slower RSI is more reliable; StochRSI divergence is a reason to look at the RSI.
The 50 line is more useful than most people think. In an uptrend, StochRSI holding above 50 through pullbacks means RSI is staying in the upper half of its range — momentum is intact. A pullback that takes StochRSI to 20 and back above 50 with a K/D cross is the entry described above. A pullback where it never gets back above 50 is a trend losing its momentum, which is more information than the 20/80 zones give you.
Reference data
| Item | Value |
|---|---|
| Origin | Tushar Chande and Stanley Kroll, The New Technical Trader (1994) |
| Formula | StochRSI = (RSI − min RSI over m) ÷ (max RSI over m − min RSI over m) |
| Default settings | RSI 14, stochastic length 14, K 3, D 3 |
| Thresholds | 20 oversold, 80 overbought (not 30/70) |
| Range | 0–100; pins at 0 or 100 when RSI makes a new m-period extreme |
| Reads as | Relative position of RSI, not momentum and not price |
| Primary signal | K/D cross out of the 20 or 80 zone, with the trend, at a level |
| Secondary | Divergence (warning only); the 50 line as a momentum-intact test |
| Weakness | Pins for long stretches in trends; produces many false crosses in ranges without a level |
| TradingView | Built-in "Stochastic RSI"; inputs K, D, RSI Length, Stochastic Length |
| Related | RSI, stochastic oscillator, stochastic momentum index, MACD, Williams %R |
Worked example: BTCUSDT 4-hour, the cross at an order block
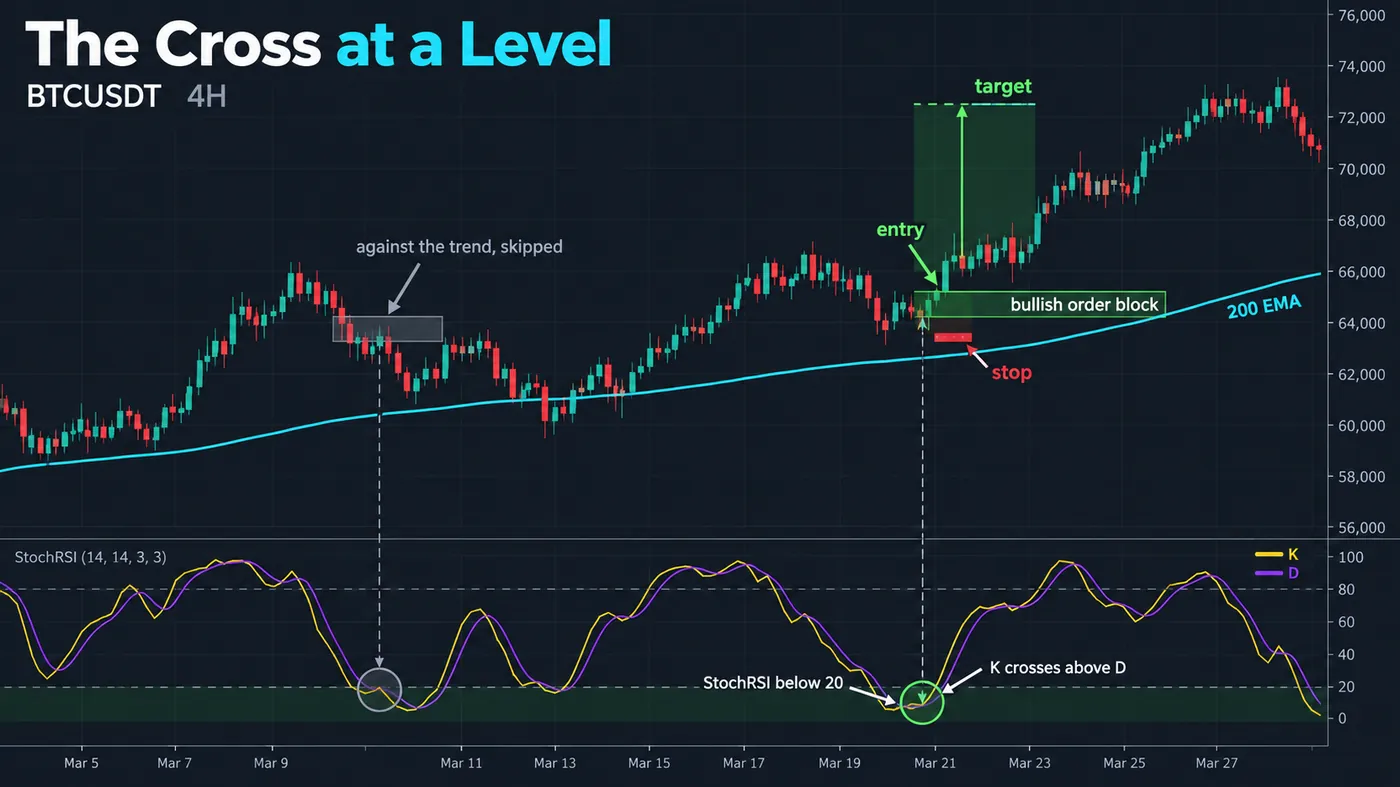
BTCUSDT perpetual on Bybit, 4-hour chart, price above the 200 EMA for three weeks — the trend filter is passed. A pullback runs from 68,900 to 65,400 over five candles. StochRSI (14, 14, 3, 3) reaches 4.2 on the fourth candle and 0.0 on the fifth; RSI itself is 44 — nowhere near oversold on its own terms, which is exactly the situation StochRSI exists for. A bullish order block from a 4-hour candle nine days earlier sits from 65,150 to 65,620.
The fifth candle closes at 65,480 inside the block. The sixth closes at 65,910 and StochRSI prints K 18.6 over D 11.3 — the cross out of the zone, at the level, with the trend. Long at 65,910, stop at 65,050 under the block, 860 points of risk. Target the pullback origin at 68,900, 2,990 points, 3.5R.
Price reached 67,400 two candles later, pulled back to 66,300 — StochRSI dropped to 41 and turned up again without reaching 20, which is the 50-line test working in the trade's favour — and printed 68,950 four days after entry. Target filled at 68,900 for 3.5R. StochRSI had been above 80 since 67,400 and crossed down twice on the way; a trader exiting on those crosses would have taken 1.7R and then 2.4R. Trading the level rather than the indicator was the difference.
The same cross a month later, with price below the 200 EMA, printed at 61,200 and price was at 58,400 three days later. Same indicator, same settings, same cross; the filter is the whole edge.
Where the Stochastic RSI fails
Trends. In a strong trend StochRSI sits at 100 (or 0) for bar after bar, crossing down and back up without price ever pulling back. Every "overbought" reading is wrong until the one that is right, and there is no way to tell which from the indicator. This is why the trend filter is not optional.
Ranges without a level. In a choppy range StochRSI crosses every two or three bars. Without a level to anchor the cross to, it is a random-entry generator with a 50% hit rate and worse expectancy after costs.
Misreading 100 as "very overbought". StochRSI 100 with RSI at 52 means RSI is at the top of a narrow range; the market is not stretched. Check the RSI pane before acting on the StochRSI pane.
Low-volume instruments and low timeframes. On a 1-minute altcoin chart the RSI is noise and a stochastic of noise is worse. Use it on 15-minute and above for crypto and indices, 1-hour and above for forex majors.
Over-optimised settings. A backtest that finds 9, 11, 2, 4 beats 14, 14, 3, 3 on one symbol over one year has found the noise. Change the stochastic length by one step, keep the rest, and require the level.
Mistakes traders make with the Stochastic RSI
- Using 30 and 70 as thresholds. Those are RSI's lines. StochRSI uses 20 and 80 and spends far more time beyond them.
- Trading the touch instead of the cross. The zone is reached constantly; the K/D cross leaving it is the signal.
- Fading a trend because StochRSI is at 100. It will be at 100 for the next fifteen bars.
- Reading it as an RSI upgrade. It is a different thing measuring a different quantity.
- Stopping out on the indicator. The stop goes under the level; the indicator does not know where support is.
- Stacking it with RSI and the stochastic as "confluence". Three views of one input agree with each other by construction.
Stochastic RSI and the free indicators
TradingView's built-in Stochastic RSI is fine; there is no reason for a custom one. What the library adds is the two things the indicator cannot supply: the trend and the level. The Order Blocks with Volume script gives you the block the cross should land on, the Smart Money Concepts Engine gives you the structure that defines the trend, and the Multi-Oscillator Divergence Scanner catches the divergences across RSI, stochastic and the rest without adding three panes. The premium engine, Zeno, prints buy and sell signals with a stop and targets and already carries a regime filter; I do not run StochRSI beside it, but a Zeno buy signal that lands while StochRSI is leaving 20 with the trend is as clean as the indicator gets.
A stochastic of the RSI, fast enough to be useful and fast enough to be dangerous. Keep 14,14,3,3, use 20 and 80, and trade only the K/D cross leaving a zone in the direction of the trend at a level the chart gave you, with the stop under the level. Read 100 as "top of RSI's range", never as "stretched", and let the 50 line tell you whether momentum is still intact on the pullbacks.
◆ Interactive check
Do you know what 100 means?
Questions traders ask about the Stochastic RSI
An oscillator that applies the stochastic formula to RSI: (RSI − lowest RSI over 14) ÷ (highest RSI over 14 − lowest RSI over 14), scaled 0 to 100 and smoothed into a K line and a D line. It shows where RSI sits inside its own recent range and reacts far faster than RSI itself.
RSI measures momentum — average gain against average loss — and mostly sits between 30 and 70. Stochastic RSI measures where that RSI value sits inside its recent range and pins to 0 or 100 whenever RSI makes a new short-term extreme. StochRSI at 100 does not mean RSI is high; it means RSI is at the top of its last 14 readings.
Start with the defaults: RSI 14, stochastic length 14, K 3, D 3, thresholds 20 and 80. To reduce whipsaw, lengthen the stochastic length to 21 (swing) or add D smoothing to 5 (crypto 4H); to speed it up intraday, shorten the stochastic length to 9. Change one parameter by one step and require a level rather than chasing an optimised set.
Establish the trend elsewhere (200 EMA, structure, the daily candle). In an uptrend wait for StochRSI below 20, then for K to cross above D leaving the zone, at a level such as an order block or a fair value gap. Enter on the cross, stop under the level, target the prior swing. Mirror it for shorts in a downtrend. Skip every extreme against the trend.
Neither. RSI is better for divergence, regime and trend strength; StochRSI is better for timing entries inside a trend you have already identified. Stacking both as "confluence" adds nothing, because StochRSI is computed from RSI.
Because in a trend RSI keeps making new 14-period highs, and StochRSI measures position inside that range. It will read 100 for as long as RSI keeps rising, which can be twenty bars. That is the indicator working as designed, and it is why every "overbought" reading in a trend is wrong until the one that is not.
The stochastic oscillator applies the range formula to price — where the close sits between the highest high and lowest low. StochRSI applies the same formula to RSI. Both run 0 to 100 with 20/80 thresholds; the stochastic reads price directly and StochRSI reads RSI, one step further from price.
On 4-hour and daily BTCUSDT and ETHUSDT charts with a trend filter and a level, yes — the worked example on this page is one. On low timeframes of thin altcoins it is a stochastic of noise. Adding D smoothing (3 to 5) and using 15/85 helps with 24-hour markets.
As a warning, not a trigger: price making a lower low while StochRSI makes a higher low says selling momentum is fading, but StochRSI is pinned in strong trends and diverges constantly. Divergence on the slower RSI is more reliable; treat StochRSI divergence as a reason to check RSI.
No — the TradingView built-in is fine and there is nothing to improve in the formula. The library supplies what the indicator cannot: Order Blocks with Volume for the level, the Smart Money Concepts Engine for the trend, and the Multi-Oscillator Divergence Scanner for divergences across several oscillators in one pane. Zeno, the premium engine, prints signals with stops and targets and carries its own regime filter.
References & Related Guides
Read next
- RSI Indicator: Complete Guide
- Stochastic Oscillator
- Stochastic Momentum Index
- Divergence Trading
- MACD Indicator
- Squeeze Momentum Indicator
- Order Blocks: Complete Guide
- Mean Reversion Trading
- Momentum Trading Strategy
- Multi-Oscillator Divergence Scanner (free indicator)
- Order Blocks with Volume (free indicator)
- Zeno — the premium engine