HalfTrend Indicator: The Complete Trend-Reversal Guide
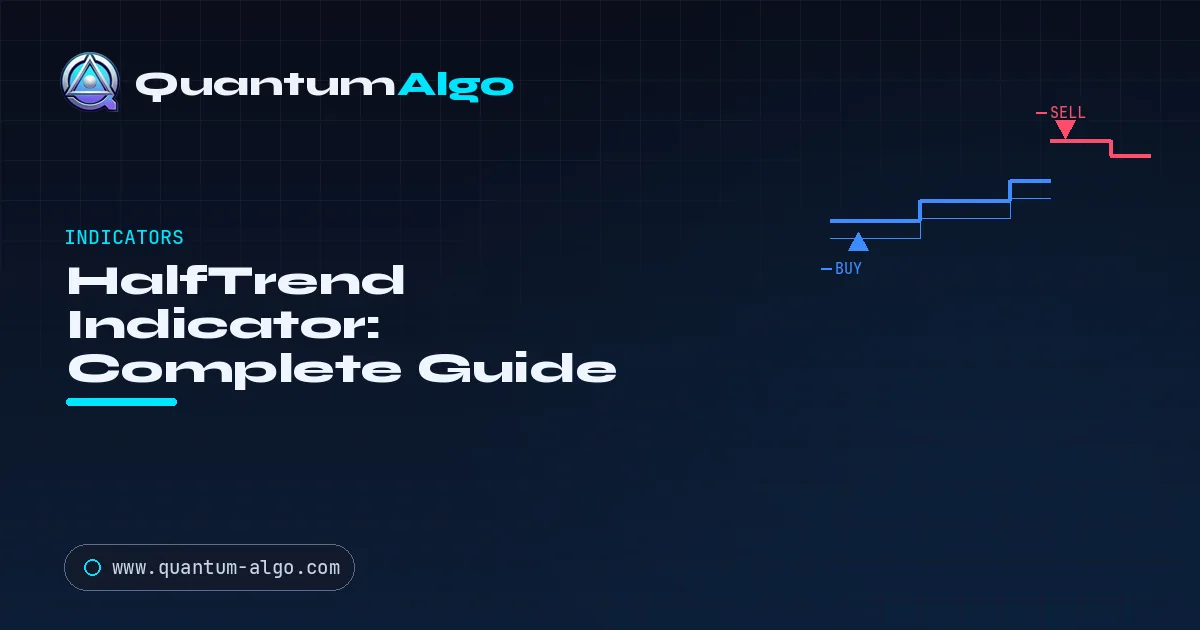
The HalfTrend indicator is a trend-reversal tool that plots a stable, color-coded line from smoothed highs and lows over an amplitude lookback. The line stays flat and flips only when price breaks the opposing extreme: blue for an uptrend, red for a downtrend, plus a reversal arrow. ATR channel bands around the line supply ready-made stop-loss and take-profit levels.
The HalfTrend indicator has a reputation for doing something most trend tools cannot: it stays calm. Where a moving average zig-zags with every wiggle of price, HalfTrend holds a flat, colour-coded line that only flips when the market genuinely changes character — printing a clean blue arrow to buy or a red arrow to sell. That combination of a stable line, decisive reversal arrows and an ATR channel for stops has made it one of the most popular trend-reversal indicators on TradingView, MetaTrader and cTrader.
This guide breaks down exactly how HalfTrend works, the two settings that control everything, how to read its arrows and ATR bands, three ways to trade it, and the honest limitations every user needs to respect. It is written for traders who want a low-noise trend filter with built-in reversal signals — and who want to understand the logic rather than blindly trust the arrows.

Automate your trades. Let Quantum Algo trade for you.
Every signal executed on your own account — 24/7, hands-off.
What does the HalfTrend indicator actually show?
HalfTrend, originally authored on TradingView by the well-known scripter everget, is a trend-following reversal indicator. Unlike a standard moving average that continuously curves with price, HalfTrend draws a line that stays flat and holds its level until a reversal condition is met — then it "half-steps" to a new level and changes colour. The TakeProfit documentation describes it well: the indicator plots a dynamic half-trend line that changes colour based on market conditions and highlights entry and exit points with arrows, built on price action, ATR, and swing high/low detection.
The visual output has three parts. The main line is blue when the trend is up (acting as support beneath price) and red when the trend is down (acting as resistance above price). The arrows mark the exact bar where the trend flips — a blue arrow for a new uptrend, a red arrow for a new downtrend. And the ATR channel — a ribbon of high and low bands offset from the line by the Average True Range — gives you natural stop-loss and take-profit levels. As LiteFinance summarises, blue lines and arrows signal an uptrend prompting long positions, while red lines and arrows indicate a downtrend.
The half-trend line
A stable, colour-coded line that holds its level and only steps to a new one on a genuine reversal — filtering out the noise that makes ordinary MAs whipsaw.
Reversal arrows
A blue arrow marks a fresh uptrend, a red arrow a fresh downtrend. These fire only at the flip, giving clear, discrete entry signals rather than a constant stream.
ATR channel bands
High and low bands offset from the line by the ATR form a ribbon. They double as ready-made stop-loss and take-profit levels around each signal.
How does HalfTrend decide when to flip?
The logic is more elegant than it first appears. HalfTrend tracks the highest high and lowest low over a lookback window (the amplitude) and compares them against a smoothed moving average of price. The trend only reverses when price breaks decisively past the tracked extreme in the opposite direction.
Concretely: while the trend is up, HalfTrend continuously records the maximum low price reached during the move and keeps its line anchored there as rising support. The uptrend stays intact as long as price holds above that level. The moment price closes below the smoothed low extreme by enough margin, the trend flips: the line jumps up above price, turns red, and a red sell arrow prints. The mirror logic applies in a downtrend — HalfTrend tracks the minimum high, holds resistance there, and flips bullish when price breaks above it. Pineify's description matches this exactly: HalfTrend uses the ATR and a short amplitude lookback to decide when price has broken the current structure, flipping to a buy signal with support below when it turns up, and a sell signal with resistance above when it turns down.
The HalfTrend reversal mechanic
The line holds a flat level as support while price trends up. When price breaks decisively below the tracked low, the line steps up, turns red, and a sell arrow prints — with the ATR band giving the stop.
The "half" in HalfTrend refers to this stepping behaviour — the line adjusts in discrete half-steps rather than flowing continuously. That is precisely what gives it its low-noise character. Because the flip requires a decisive break of the tracked extreme rather than a simple cross of an average, HalfTrend ignores the small pullbacks that would repeatedly trip a naive moving-average system.
Which HalfTrend settings actually matter?
HalfTrend has just two meaningful inputs, which is part of its appeal.
| Setting | What it controls | Practical effect |
|---|---|---|
| Amplitude | The lookback for tracking highs and lows (default 2) | Higher amplitude = smoother line, fewer signals, more lag. Lower = more responsive, more signals, more whipsaw. Many crypto traders prefer 3 over the default 2 for fewer false flips. |
| Channel Deviation | The ATR multiplier for the high/low bands (default 2) | Higher = wider ATR channel, looser stops and targets. Lower = tighter channel, closer stops. Sets how far the ribbon sits from the line. |
| Show Arrows / Channels | Toggle the buy/sell arrows and ATR ribbon | Cosmetic — turn on what you need. Most traders keep arrows on and the channel visible for stop placement. |
How do you read HalfTrend arrows and ATR bands?
HalfTrend's output is deliberately unambiguous. A blue arrow pointing up marks the first bar of a new uptrend — the line has flipped to support beneath price. A red arrow pointing down marks the first bar of a new downtrend — the line has flipped to resistance above price. These are discrete events, not a continuous stream, which is what makes HalfTrend feel so clean compared with oscillator-based signals.
The ATR channel is where the practical trade management lives. On a blue (bullish) signal, the lower ATR band gives you a logical stop-loss level beneath the trend line, while the upper band can serve as an initial take-profit or trailing reference. The relationship inverts on a red signal. Because the bands are ATR-based, they widen automatically in volatile conditions and tighten in calm ones — so your stops adapt to the market rather than being fixed.
Three Ways to Trade HalfTrend
Arrow reversal trading
Enter on the blue/red arrow, place your stop beyond the opposite ATR band, and exit on the next opposite arrow. Simple and mechanical — best on higher timeframes where flips are cleaner.
Trend filter, faster entry
Use HalfTrend colour only to set trend direction, then take entries from a pullback to the line or a faster trigger in that direction. This filters out counter-trend trades, HalfTrend's most reliable use.
Confluence with structure
Take HalfTrend arrows only when they align with an order block, a fair value gap, or a liquidity sweep. A reversal arrow at a key level is far stronger than one in open space.
Is HalfTrend better than SuperTrend?
HalfTrend is often compared with the SuperTrend, since both are ATR-based trend flippers. The differences are subtle but real.
| Dimension | SuperTrend | HalfTrend |
|---|---|---|
| Core logic | ATR trailing stop offset from price | Tracks swing highs/lows, flips on decisive break |
| Line behaviour | Trails continuously with price | Holds flat, steps in discrete half-moves |
| Reversal signal | Colour flip of the stop | Explicit blue/red arrows |
| Built-in stops | The stop line itself | ATR high/low channel bands |
| Noise in ranges | Whipsaws | Whipsaws, but the flat line resists minor pullbacks |
Where does HalfTrend fail?
HalfTrend is a trend indicator, so it shares the universal trend-indicator weakness: ranging markets produce whipsaw. When price chops sideways, the line will flip back and forth and the arrows will fire in both directions, none of them leading anywhere. Trading every arrow in a range is the classic HalfTrend mistake.
The second issue is lag. LiteFinance is candid about this — HalfTrend responds to significant price fluctuations but is slightly lagging, as is typical for trend indicators, and it should not be relied on in isolation. The arrow always appears after the reversal has begun, so you trade the confirmation, not the exact turn. That is an acceptable trade-off for a trend filter, but it means HalfTrend should be paired with structure or a faster trigger for entries, and works best on H1 and higher timeframes where noise is lower. Several practitioners note the same thing: it performs best as a trend filter and reversal-confirmation tool rather than a signal to take on autopilot.
A Worked Example: Catching a Reversal With HalfTrend
Suppose a stock has been in a red HalfTrend downtrend for several days, the line sitting above price as resistance. Price makes a lower low, then rallies hard and closes above the tracked minimum-high level. HalfTrend flips: the line steps down beneath price, turns blue, and a blue buy arrow prints. A disciplined trader does not buy the arrow candle blindly; they check that the flip coincides with a real level — say a demand order block or a swept low — and only then enter long, placing the stop just below the lower ATR band.
From there, management is mechanical. The blue line trails as dynamic support; as long as price holds above it, the long stays open. The upper ATR band offers a first take-profit reference, and the final exit comes when price closes back below the line and a red arrow prints. This is HalfTrend at its best — a clean reversal signal, a built-in stop from the ATR band, and a defined exit, all from one indicator.
Notice how much work the single indicator does in that example. The arrow told you when, the flip colour told you which direction, the ATR band told you where to place risk, and the opposite arrow told you when to leave. That self-contained completeness is exactly why HalfTrend has endured while flashier tools come and go — it answers the four questions a trend trade actually needs answered, without asking you to interpret a busy oscillator. The discipline it demands is simply to wait for the arrow to appear on a closed bar and to respect the range warning when arrows start clustering. Do that, and HalfTrend becomes one of the calmest trend tools you can put on a chart.
How does HalfTrend fit into a wider trading system?
HalfTrend shines as a trend gate with built-in trade management inside a structure-based system. Let its colour and arrows answer "which way, and has it just turned?" while Smart Money Concepts answer "where exactly do I enter?" Take a HalfTrend blue arrow only when price is reacting from a demand order block or filling a bullish fair value gap, and use the ATR band for your stop. Stack it with a liquidity sweep and you have a reversal arrow that fires right where institutions have just cleared stops — one of the highest-quality setups a trend indicator can give you.
• Order block detection — HalfTrend arrows that line up with institutional demand and supply zones
• Liquidity sweep alerts — reversal arrows confirmed by a genuine stop raid, not range chop
• FVG identification — entries timed by fair value gap fills in the HalfTrend direction
• Multi-timeframe bias — HTF HalfTrend colour aligned with your lower-timeframe entries
• Smart alerts — notified when a HalfTrend arrow meets SMC confluence
◆ Trade cleaner reversals with structure behind them
QuantumAlgo combines trend context with Smart Money Concepts — order blocks, fair value gaps, and liquidity sweeps — plus a verified public track record so every signal is accountable.
See the indicator →Verify the track recordFrequently Asked Questions
HalfTrend is a trend-following reversal indicator, originally authored on TradingView by everget, that plots a stable colour-coded line from smoothed highs and lows. The line is blue in an uptrend and red in a downtrend, prints a buy or sell arrow at each reversal, and includes an ATR channel for stop-loss and take-profit levels.
It tracks the highest high and lowest low over an amplitude lookback and compares them against a smoothed average. While trending up it holds its line at the maximum low as support; when price breaks decisively below the tracked low it flips, the line steps above price, turns red, and a sell arrow prints. The mirror logic produces buy signals in downtrends.
A blue arrow pointing up marks the first bar of a new uptrend, with the line now acting as support beneath price. A red arrow pointing down marks the first bar of a new downtrend, with the line acting as resistance above price. They are discrete reversal signals, not a continuous stream.
The amplitude is the main dial: 2 is the default, but many traders prefer 3 or 4 on volatile assets like crypto for fewer false flips. Channel deviation (default 2) sets how wide the ATR bands sit and therefore your stop/target distance. Higher amplitude means a smoother line with more lag; lower means faster but noisier signals.
The HalfTrend line and its arrows are confirmed on bar close and do not repaint historically once a bar completes. As with any trend tool, you should act on closed-bar signals rather than an in-progress bar, since the current bar's state can still change before it closes.
Amplitude is the lookback period used to track the highest highs and lowest lows that define the trend. A higher amplitude smooths the line and reduces the number of signals but adds lag; a lower amplitude makes the indicator more responsive but produces more whipsaw in choppy conditions.
Channel deviation is the ATR multiplier that sets how far the high and low bands sit from the HalfTrend line. A higher value creates a wider channel with looser stops and targets; a lower value creates a tighter channel. It affects trade management, not the timing of the signals.
Because it is a trend-following indicator, it whipsaws in ranging or sideways markets, flipping colour and firing arrows in both directions without a real trend developing. It also lags, since it confirms a reversal after price has already turned. Filtering signals through a higher timeframe or a structure confluence removes most false flips.
Both are ATR-based trend flippers, but SuperTrend trails continuously as an offset stop from price, while HalfTrend holds a flat line and steps in discrete half-moves, tracking swing highs and lows. HalfTrend also gives explicit blue/red arrows and an ATR channel, whereas SuperTrend's signal is the colour flip of its stop line.
It works on any timeframe but performs best on H1 and higher, where there is less market noise and the arrows are cleaner. On lower timeframes, expect more whipsaw and use a higher amplitude or multi-timeframe confirmation to filter the signals.
Yes, and it is recommended. HalfTrend works best as a trend filter combined with a momentum tool like RSI or MACD to confirm strength, or with Smart Money Concepts levels for precise entries. Using it alongside a second confirmation greatly reduces the false signals it produces in ranges.
Use HalfTrend's colour and arrows to define trend and reversal, then take entries only when a blue arrow aligns with a demand order block or bullish fair value gap, or a red arrow aligns with supply, mirrored for shorts. An arrow that fires right after a liquidity sweep of an obvious high or low is an especially high-quality signal.
References & Related Guides
Primary and authoritative sources used in this guide:
- ◆ TradingView — HalfTrend scripts & indicator setup notes
Community documentation of the amplitude/channel-deviation inputs and reversal logic (original by everget). - ◆ LiteFinance — Half Trend Indicator: Strategies and Usage
Clear walkthrough of the blue/red arrow signals and the indicator's lagging nature. - ◆ Investopedia — Average True Range (ATR)
Reference on the volatility measure behind HalfTrend's channel bands and adaptive stops. - ◆ Investopedia — Trend Analysis
Background on trend-following methodology and why confirmation tools lag the turn.