Volume Flow Indicator (VFI): Formula, Settings and How to Read It
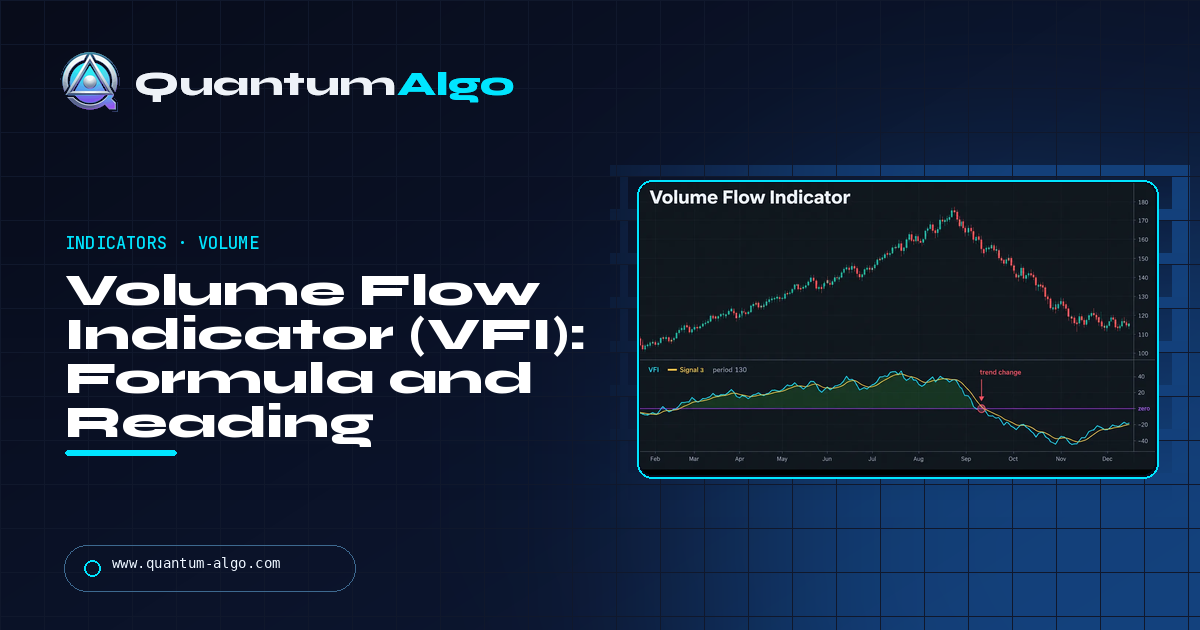
The Volume Flow Indicator (VFI) is a directional volume oscillator by Markos Katsanos: it adds volume on bars where the typical price rose by more than a volatility-scaled cutoff, subtracts it on bars where it fell by more than the cutoff, ignores the rest, caps any bar's volume at 2.5 times average, and divides the 130-bar sum by average volume. Above zero, volume has flowed in on the bars that mattered; the zero cross is a regime change and a lower high in VFI against a higher high in price is distribution. It fixes On-Balance Volume's two flaws — counting one-tick closes in full and letting one giant bar dominate — and it is a slow confirmation tool, not an entry signal.
VFI is the volume indicator I use when I want to know whether a trend that has run for months still has money behind it, and I use it because it ignores most bars on purpose. That filter is the point, and it is why the line changes sign a few times a year rather than a few times a week. This page is the formula with the two filters explained, the settings, how to read the sign, the cross and the divergence, the comparison with OBV, CMF and CVD, a BTCUSDT daily top worked through the divergence and the cross, and where the indicator has no business being used. The calculator runs Katsanos' full chain on pasted bars.
Indicators that prove themselves in public.
One engine, four precision tools — the Gold (XAU) Scalper, the institutional Gravity Zone, the Zeno momentum Oscillator, and Zeno Stocks for equities.



What the Volume Flow Indicator measures
The Volume Flow Indicator — VFI — is a directional volume oscillator: it adds volume on bars where price rose meaningfully, subtracts it on bars where price fell meaningfully, ignores bars where the move was too small to count, caps the contribution of any single huge-volume bar, and expresses the sum over a long window relative to average volume. Above zero, more volume has flowed in than out on the bars that mattered; below zero, the reverse. Markos Katsanos published it in Technical Analysis of Stocks & Commodities in June 2004 as a fix for the two things wrong with On-Balance Volume.
Those two things: OBV counts every bar the same regardless of how far price moved, so a day that closed up by one tick on heavy volume adds all of that volume to the running total; and OBV lets one enormous bar — a rebalance, a liquidation cascade, a news spike — dominate the line for weeks. VFI's cutoff removes the first problem and its volume cap removes the second. The result is a line that changes sign rarely and, when it does, usually means something.
What it does not do: it is slow by design. The default period is 130 bars — six months on a daily chart — and it will not catch a two-week move. It is a regime tool, a confirmation that the volume behind a trend is real, and a divergence tool at turns. It is not an entry signal.
The formula, and the two filters
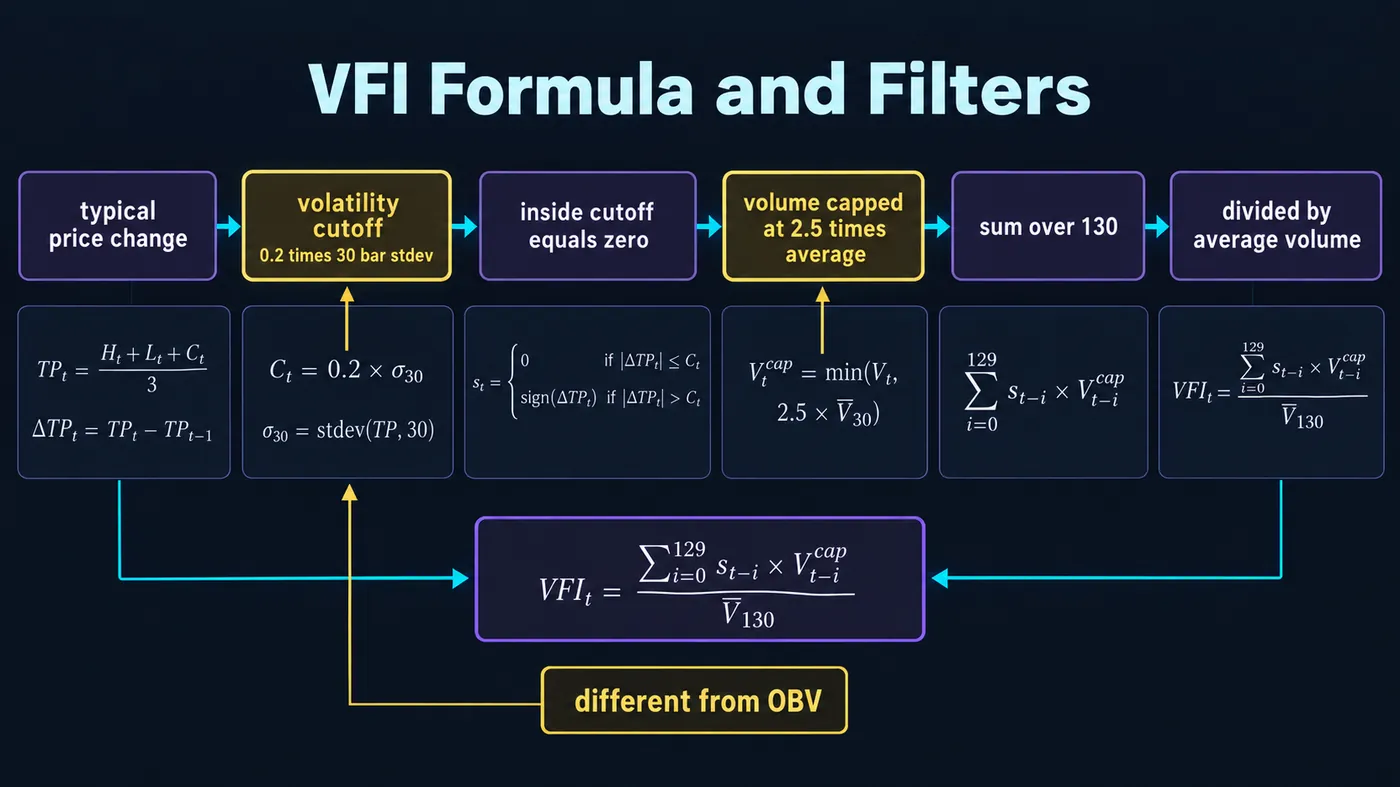
| Step | Formula | Default |
|---|---|---|
| 1. Typical price | (high + low + close) ÷ 3 | — |
| 2. Log change | ln(typical) − ln(typical of the prior bar) | — |
| 3. Volatility | Standard deviation of the log change over 30 bars | 30 |
| 4. Cutoff | coef × volatility × close | coef = 0.2 |
| 5. Volume cap | min(volume, vcoef × average volume over the period) | vcoef = 2.5 |
| 6. Signed volume | +capped volume if the typical-price change exceeds the cutoff; −capped volume if it is below −cutoff; 0 otherwise | — |
| 7. VFI | Sum of signed volume over the period ÷ average volume over the period | period = 130 |
| 8. Smoothing (optional) | EMA of VFI over 3; a signal line | 3 |
The cutoff is the clever part. It scales with the instrument's own volatility, so "too small to count" means one thing on a bond future and another on a meme coin, and it adapts as volatility changes. A coefficient of 0.2 throws out roughly the smallest fifth of moves; Katsanos found that removing them improved the signal more than any smoothing did. The volume cap at 2.5× average is the second defence: a bar with ten times normal volume still counts as 2.5×, so a single event cannot own the line.
| Use | Period | Coef | Vcoef | Smoothing | Note |
|---|---|---|---|---|---|
| Default (Katsanos) | 130 | 0.2 | 2.5 | 3 | Daily stocks and indices; six months of data |
| Daily crypto | 130 | 0.2 | 2.5 | 3 | Keep it; crypto's volume spikes are exactly what the cap is for |
| 4H crypto and futures | 130–180 | 0.2 | 2.5 | 3–5 | Longer period for 24-hour noise; 130 × 4H is three weeks |
| Faster regime read | 50–65 | 0.2 | 2.5 | 3 | More zero crosses; use only with a price-structure filter |
| Long-term investing | 260 | 0.2 | 2.5 | 5 | A year of daily bars; changes sign a few times a decade |
How to read it
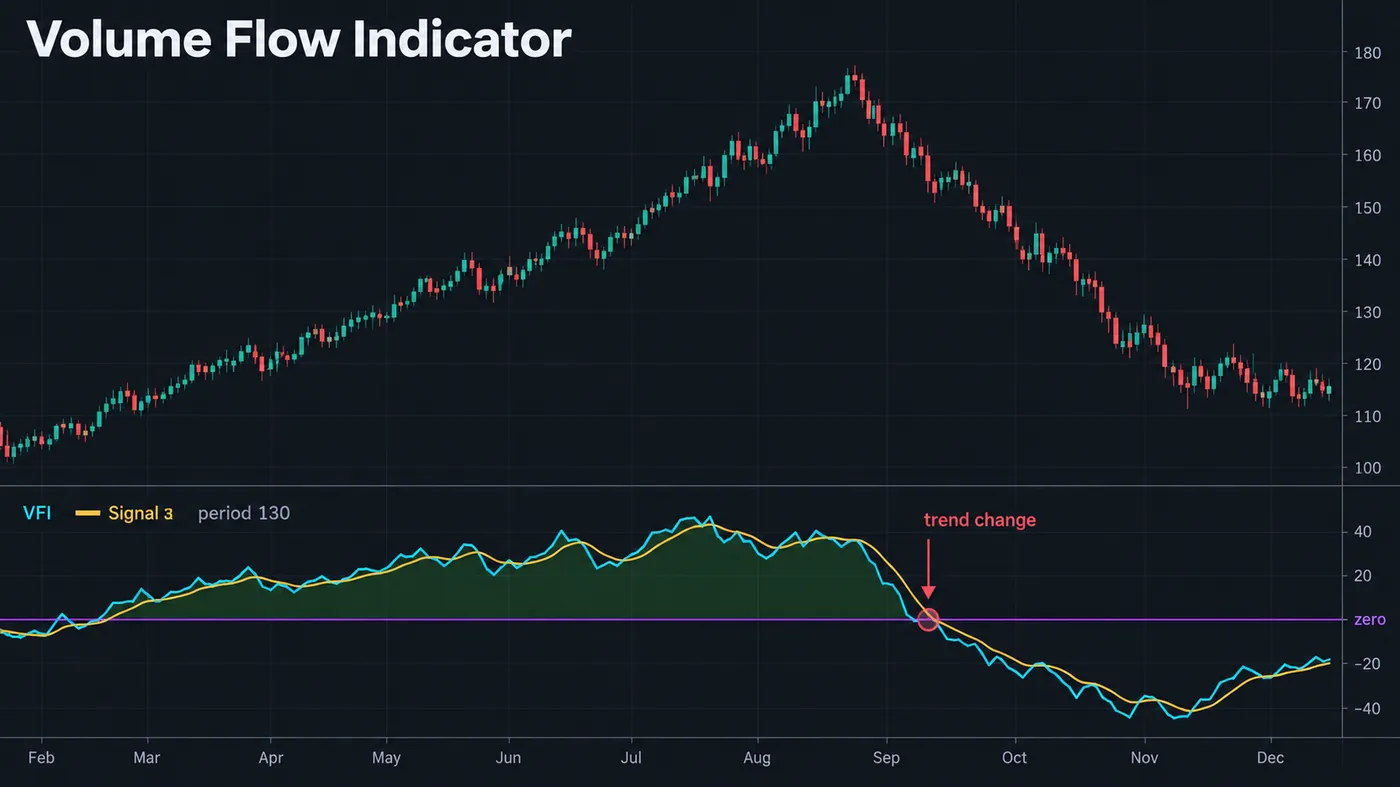
The sign. Positive VFI says the volume behind the last 130 bars was net buying on the bars that moved. Katsanos' original rule was simply: long when VFI is above zero, flat or short when below. On daily index and large-cap charts that rule alone has a respectable record because the line changes sign so rarely; on faster charts it needs the filters below.
The zero cross. The regime change. A cross from negative to positive after a long negative stretch is the volume equivalent of a structure shift — it says the flow has turned, and it usually lags the price turn by a few bars, which is fine, because it is there to confirm, not to lead.
Divergence. Price making a new high while VFI makes a lower high is the reading that pays best: the trend is continuing on less directional volume, which is what distribution looks like from the volume side. Because VFI is filtered, its divergences are fewer and cleaner than OBV's.
The signal line. A 3-period EMA of VFI. Crosses of the raw line over the signal are the fast version of the reading and are only useful inside a trend already confirmed by the sign.

Automate your trades. Let Quantum Algo trade for you.
Every signal executed on your own account — on your account, with the plan you define.
VFI calculator
Paste bars as high, low, close, volume and the tool runs the full Katsanos chain — typical price, log change, 30-bar volatility, the cutoff, the volume cap, the signed sum — and reports the VFI, whether it crossed zero on the last bar, how many bars fell inside the cutoff, and whether the last three bars disagree with the total. The preloaded sample is an uptrend ending in a high-volume sell-off.
VFI versus OBV, CMF and CVD
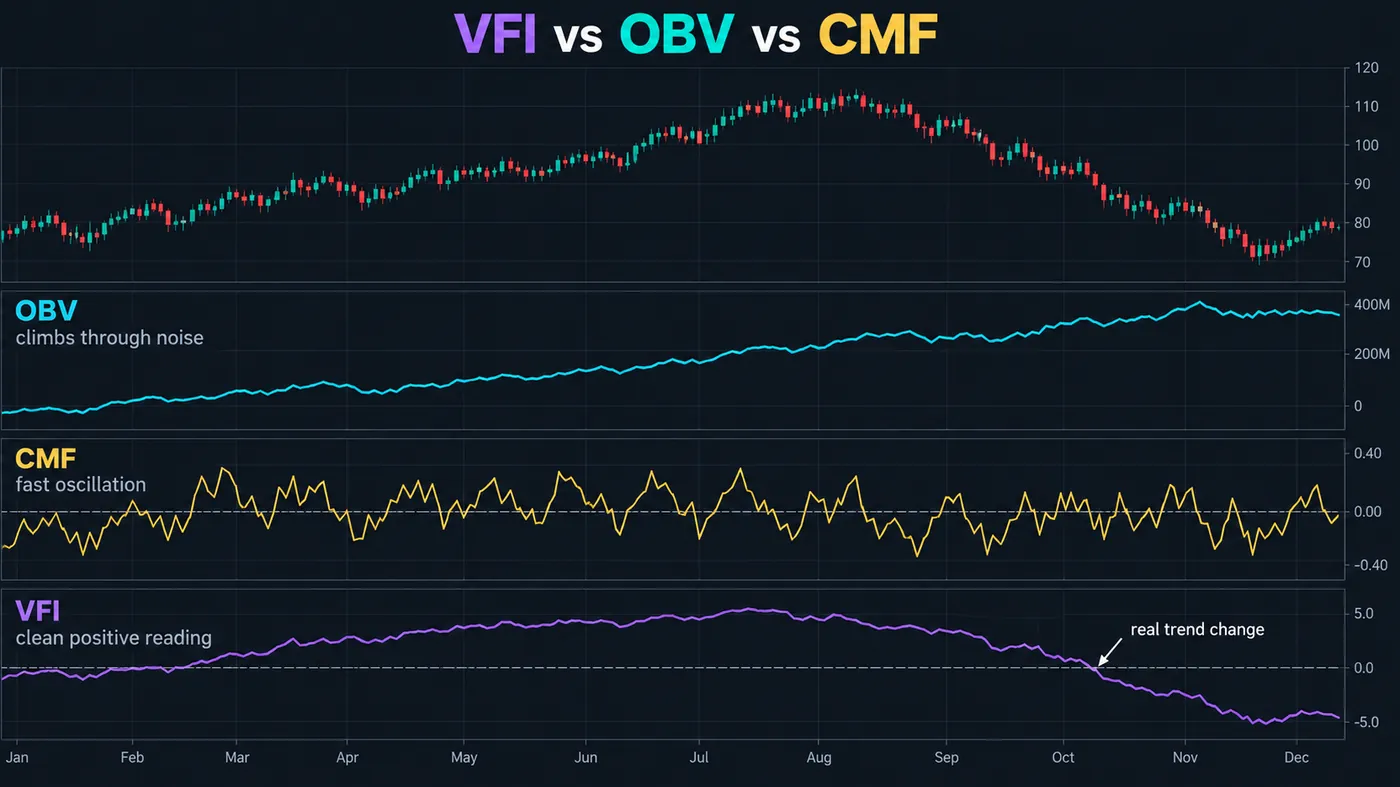
| Indicator | What it sums | Filter | Speed | Weakness VFI addresses |
|---|---|---|---|---|
| VFI | Capped volume on bars that moved beyond a volatility cutoff | Cutoff + cap | Slow (130) | — |
| OBV | All volume, signed by close vs prior close | None | Cumulative | One-tick closes count fully; one giant bar dominates |
| Chaikin Money Flow | Volume weighted by where the close sits in the bar's range | Position in range | Fast (20–21) | Reacts to every candle; ignores bar-to-bar direction |
| CVD | Aggressor buy volume minus sell volume, from the tape | None | Tick-level | Needs tick data; VFI works from OHLCV bars |
| MFI | Typical price × volume, as an RSI | RSI bounding | Fast (14) | Bounded oscillator; VFI is unbounded and shows magnitude |
The practical division: CVD for intraday order-flow reading where tick data exists, CMF for a fast volume-position read on any chart, VFI for the slow question of whether the volume behind a multi-month trend is still there. They do not replace each other, and stacking all three as "confluence" adds nothing because they measure different things at different speeds.
Reference data
| Item | Value |
|---|---|
| Origin | Markos Katsanos, "Using Money Flow to Detect Trends", Technical Analysis of Stocks & Commodities, June 2004 |
| Input | High, low, close, volume |
| Core formula | Σ (signed, capped volume over the period) ÷ average volume over the period |
| Cutoff | coef (0.2) × 30-bar stdev of log typical-price change × close |
| Volume cap | vcoef (2.5) × average volume |
| Default period | 130 bars |
| Signal line | EMA 3 of VFI |
| Reads as | Net directional volume that survived both filters; positive = inflow |
| Primary use | Regime (sign), zero cross as confirmation, divergence at turns |
| Not for | Entries on its own; short timeframes; instruments without real volume (spot forex, CFDs) |
| TradingView | Community "Volume Flow Indicator" scripts (search VFI); not a built-in |
Worked example: BTCUSDT daily, the sign, the divergence and the cross
BTCUSDT daily with VFI at 130/0.2/2.5. After a four-month uptrend VFI stood at +14.8 — comfortably positive; the volume on the up-days that cleared the cutoff had outweighed the down-days three to one. Price made a new high at 71,900 on day 0. Eleven days later it made a higher high at 73,400; VFI printed +9.2, a lower high. Divergence. Not a short — a warning to stop adding and tighten the stop to the last daily higher low at 68,300.
Day 19: a 7% down day on 3.4× average volume. The cap limited it to 2.5×, so it did not swing VFI by itself, but it was the first of six down-days in eight that cleared the cutoff. VFI fell to +2.1 by day 26 and crossed below zero on day 31 with the close at 64,100. The higher low at 68,300 had already gone on day 24; the zero cross confirmed what price had said a week earlier, which is what it is for. Flat since day 24, short from day 31 on the cross with the stop above the day-29 lower high at 67,200, target the prior range low at 58,200: 5,900 points for 3,100 of risk, 1.9R, filled on day 44.
What VFI did not do: it did not call the top. It said the volume behind the last leg was thinner (the divergence), it stayed positive through the first week of selling (the cutoff and the cap kept it from panicking), and it changed sign a week after structure broke. A trader wanting a leading indicator would call that late; a trader wanting confirmation that a 4-month regime had ended would call it exactly right.
Where VFI fails
Markets without real volume. Spot forex, CFDs and most index CFDs report tick volume or broker volume, not traded volume. VFI on those is arithmetic on noise. Use it on futures, exchange-traded stocks and ETFs, and centralised crypto exchange data.
Short timeframes. Below 1-hour the cutoff removes most bars and the line is driven by a handful of prints. It is a daily and 4-hour tool.
Sharp V-reversals. A 130-bar window takes weeks to change sign. In a crash-and-recover, VFI turns negative near the low and positive near the recovery high — the worst possible timing. Read the divergence, not the cross, in fast markets.
Over-fitting the coefficients. The 0.2 cutoff and 2.5 cap are Katsanos' tested values. Tuning them per symbol finds noise. If the indicator is too slow, change the period; leave the filters.
Illiquid names. On a thin small cap or altcoin one block trade can be 40% of the period's volume; even capped, it distorts. Require a liquid instrument.
Mistakes traders make with VFI
- Trading the zero cross as an entry on its own. It is confirmation; the entry comes from structure.
- Using it on forex or CFDs. No traded volume, no VFI.
- Shortening the period to 20. That is not a faster VFI, it is a different and worse indicator.
- Ignoring the divergence because the line is still positive. The divergence is the earliest and best read it gives.
- Removing the cap because "big volume matters". The cap is why VFI is not OBV.
- Stacking it with OBV and CMF. Three answers to three questions is not confluence.
VFI and the free indicators
VFI is not a TradingView built-in; several community scripts implement Katsanos' formula faithfully and the calculator above lets you check one against the original. In the library, the Pressure Oscillator is the fast volume-pressure read that pairs with VFI's slow one, and the Institutional Volume Profile shows where the volume VFI is counting actually sat. The Multi-Oscillator Divergence Scanner catches the divergences on the faster oscillators while VFI's divergence builds. The premium engine, Zeno, prints buy and sell signals with a stop and targets; a Zeno sell signal on a day VFI has just crossed below zero after a divergence is a regime-change trade with the volume behind it.
Directional volume with the noise removed. Bars that barely moved contribute nothing, bars with absurd volume contribute a capped amount, and what is left is summed over six months and read against zero. Positive is a regime, the zero cross is its end, and a lower VFI high against a higher price high is the earliest warning it gives. Use it on daily and 4-hour charts of instruments with real volume, keep 130/0.2/2.5, and let structure supply the entry.
◆ Interactive check
Do you know what VFI ignores?
Questions traders ask about the Volume Flow Indicator
A directional volume oscillator published by Markos Katsanos in 2004. It sums volume on bars where the typical price rose by more than a volatility-based cutoff, subtracts it on bars where it fell by more than the cutoff, ignores the rest, caps each bar's volume at 2.5 times average, and divides the 130-bar total by average volume. Above zero is net inflow; below is net outflow.
Typical price = (high + low + close) ÷ 3; log change from the prior bar; 30-bar standard deviation of that change; cutoff = 0.2 × that deviation × close; volume capped at 2.5 × the period's average; signed capped volume where the typical-price change exceeds ± the cutoff, zero otherwise; VFI = the 130-bar sum ÷ average volume; optionally smoothed with a 3-period EMA.
Katsanos' tested defaults: period 130, cutoff coefficient 0.2, volume coefficient 2.5, smoothing 3. On 4-hour crypto and futures use 130 to 180; for a faster regime read 50 to 65 with a structure filter; for long-term work 260. Change the period, not the coefficients.
OBV adds a bar's full volume whenever the close is above the prior close, however small the move, and never caps volume, so one giant bar can dominate for weeks. VFI ignores bars whose move fell inside a volatility cutoff and caps any bar at 2.5 times average. The result changes sign far less often and its divergences are cleaner.
Use the sign as regime — positive supports longs, negative supports shorts or flat — and the zero cross as confirmation that a regime has ended, after price structure has already broken. Treat a lower VFI high against a higher price high as distribution: stop adding, tighten stops. Entries come from the chart; VFI confirms.
On daily and 4-hour BTCUSDT and ETHUSDT charts from a major exchange, yes — crypto's volume spikes are what the cap exists for. On thin altcoins a single block can distort even the capped reading, and on low timeframes the cutoff removes most bars.
No. Spot forex and CFDs report tick or broker volume, not traded volume, so the arithmetic has no meaning. Use it on futures (including currency futures), exchange-traded stocks and ETFs, and centralised crypto exchange data.
Lagging by design. With a 130-bar window it confirms regime changes a few bars to a couple of weeks after price structure breaks. Its one early read is divergence — a lower VFI high against a higher price high — which precedes the cross.
Not as a built-in. Several community scripts implement the Katsanos formula; check that a script uses the volatility cutoff and the volume cap, since some "VFI" scripts are simplified OBV variants. The calculator on this page lets you verify a script's output against the original.
Not a standalone. The Pressure Oscillator is the fast volume-pressure read that pairs with VFI's slow one, the Institutional Volume Profile shows where the counted volume sat, and the Multi-Oscillator Divergence Scanner covers the faster divergences. Zeno, the premium engine, prints signals with stops and targets.
References & Related Guides
Read next
- On-Balance Volume (OBV)
- Chaikin Money Flow
- Cumulative Volume Delta (CVD)
- Money Flow Index (MFI)
- Best Volume Indicators
- Klinger Oscillator
- Volume Spread Analysis (VSA)
- Divergence Trading
- Pressure Oscillator (free indicator)
- Institutional Volume Profile (free indicator)
- Multi-Oscillator Divergence Scanner (free indicator)
- Zeno — the premium engine
Primary sources
- Katsanos, "Using Money Flow to Detect Trends", Technical Analysis of Stocks & Commodities, June 2004
- Katsanos, Intermarket Trading Strategies (Wiley, 2008) — VFI in system context
- Granville, New Strategy of Daily Stock Market Timing (1976) — On-Balance Volume, the indicator VFI fixes
- TradingView: community scripts search (Volume Flow Indicator)