Among all Fibonacci retracement levels, the 0.618–0.65 zone — known as the "Golden Pocket" — stands above the rest. This narrow band consistently attracts institutional orders and produces the highest-probability reversal entries across all markets and timeframes.
Before the method, the tool most of our readers pair the golden pocket with — Quantum Algo Zeno on gold, Bitcoin and NAS100, exported straight from TradingView.



Indicators that prove themselves in public.
One engine, four precision tools — the Gold (XAU) Scalper, the institutional Gravity Zone, the Zeno momentum Oscillator, and Zeno Stocks for equities.
Why the Golden Pocket Works
The 0.618 level (the golden ratio) appears throughout nature and mathematics. In markets, it represents the deepest retracement that typically occurs during a healthy trend continuation. When price pulls back to 0.618 of the previous impulse move, it signals that the correction is complete and the trend is likely to resume. The 0.65 level adds a small buffer, creating a zone rather than a single line.
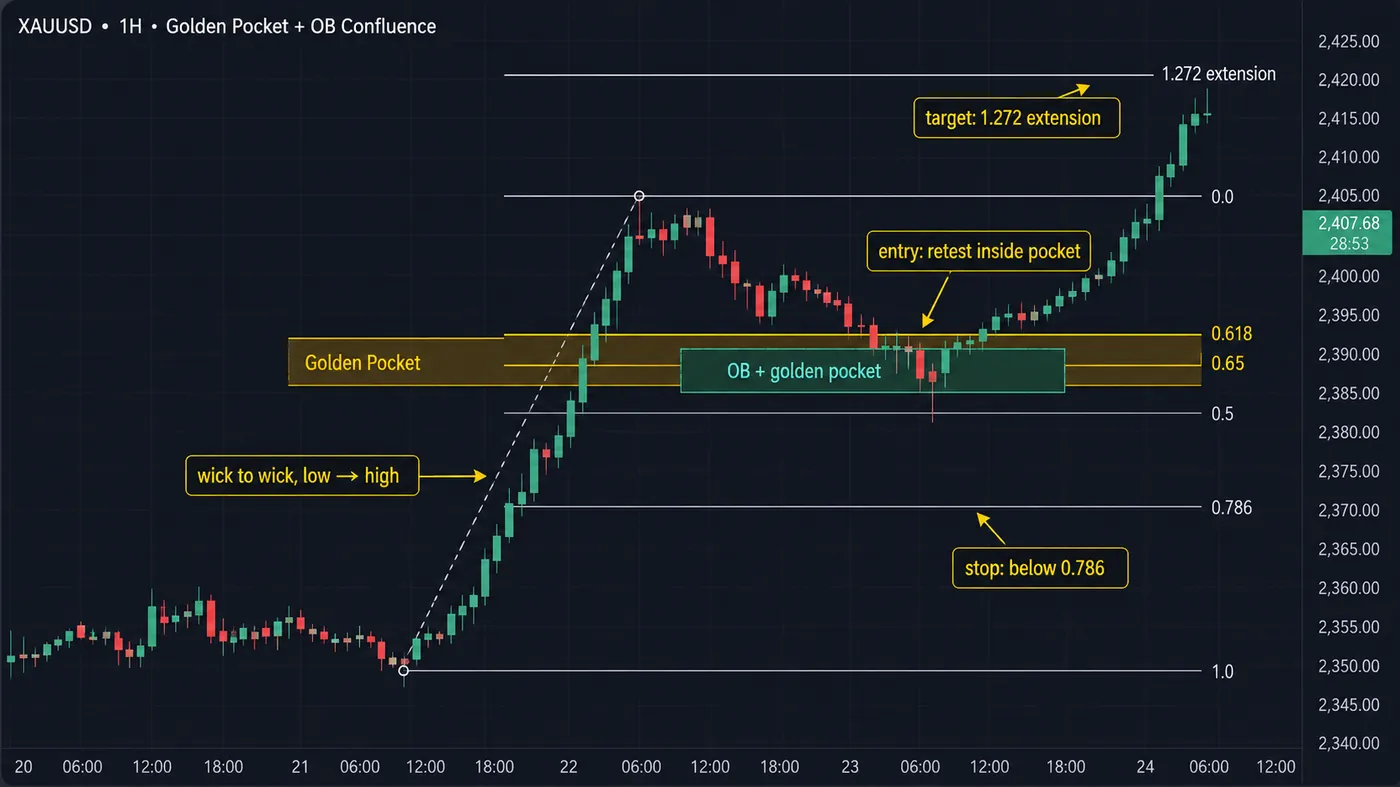
Golden Pocket + Order Blocks: Maximum Confluence
The most powerful setup occurs when the Golden Pocket overlaps with an unmitigated order block. Here's why: the Fibonacci level represents mathematical retracement probability, while the order block represents actual institutional order placement. When both agree on the same price zone, you have structural AND mathematical confluence — the highest-probability entry in all of trading.
How to Trade the Golden Pocket
Step 1: Identify a clear impulsive move (a strong BOS). Step 2: Draw Fibonacci from the swing low to the swing high (for longs) or high to low (for shorts). Step 3: Mark the 0.618–0.65 zone. Step 4: Check if an order block or FVG exists within or near this zone. Step 5: Enter at the Golden Pocket with stop loss below the 0.786 level. Target: the previous swing high/low or the next liquidity level.

Automate your trades. Let Quantum Algo trade for you.
Every signal executed on your own account — on your account, with the plan you define.
Common Mistakes with Fibonacci
The biggest mistake is drawing Fibonacci from the wrong swing points. Always use the most recent significant impulse move — the one that created a Break of Structure. Drawing Fibonacci from minor swings produces unreliable levels. Quantum Algo's automatic structure detection helps identify the correct swing points for Fibonacci application.
Why the 0.618–0.786 Zone Is Statistically Significant
The "golden pocket" is the retracement zone between the 0.618 and 0.786 Fibonacci levels. This zone gets its name from the golden ratio (phi ≈ 1.618), whose inverse (0.618) forms the lower boundary. Statistical analysis across thousands of retracement moves shows that when a strong impulse is followed by a pullback, the pullback most frequently reverses within this golden pocket zone. The reason is partly mathematical (Fibonacci ratios appear throughout natural systems) and partly self-fulfilling (so many traders watch this zone that their orders create the reaction).
In practical terms, the golden pocket represents a deep discount within a trending move. In an uptrend, price retracing to the 0.618–0.786 zone has given back 62–79% of the impulse move, putting the entry at a significant discount relative to the trend. The risk is relatively small (stop below the 0.786 or the impulse origin) while the reward target (a new higher high) is large. This asymmetry is what makes the golden pocket consistently attractive to institutional traders who think in terms of risk-adjusted returns.
Drawing Fibonacci Correctly: The #1 Mistake
The most common error with Fibonacci analysis is incorrect anchor point selection. The Fibonacci retracement tool should be drawn from a significant swing low to a significant swing high (for bullish setups) or swing high to swing low (for bearish setups). "Significant" means a swing point that resulted in a clear Break of Structure, not just any minor pivot. Drawing Fibonacci from the wrong anchor points produces levels that have no institutional significance, leading to entries at zones where no actual order flow exists.
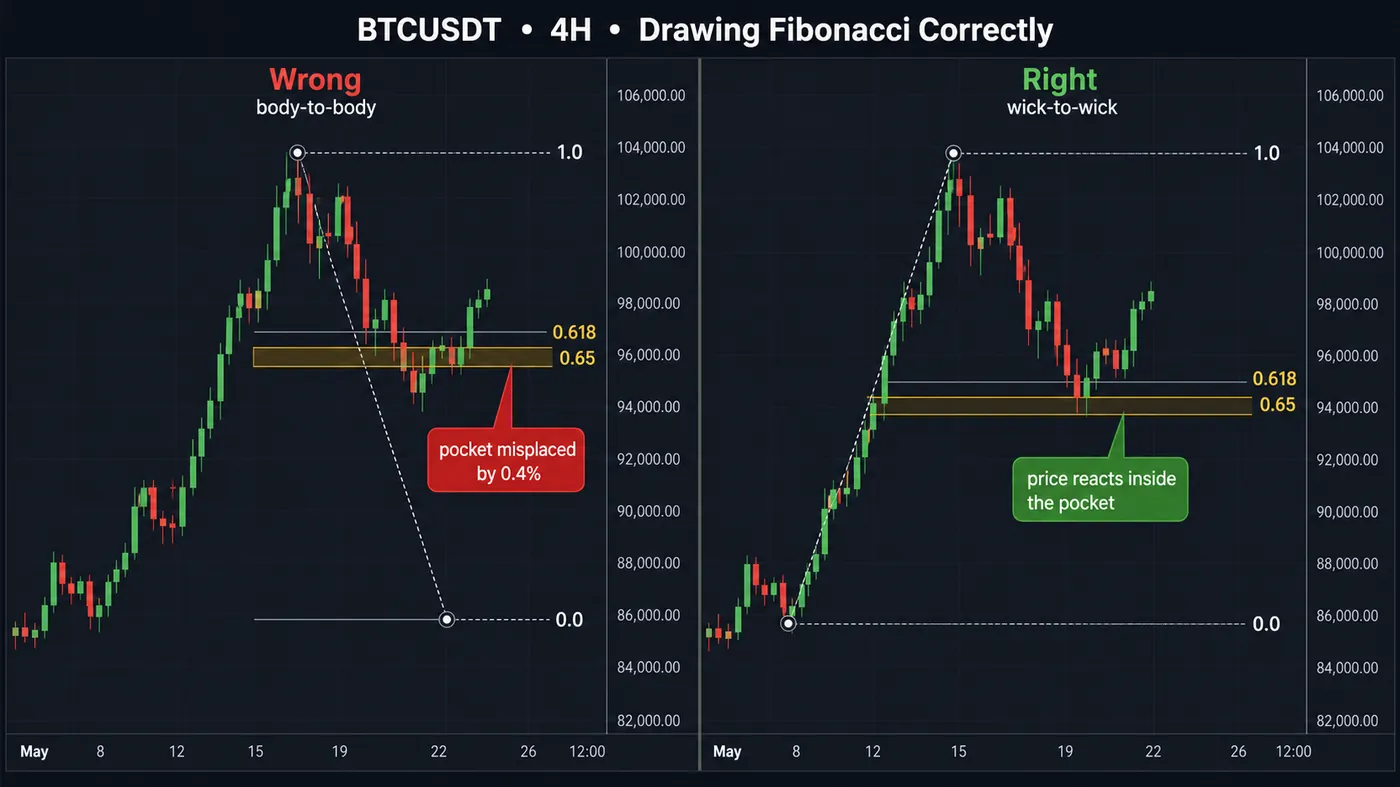
Another frequent mistake is drawing Fibonacci on every minor swing. Fibonacci levels are most reliable when drawn on impulse legs that break structure. If a move does not create a BOS, the Fibonacci levels of that move carry less weight because the move itself was not driven by institutional commitment. Limit your Fibonacci analysis to the most significant structural moves on your trading timeframe, and the golden pocket levels will align with genuine institutional interest zones far more consistently.
Golden Pocket + Order Block: The Ultimate Confluence
When a Fibonacci golden pocket overlaps with an unmitigated order block on the same timeframe, you have one of the highest-probability setups in all of technical analysis. The golden pocket tells you that price is at a statistical reversal zone. The order block tells you that institutional orders are resting at that level. Together, they provide both quantitative (Fibonacci) and qualitative (institutional footprint) evidence that the zone will produce a reaction.
To find these setups, first draw your Fibonacci on the most recent structural impulse. Then check whether any unmitigated order blocks fall within the 0.618–0.786 zone. If an order block sits inside the golden pocket, highlight that overlapping area as your primary entry zone. Place a limit order at the 0.705 level (the midpoint of the golden pocket), set your stop below the 0.786 level or the order block low, and target the previous swing high for a minimum 1:2 R:R. This setup does not appear daily, but when it does, it is among the most reliable trades you can take.
Fibonacci Extensions for Target Setting
While the golden pocket gives you entries, Fibonacci extensions give you targets. The most commonly watched extension levels are 1.272, 1.618, and 2.618. After entering at the golden pocket, set your first take-profit at the 1.0 level (the end of the previous impulse — a return to the swing high for longs). Set your second take-profit at the 1.272 extension. If momentum is strong and the trend is well-established, hold a trailing portion targeting the 1.618 extension, which represents a full Fibonacci expansion of the original impulse.
The 1.618 extension is particularly significant because it is the level where Wave 3 of Elliott Wave Theory often terminates. If your golden pocket entry catches the beginning of Wave 3, the 1.618 extension provides a structurally meaningful target that coincides with a natural exhaustion point. This synergy between Fibonacci tools (retracement for entry, extension for target) creates a complete trade framework that is internally consistent and mathematically coherent.
Golden Pocket Across Market Conditions
The golden pocket performs differently in trending versus ranging markets. In strong trending conditions, price often retraces only to the 0.382 or 0.5 level rather than reaching the 0.618–0.786 golden pocket. If you wait for the golden pocket in every case, you will miss many trend continuation entries. A practical approach is to set alerts at both the 0.5 level and the golden pocket, then use lower-timeframe structure to determine which zone is producing the reaction.
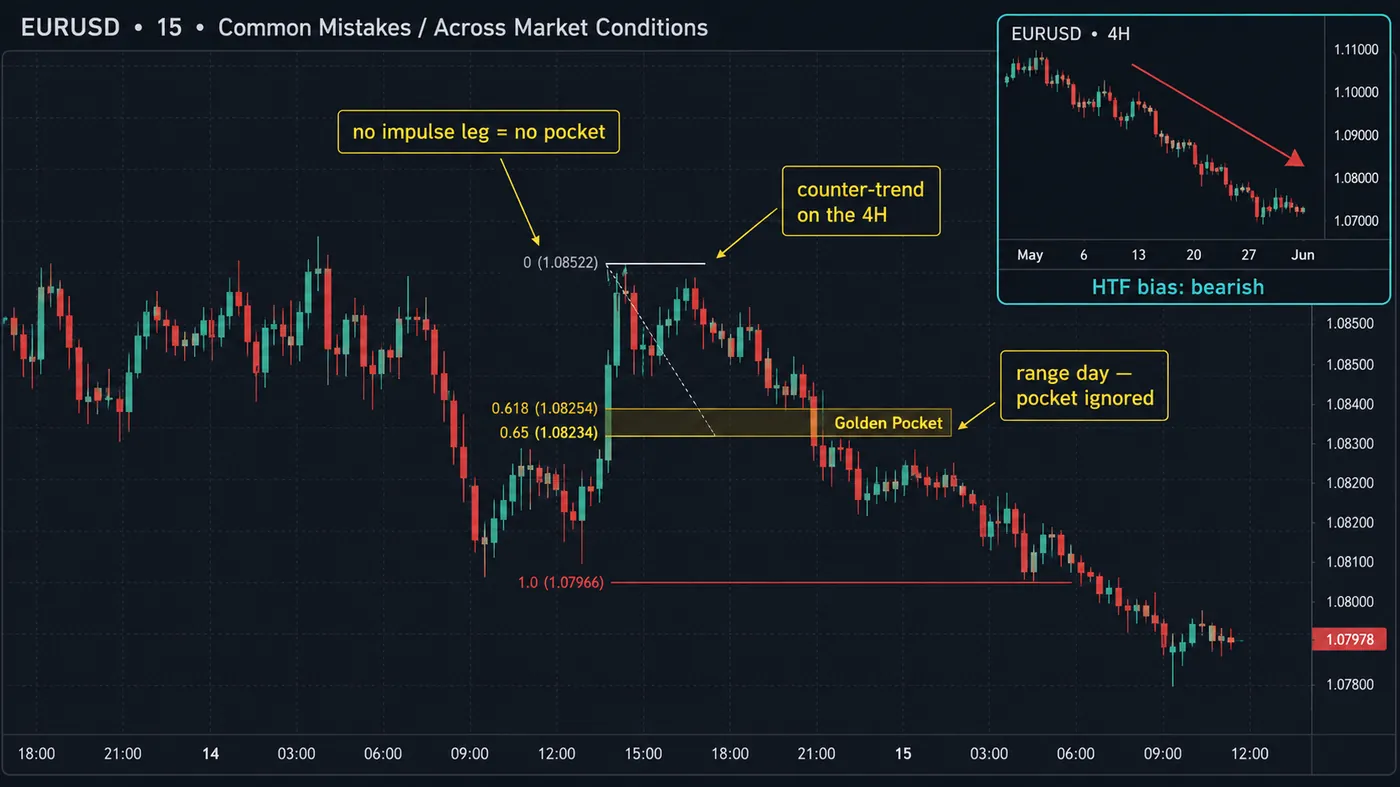
In volatile, choppy conditions, price frequently overshoots the golden pocket and retraces all the way to the 0.786 or even the origin of the impulse. In these conditions, the golden pocket may provide a temporary bounce followed by further retracement. Adjust your approach by requiring stronger confirmation (a clear CHoCH on the entry timeframe rather than just a candle pattern) and using a wider stop that accounts for the deeper volatility wicks that characterize choppy markets.
Key Takeaways
Understanding Fibonacci golden pocket trading provides a meaningful addition to your trading toolkit, but the real value emerges only when you integrate these concepts with a structured methodology like Smart Money Concepts. No single indicator, pattern, or analytical concept produces consistent profitability in isolation. The concepts covered in this guide become powerful when they serve as one layer in a multi-confirmation system that includes higher-timeframe directional bias, institutional zone identification, and disciplined risk management.
The most important practical step is to backtest before you trade live. Take the concepts from this guide and apply them to historical price data using TradingView's bar replay feature. Walk through at least 50 setups, recording the entry, stop, target, and outcome for each. This backtesting exercise accomplishes two things: it builds your pattern recognition for the specific setup types discussed in this article, and it gives you empirical data on the setup's actual performance — win rate, average R:R, and maximum drawdown — that you can use to make informed decisions about incorporating it into your live trading plan.
Quantum Algo’s free indicators draw the order blocks and fair value gaps the pocket should line up with; Zeno adds the confirmed entry, stop, TP1 and TP2 on the chart — $112.86 $79/mo, cancel anytime. Every call is published timestamped on TradingView, nothing deleted.
Your Next Steps
Now that you have a solid understanding of combining golden pocket entries with order block confluence, the next step is implementation. This week, dedicate 30 minutes per day to chart markup practice focused specifically on the concepts covered in this guide. Use the daily and 4-hour charts of your primary trading assets. Mark every relevant setup you can find, then track how price interacts with those levels over the next few sessions. This deliberate practice builds the visual pattern recognition that eventually becomes automatic during live trading.
After two weeks of chart markup practice, begin incorporating these setups into your demo trading or your live trading with minimal position sizes. Start with your single highest-conviction setup type and trade only that setup for 30 consecutive trades. After 30 trades, review your journal data: which setups produced the best R:R? Which sessions were most productive? Which assets showed the cleanest patterns? Use this data to refine your approach, eliminate underperforming variants, and concentrate on the specific combinations that your data shows work best for your trading style and market.
Finally, remember that mastery is a journey measured in months and years, not days and weeks. The traders who achieve lasting success are the ones who commit to continuous improvement through consistent practice, honest self-assessment, and evidence-based refinement. Every session of chart markup, every journaled trade, and every weekly review compounds your skill and brings you closer to the level of unconscious competence where profitable trading becomes second nature. Stay patient, stay disciplined, and trust the process.
The golden pocket is a probabilistic tool, not a guarantee. It works because enough institutional traders reference the 0.618–0.786 zone that their collective orders create a self-fulfilling reaction. But like all probabilistic tools, it fails roughly 30–35% of the time. The key to profitability is not avoiding failures — that is impossible — but managing them through proper risk management. Keep your stop below the 0.786 level, accept the occasional loss as a business expense, and let the 65–70% of golden pocket trades that work compound your account over time. The math is firmly on your side when you combine a high-probability zone with disciplined risk management and a minimum 1:2 R:R target.
The golden pocket entry technique works because it combines mathematical probability with institutional behavior. The 0.618–0.786 zone represents a statistical sweet spot for trend pullbacks, and when that zone overlaps with an SMC order block, the confluence creates one of the most reliable setups in all of technical analysis. Master the golden pocket as a primary retracement entry method, use Fibonacci extensions for target setting, and always confirm with lower-timeframe structural triggers. This disciplined approach to Fibonacci trading provides consistent, high-R:R entries that compound into significant account growth over time.
The Golden Pocket on a Live Chart
Here is the zone doing its job on BTCUSDT. The retracement is anchored from the swing high to the swing low, and the levels that matter — 0.5, 0.618 and 0.705 — are the band where price decides whether the pullback is a pause or a reversal.
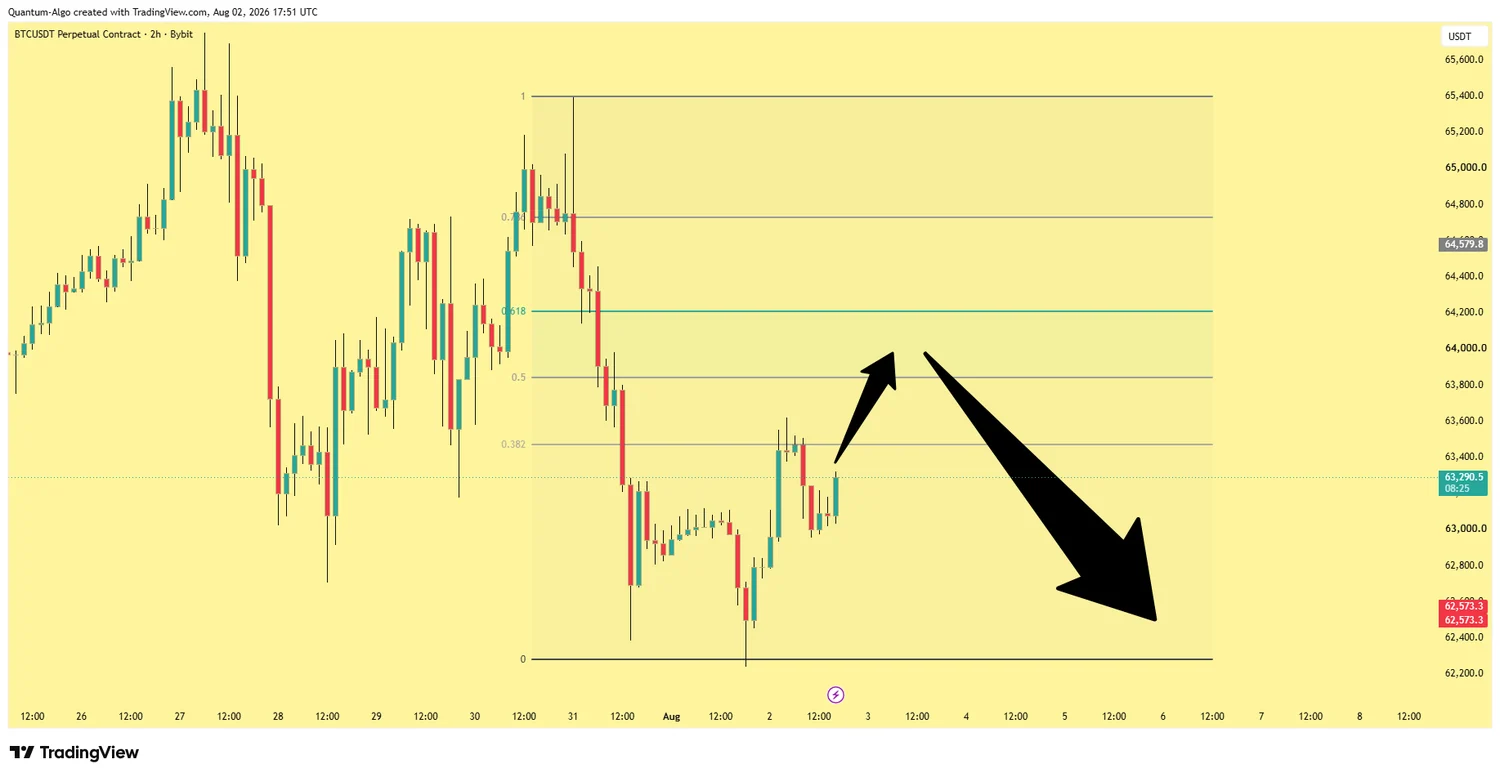
Anatomy of the golden pocket
Anchor high to low for a bullish retracement. The pocket is deliberately narrow — a zone you can define a stop against, not a vague half of the chart.
0.618 — the ratio itself
The inverse of phi and the level most institutional algorithms reference. It is the shallow edge of the pocket and often the first place a healthy pullback turns.
0.705 — the deep edge
Slightly deeper than 0.618, used to catch the sweep that runs stops just past the obvious level before reversing. Together they form the band, not a single line.
0.786 — last defence
Below the pocket. Price trading here is still technically a retracement, but the setup is weaker and invalidation is close — many traders treat a close beyond it as the idea failing.
Confluence multiplies it
A golden pocket that overlaps an order block or an unfilled FVG is far stronger than one floating in open space. The Fibonacci is a lens, not a standalone signal.
Why Most Traders Get the Golden Pocket Wrong
The zone works, but only under conditions most people skip. Four errors account for the majority of failed Fibonacci trades.
| Mistake | What goes wrong | The fix |
|---|---|---|
| Anchoring to the wrong swing | Every level lands at the wrong price, so the "pocket" is fiction | Anchor only to confirmed swing highs and lows on your trading timeframe |
| Trading it against the trend | Buying a pocket in a downtrend is catching a knife | Let structure set direction; the pocket only refines where |
| Entering on touch, blind | No evidence the zone is being defended, only that price arrived | Wait for a reaction — rejection candle or lower-timeframe structure shift |
| Using it alone | A level with no confluence is just a line on a chart | Require an order block, FVG, or liquidity sweep in the same zone |
Stop drawing retracements by hand
Quantum Algo maps structure, order blocks and fair value gaps automatically — so you can see instantly whether a golden pocket has real confluence behind it or is floating in empty space.
See the indicator → Free trading calculators