Market Profile Trading: Reading the Auction With TPO, POC and Value
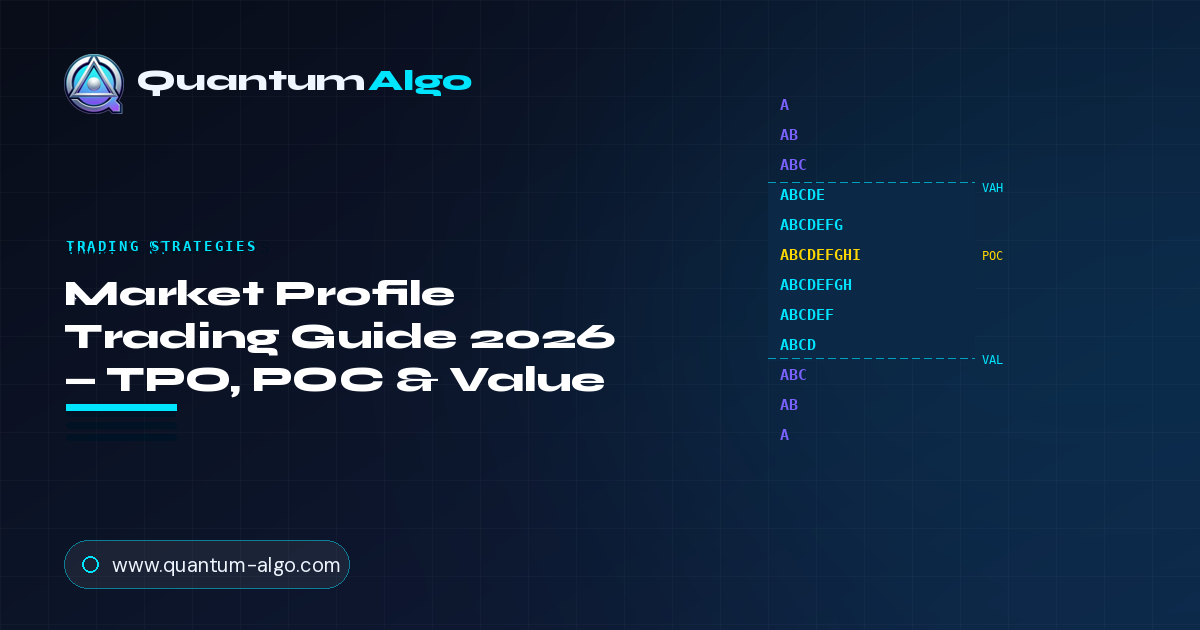
| Tool type | Auction / distribution charting (time at price) |
| Shows | Where the market spent time — accepted vs rejected value |
| Core levels | POC, Value Area High (VAH), Value Area Low (VAL) |
| Best context | Daily / session profiles on liquid instruments |
| Core question | Is the market balancing or trending? |
| Confirmation | Value-area migration + acceptance/rejection at edges |
1. What Is Market Profile?
Market Profile is a way of organising price and time so you can see where a market found value — where it agreed on a fair price and traded there repeatedly — versus where it rejected price and moved on quickly. It was developed by Peter Steidlmayer at the Chicago Board of Trade in the 1980s, and its central idea is unusual: instead of charting price against volume or price against time in the normal way, it charts how much time the market spent at each price level.
The mechanism is elegant. The trading session is divided into equal time brackets — commonly 30 minutes — and each bracket is assigned a letter: A, B, C, and so on. Every price the market touches during bracket A gets an "A" placed next to it; every price touched during bracket B gets a "B", and so on through the session. When you stack all those letters up, prices where the market spent a lot of time accumulate many letters and stick out to the side; prices it barely touched get one or two letters. The result is a distribution — usually a rough bell curve lying on its side.
Those letters are called TPOs — Time Price Opportunities. Each TPO is one unit of "the market offered this price during this time bracket." The profile made of them tells you, at a glance, which prices the market accepted as fair and which it rejected.
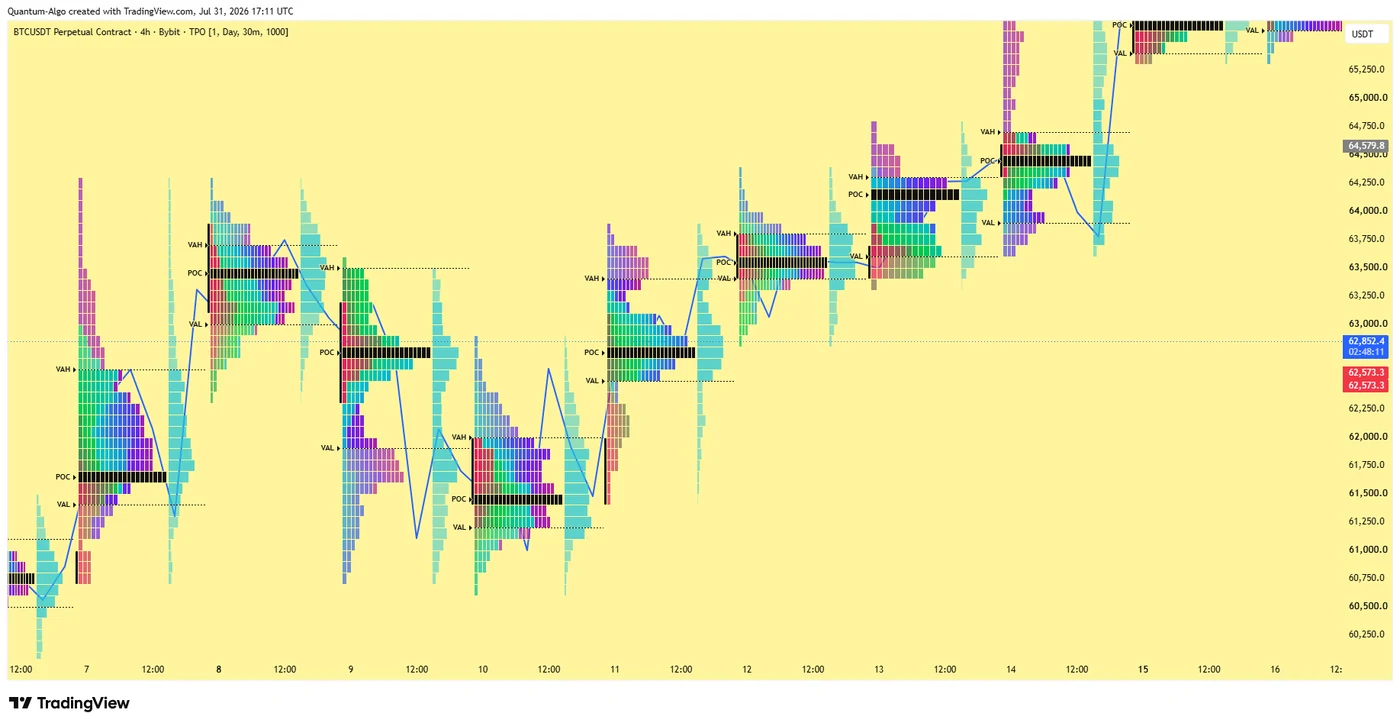
Look at how the profiles in that chart differ in shape. Some are tall and thin — the market moved through those prices without lingering, a sign of trend or rejection. Others are fat and symmetrical — the market parked there and rotated, a sign of balance and acceptance. That shape is the first thing Market Profile tells you, and it is invisible on a normal chart. Two days can have identical open-high-low-close and completely different profiles, and the profile is what tells you whether the day was a one-way move or a grind.
2. POC, Value Area, and the Shape of a Profile
Three reference points do most of the work. Learn them and you can read any profile.
Point of Control (POC)
The price with the most TPOs — the widest row of the profile. It is the session's fairest price, where the most time and agreement occurred. The POC acts as a magnet: price tends to return to it, and it is a primary reference for the next session. A shift in the POC from one day to the next signals where perceived value is migrating.
Value Area (VAH / VAL)
The price range containing roughly 70% of the session's TPOs, bounded by the Value Area High and Value Area Low. This is where the market considered price fair. Its edges are decision points: price accepted back inside signals balance; price rejected at an edge signals the value area will hold.
Tails (excess)
The thin, single-print extremes at the top and bottom of a profile — prices touched briefly and rejected hard. A long tail marks strong rejection and a level the market defended. Tails often become support and resistance because they mark where one side decisively took control.
Profile shape
A fat, symmetrical bell = balance and acceptance (a rotational day). A thin, elongated profile = imbalance and trend (a directional day). A double-distribution (two bells) means the market found value at two different prices — often a breakout from one to another. Shape is the fastest read of what kind of day it was.
3. The Auction: Balance, Imbalance and Acceptance
Market Profile rests on a single idea borrowed from auction theory: a market is a two-way auction that is always doing one of two things — building value (balancing) or seeking value (trending). Everything the profile shows you is in service of answering which one is happening right now.
When a market balances, it rotates around a price both buyers and sellers accept. The profile fattens into a bell. Auctions to the upside get sold, auctions to the downside get bought, and price oscillates inside a value area. This is the market saying "we agree on fair value; let's trade here." Balance is where mean-reversion strategies work — you fade the edges of the value area back toward the POC.
When a market imbalances, one side overwhelms the other and price leaves the old value area to search for a new one. The profile stretches thin and directional. This is the market saying "the old price is wrong; let's find a new one." Imbalance is where breakout and trend strategies work — you trade with the departure from value, not against it.
Acceptance vs rejection — the key verb
The word that ties it all together is acceptance. When price moves to a new area and the market spends time there — building TPOs, fattening a new distribution — value has been accepted, and the move is real. When price pokes into a new area and immediately leaves, printing only a thin tail, value has been rejected, and price snaps back. The entire discipline of trading Market Profile is judging, in real time, whether a move represents acceptance or rejection.
This is why time matters more than price here. A spike to a new high that lasts one bracket is rejection. A grind to a new high that builds four brackets of TPOs is acceptance. The same price prints; the profile tells you which one happened, and therefore whether to fade it or follow it.
4. Day Types and the Initial Balance
Steidlmayer classified sessions into a handful of day types, and while the taxonomy can get elaborate, a few carry almost all the practical value. Recognising the day type early tells you which playbook to run before the session is even half over.
The starting point is the Initial Balance (IB) — the price range established in the first hour (the first two 30-minute brackets, A and B). The IB is the market's opening statement of where it thinks value is. What happens relative to it defines the day.
Normal / balanced day
A wide Initial Balance that mostly holds. Price rotates inside it, building a fat, symmetrical profile. The market agreed on value early and traded around it. Playbook: fade the value-area edges back toward the POC.
Trend day
A narrow Initial Balance that breaks and never looks back. Price moves one direction all session, building a thin, elongated profile. One side controlled from the open. Playbook: get with the trend on pullbacks; do not fade.
Normal variation day
A moderate IB that gets extended on one side (a "range extension") but then settles. The most common day type. The market probed for value beyond the open, found some, and built value there. Playbook: trade the range extension, then respect the new value area.
Double-distribution day
Price builds value at one level, breaks to a new level, and builds value again — two separate bells joined by a thin migration. The market re-priced mid-session. Playbook: the gap between the two distributions often acts as support/resistance; the second distribution is the new value.
Range extension and single prints
Two features of a developing profile give you the earliest read on day type. Range extension is any move beyond the Initial Balance — it signals that one side is stronger than the open suggested, and the direction of the first meaningful extension often sets the tone for the day. Single prints — price levels with just one TPO — mark fast, one-directional moves that left a vacuum; the market frequently returns to fill them, making them useful targets and support/resistance.

Automate your trades. Let Quantum Algo trade for you.
Every signal executed on your own account — 24/7, hands-off.
5. How to Trade Market Profile
Market Profile is a framework for understanding context, and its strategies fall into two families that mirror the balance/imbalance distinction. Get the context right and the tactics are straightforward.
Family 1 — Trading balance (mean reversion)
When the market is balanced — a fat profile, value being accepted — you fade the extremes back toward fair value. Price rallies to the VAH and stalls: you look for a short back toward the POC. Price drops to the VAL and holds: you look for a long back toward the POC. The POC is your primary target because it is the magnet. Your invalidation is acceptance outside the value area — if price spends real time beyond the VAH or VAL, balance is breaking and the fade is wrong.
Family 2 — Trading imbalance (breakout / trend)
When the market breaks out of a value area and accepts the new price, you trade with the move. The highest-quality version uses yesterday's profile: price breaks above yesterday's value area and builds new TPOs above it — that is acceptance of higher value, and you position for continuation. The failure mode to avoid is trading the breakout before acceptance; a poke above the value area that immediately rejects is not a breakout, it is a fade opportunity in the other direction.
The reference levels that carry between sessions
Much of Market Profile's practical power comes from carrying prior-session levels forward. Yesterday's POC, VAH and VAL become today's reference points, and price's behaviour at them is highly informative:
| Price meets… | Reaction | Read |
|---|---|---|
| Prior POC | Stalls / reverses | Fair value still respected — magnet holding |
| Prior VAH | Rejects lower | Higher prices unaccepted — balance continues |
| Prior VAH | Accepts above | Value migrating up — bullish, trade continuation |
| Prior VAL | Accepts below | Value migrating down — bearish, trade continuation |
| Naked / virgin POC | First touch | Untested POC from a prior day — strong magnet |
A naked (or virgin) POC deserves special mention: a POC from a previous session that price has not returned to since. These act as unusually strong magnets, because the market has unfinished business at that fair-value price. Many Market Profile traders track naked POCs above and below current price as high-probability targets.
Read the profile
Four daily profiles below. Click the one showing a trend day — thin and directional, where the market never settled into a value area.
6. Market Profile vs Volume Profile
These two are constantly confused, and the confusion causes real trading errors. They look similar — both draw a horizontal distribution beside price with a POC and a value area — but they measure fundamentally different things.
| Market Profile (TPO) | Volume Profile | |
|---|---|---|
| Measures | Time spent at each price | Volume traded at each price |
| Building block | TPO (a time bracket letter) | Volume executed |
| POC means | Price with the most time | Price with the most volume |
| Origin | Steidlmayer, CBOT, 1980s | Later evolution, volume-based |
| Best for | Reading the auction: balance vs trend, acceptance | Finding high/low-volume nodes, precise S/R |
The distinction matters because time and volume can disagree. A price where the market spent a lot of time but little volume traded is a different animal from a price with huge volume in a short time. Market Profile's time-based POC tells you where the market was comfortable; Volume Profile's volume-based POC tells you where the most business changed hands. In fast electronic markets, many traders lean on Volume Profile for level precision while using Market Profile's concepts — value areas, acceptance, day types, balance vs trend — as the interpretive framework.
They are complementary, not competing. If you have already read our Volume Profile guide, think of Market Profile as the auction-theory lens that explains why those volume nodes matter: a high-volume node is a price the market accepted, which is exactly a value area in TPO terms. Learn both and you read the same distribution through two windows.
7. Setting Up Market Profile on TradingView
Market Profile is well supported on modern charting platforms, including a TPO/Time Price Opportunity chart type and session-volume-profile tools on TradingView. The chart shown throughout this guide is a daily TPO profile rendered exactly as you would use it — one profile per day, with POC, VAH and VAL marked automatically.
Choose your session
Decide what one profile represents — a day, a week, or a custom session. Daily profiles (as in the example chart) are the standard for swing and day trading. For 24-hour markets like crypto, pick a consistent daily boundary (many use 00:00 UTC) so profiles are comparable day to day.
Set the TPO bracket
The classic bracket is 30 minutes, which is what the example uses. Shorter brackets add detail but noise; longer brackets smooth the profile. 30 minutes on a daily session is the well-tested default — start there before customising.
Enable value area + levels
Turn on the value area shading and POC/VAH/VAL labels. These are the levels you actually trade, so they should be visible at a glance. Carrying prior-session levels forward — a setting on most tools — is what lets you use yesterday's profile to trade today.
Combine with price action
Overlay the profile on a normal candlestick chart (as the example does, with the blue price line) so you see the auction and the price action together. Market Profile is context; your candlestick chart is the timing.
One honest caveat about the crypto application: Market Profile was designed for regulated futures markets with a clear daily session and centralised volume. Crypto trades 24/7 across fragmented venues, so the "session" is a convention you impose rather than a natural boundary, and single-venue profiles miss flow on other exchanges. None of this breaks the tool — the auction logic still holds — but treat crypto value areas as slightly softer than their futures equivalents, and prefer liquid instruments where a single venue's profile is representative.
8. Test Your Knowledge
Seven questions covering TPOs, value areas, day types, and how to trade the auction.
9. Combine Market Profile With Smart Money Concepts
Market Profile tells you where value is and whether the market is balancing or trending. Smart Money Concepts tell you where liquidity sits and when structure has shifted. They describe the same market from two traditions — auction theory and institutional order flow — and the overlap between them is remarkably tight.
Consider the equivalences. A Market Profile value-area edge where price rejects is, in SMC terms, a level defended by resting orders — often exactly where an order block sits. A single-print vacuum the market rushes to fill is a fair value gap by another name. Acceptance above a prior value area is the auction-theory version of a bullish break of structure. When a naked POC lines up with an order block and a liquidity pool, you have three independent frameworks pointing at the same price — the definition of high-probability confluence.
• Buy/sell signals with built-in SL and TP — structural entries taken at value-area edges and accepted breakouts
• Tidal Force momentum confirmation — tells balance from trend the same way profile shape does
• Order block and FVG detection — the SMC twins of value-area edges and single-print vacuums
• Break of structure mapping — confirms acceptance above or below a prior value area
• Multi-timeframe confluence scoring — so a naked POC that lines up with an order block scores higher
• ATR-based risk management — stops beyond value-area edges, sized to volatility
The habit to build: use Market Profile to read the context — balance or trend, where value is, which edges matter — then use structure and SMC to time the entry at those levels. Neither answers the whole question alone. Together they turn "price is near a level" into "price is near an accepted-value edge that also holds a liquidity pool and an order block," which is a very different quality of setup.
Frequently Asked Questions
Market Profile is a charting method developed by Peter Steidlmayer that organises a trading session by how much time the market spent at each price. The session is divided into 30-minute time brackets, each assigned a letter, and every price touched in a bracket receives that letter. Stacking the letters builds a distribution — usually a bell curve on its side — that shows where the market accepted value and where it rejected price. Each letter is a Time Price Opportunity, or TPO.
A TPO, or Time Price Opportunity, is the basic unit of a Market Profile. It represents one instance of the market offering a particular price during a particular time bracket. If price traded at a given level during the 30-minute A bracket, that level gets an A; during the B bracket, a B; and so on. The count of TPOs at each price builds the profile's shape, and the price with the most TPOs is the Point of Control.
The Point of Control (POC) is the price with the most TPOs — where the market spent the most time, its fairest price. The Value Area is the range containing roughly 70% of the session's TPOs, bounded by the Value Area High (VAH) at the top and the Value Area Low (VAL) at the bottom. These three levels are the primary references for trading Market Profile: price tends to gravitate to the POC, and the value-area edges are decision points for balance versus breakout.
Market Profile measures time — how long the market spent at each price, using TPOs. Volume Profile measures volume — how much traded at each price. Their Points of Control can therefore differ: the Market Profile POC is the most-time price, while the Volume Profile POC is the highest-volume price. Market Profile excels at reading the auction (balance versus trend, acceptance), while Volume Profile excels at precise volume-based support and resistance. They are complementary lenses on the same distribution.
The Initial Balance is the price range established in the first hour of a session — the first two 30-minute brackets (A and B). It represents the market's opening statement of value. What happens relative to it defines the day type: a wide Initial Balance that holds suggests a balanced day, while a narrow one that breaks and extends suggests a trend day. A move beyond the Initial Balance is called range extension and signals which side is stronger than the open implied.
The strategy depends on whether the market is balancing or trending. In balance — a fat, symmetrical profile — you fade the value-area edges (VAH and VAL) back toward the POC, with acceptance outside the value area as your invalidation. In imbalance — a thin, directional profile, or price accepting above/below a prior value area — you trade with the move. Prior-session levels (POC, VAH, VAL) carry forward as references, and naked POCs act as strong magnets and targets.
A naked (or virgin) Point of Control is a POC from a previous session that price has not returned to since it formed. Because the market has unfinished business at that fair-value price, naked POCs act as unusually strong magnets and are widely used as high-probability targets. Traders track naked POCs above and below current price as levels the market is likely to revisit.
Yes, the auction logic holds, but with caveats. Market Profile was designed for regulated futures markets with a clear daily session and centralised volume. Crypto trades 24/7 across fragmented venues, so the daily session is a convention you impose (many use 00:00 UTC) and a single exchange's profile misses flow elsewhere. Use it on liquid instruments where one venue is representative, pick a consistent session boundary, and treat crypto value areas as slightly softer than their futures equivalents.
More guides
References & Related Guides
More in this topic
- Volume Profile Trading Guide 2026 - POC, VAH & VAL
- VWAP 2026 - Complete Volume Weighted Average Price Guide
- Support & Resistance: Complete Trading Guide (2026)
- Range Trading Strategy: Complete Guide (2026)
- Mean Reversion Trading 2026 - Complete Strategy Guide
- Breakout Probability: Complete Trading Guide (2026)
- Day Trading Strategies 2026 - The Complete Profitable Guide
- Trend Trading Strategy: The Complete Guide (2026)
- Wyckoff Method 2026 - Complete Institutional Trading Guide
- Order Flow Trading 2026 - Read the Footprint of Institutions
- Footprint Chart Trading 2026 - Order Flow at Price
- Swing Trading Strategies 2026 - Complete Position Guide
Core reading
- Volume Profile Trading Guide 2026 - POC, VAH & VAL
- Support & Resistance: Complete Trading Guide (2026)
- Smart Money Concepts: The Complete Trading Guide (2026)
- Wyckoff Method 2026 - Complete Institutional Trading Guide
- Risk Management in Trading 2026 - Complete Guide
- All Premium Guides
- Quantum Algo on TradingView
- Public Verified Track Record