Accumulation/Distribution Line: What It Measures, How to Read It, and Where It Misleads
The Accumulation/Distribution line is a running total of each bar's volume weighted by where the bar closed inside its own range: a close at the high adds all the volume, a close at the low subtracts it, a mid-range close adds nothing. Its level is meaningless — read only its direction against price. Rising with price confirms a trend; a higher price high with a lower A/D high is distribution, the one reading worth acting on. It differs from OBV, which scores close-to-close direction rather than intrabar close location, and it is the cumulative version of Chaikin Money Flow.
The A/D line is the volume indicator most platforms put on the chart by default and most traders remove within a week, because its level goes nowhere and its slope looks like price. Both observations are right and both miss the point: it is only ever read against price, and only for the weeks when the two disagree. This page is the multiplier and the running sum, the four readings and which one matters, the comparison with OBV, CMF and VFI, a daily-stock divergence that took six weeks to build, and the gap problem that makes the line unreliable on some instruments. The calculator accumulates the line from pasted bars and says whether it agrees with price.
Indicators that prove themselves in public.
One engine, four precision tools — the Gold (XAU) Scalper, the institutional Gravity Zone, the Zeno momentum Oscillator, and Zeno Stocks for equities.



What the Accumulation/Distribution line measures
The Accumulation/Distribution line — A/D line, ADL — is a running total of volume weighted by where each bar closed inside its range. A bar that closes at its high adds all of its volume; one that closes at its low subtracts all of it; a mid-range close adds nothing. Sum that from the start of the data and you have a line that rises when the market keeps closing strong on volume and falls when it keeps closing weak. Marc Chaikin built it in the early 1980s on Larry Williams' close-location idea, and it is the ancestor of Chaikin Money Flow, which is the same calculation over a rolling window.
Two things follow from the construction. The level of the line is meaningless — it depends on where your data starts — so the A/D line is read only for its direction relative to price. And because it never resets, it has a long memory: a single week of weak closes in a year-long uptrend barely dents it, which is what makes it a trend-confirmation tool rather than a timing tool.
What it is not: it is not On-Balance Volume. OBV asks whether today's close was above yesterday's; the A/D line asks where today's close sat inside today's range. A gap-up day that closes at its low is a full positive for OBV and a full negative for the A/D line. The two disagree often, and when they do, the disagreement is itself information about whether the buying happened between bars (gaps) or within them.
The formula
| Step | Formula | Range |
|---|---|---|
| 1. Money flow multiplier | ((close − low) − (high − close)) ÷ (high − low) | −1 to +1 |
| 2. Money flow volume | multiplier × volume | signed volume |
| 3. A/D line | previous A/D + money flow volume | unbounded, cumulative |
Three bars, same volume of 100: a close at the top of the range contributes +100, a close in the middle contributes 0, a close at the bottom contributes −100. A close three-quarters of the way up contributes +50. The line does not care whether the bar was up or down relative to the previous bar — only where it finished inside itself. That is the whole difference from OBV, and the reason the A/D line reads conviction rather than direction.
How to read it
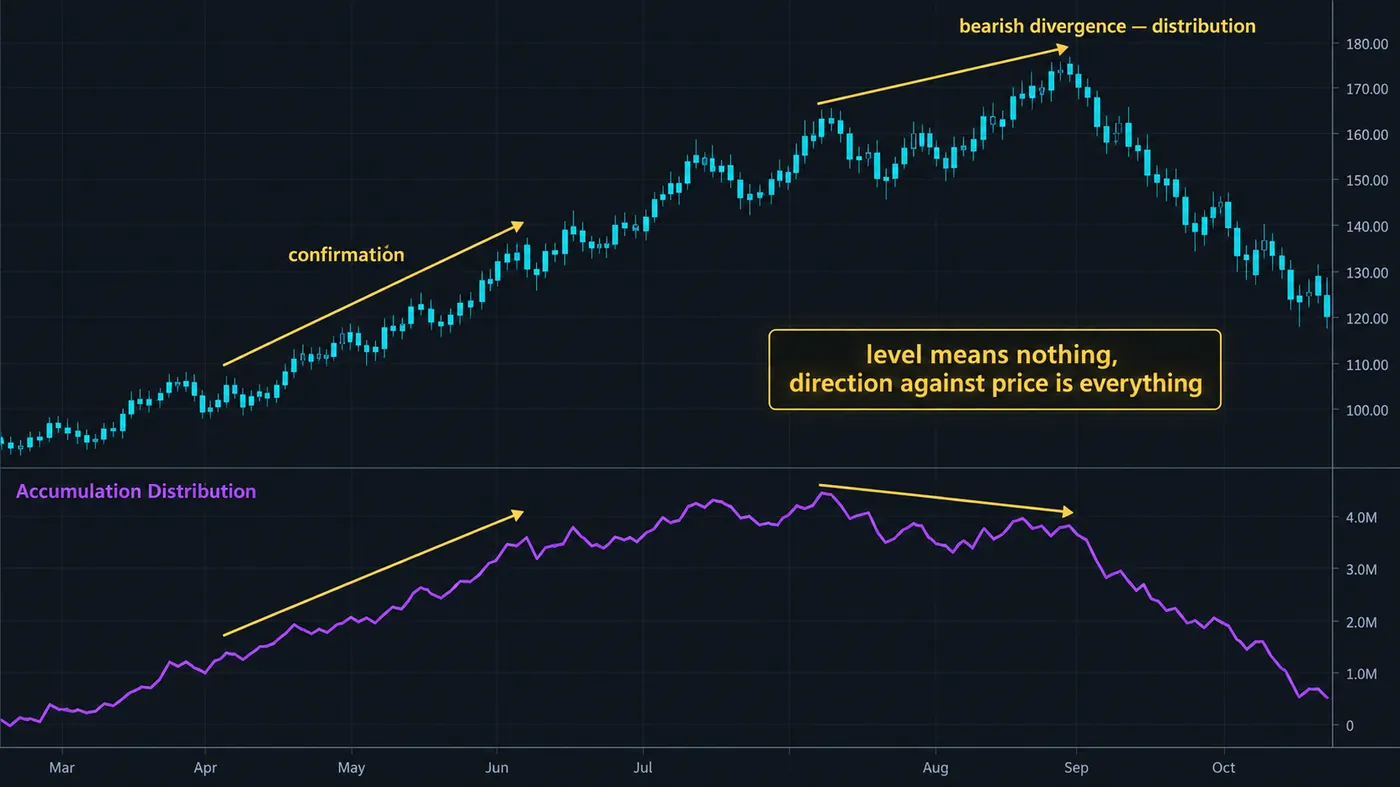
Confirmation. Price makes higher highs and the A/D line makes higher highs: the advance is being made on bars that close in the upper part of their ranges, on volume. Hold. This is the reading most of the time in a healthy trend, and it is not a signal — it is the absence of a warning.
Bearish divergence. Price makes a higher high; the A/D line makes a lower high. The new high was made on bars closing weaker in their ranges — buyers pushing price up and not holding it into the close. It is the one read the line gives that is worth acting on, and it works because the line's long memory means a divergence takes weeks of weak closes to build. Tighten stops, stop adding, look for the structure break.
Bullish divergence. The mirror at lows: price makes a lower low, the line makes a higher low. Sellers are exhausting; the bars are closing off their lows on volume.
The line leading. Price flat in a range while the A/D line climbs: accumulation under a lid. This is the reading that precedes breakouts and the one Chaikin cared about most. It is also the one that fails most in ranges, because a range with an upward drift in closes produces it without any breakout following.
What not to read. The level, the slope in isolation, and any single bar. A crossing of the line above its own moving average is a signal some platforms offer; it is a lagging trend-follow of a lagging indicator and adds nothing the price chart does not.

Automate your trades. Let Quantum Algo trade for you.
Every signal executed on your own account — on your account, with the plan you define.
A/D line calculator
Paste bars as high, low, close, volume and the tool computes the multiplier for each, accumulates the line, and compares the last quarter of the data against the rest: did price make a new high, did the line, and what does the combination mean. The preloaded sample is an uptrend whose last few bars close low in their ranges on the heaviest volume of the series.
A/D line versus OBV, CMF and VFI
| Indicator | Scores each bar by | Accumulates? | Horizon | Best use |
|---|---|---|---|---|
| A/D line | Close location in the bar's range × volume | Yes — never resets | Long | Trend confirmation, multi-week divergence, accumulation under a range |
| OBV | Full volume, signed by close vs prior close | Yes | Long | Trend confirmation on gap-prone instruments |
| Chaikin Money Flow | The same multiplier × volume | No — rolling 20, ÷ volume | Short | Fast divergence, breakout confirmation |
| VFI | Capped volume on bars past a volatility cutoff | No — rolling 130, ÷ volume | Long | Regime, filtered divergence |
The A/D line and CMF are one formula at two horizons; if you run both you will see the same divergence twice, first on CMF and then on the line. The A/D line and OBV are different formulas that agree in trends and disagree around gaps. VFI is the filtered one. One cumulative line and one oscillator is a sensible pair; three cumulative lines is decoration.
Reference data
| Item | Value |
|---|---|
| Origin | Marc Chaikin, early 1980s, on Larry Williams' close-location concept |
| Multiplier | ((close − low) − (high − close)) ÷ (high − low) |
| Line | Cumulative sum of multiplier × volume |
| Level | Meaningless — read direction against price only |
| Primary reads | Confirmation (both rising), bearish divergence (price higher high, line lower high), bullish divergence, line leading a flat price |
| Weakness | Gaps (a gap-up closing weak scores negative); mid-range closes on huge volume score zero; no reset, so a stale divergence can persist |
| Not for | Spot forex and CFDs (no traded volume); intraday timing |
| Relatives | Chaikin Money Flow (rolling), Chaikin Oscillator (EMA 3 − EMA 10 of the A/D line), OBV, VFI |
| TradingView | Built-in "Accumulation/Distribution" |
Worked example: a large-cap stock, daily, a divergence that took six weeks
A liquid US stock, daily bars, the sample in the calculator scaled to a longer run. Price climbed from 184 to 201 over twenty sessions; the A/D line climbed with it through the first fourteen — closes in the top third of their ranges, volume above average on the up days. Confirmation. From session fifteen the character changed: price kept making marginal new highs at 197.4, 199.9 and 200.8, but each of those bars closed in the lower third of its range — multipliers of −0.29, −0.70 and −0.79 — on the heaviest volume of the run. The line topped at session fifteen and made three lower highs while price made three higher ones. That is the divergence in the sample, and the calculator reports it.
Nothing to do yet except stop adding and move the stop under the last daily higher low at 192.0. The structure broke eight sessions later with a close at 191.4; short, or flat if you do not short stocks, with the stop above 201 and the first target at the level the run started from. The line had been diverging for a month by then; the point is not that it timed the top — it did not — but that it said the advance was being sold into the close for four weeks before the chart admitted it.
The same pattern read on OBV would have been muddier: two of the three weak-close bars closed above the prior close, so OBV kept rising. The A/D line saw the intrabar weakness; OBV saw the day-over-day gains. Both were correct about what they measure.
Where the A/D line fails
Gaps. A stock that gaps up 5% and closes at its low scores a large negative, though it rose. On earnings-driven names the line can point the wrong way for a week. Use it on 24-hour markets where gaps are rare, or read it alongside OBV on stocks.
No reset. A divergence that formed six months ago and was never resolved stays in the line. Read divergences over swings of a few weeks, not over the whole history.
Wide-range bars with mid closes. The capitulation day that closes exactly mid-range contributes zero, however large its volume. The most important bar of the month can be invisible to the line.
Ranges. The "line leading price" read fires constantly in ranges with drifting closes and rarely precedes anything. Require a level and a breakout.
Instruments without volume. Spot forex and CFDs. No traded volume, no line.
Mistakes traders make with the A/D line
- Reading the level. It is a running sum from an arbitrary start; only the direction against price matters.
- Trading the divergence as an entry. It is a warning; the entry comes from the structure break.
- Confusing it with OBV. Different formulas; they disagree around gaps, and the disagreement is informative.
- Adding a moving-average cross of the line as a signal. A lagging cross on a lagging line.
- Running it on forex. Tick volume is not volume.
- Stacking it with CMF as confluence. Same formula, two horizons — you will see one divergence twice.
The A/D line and the free indicators
The TradingView built-in is exact and needs no replacement. In the library, the Pressure Oscillator flags the bars the A/D line scores as zeros — heavy volume, little range — which are often the ones that matter, and the Multi-Oscillator Divergence Scanner catches divergences across several oscillators while the A/D line's slower one builds. The Order Blocks with Volume script supplies the level a divergence should form at. The premium engine, Zeno, prints buy and sell signals with a stop and targets; a Zeno sell signal at a structure break after a multi-week A/D divergence is a regime-change trade with the volume record behind it.
Where did the bar close in its range, on how much volume, added up forever. The level means nothing; the direction against price is everything. Confirmation is the default, a multi-week divergence is the warning, and the structure break is the trade. Read it on 24-hour markets or beside OBV on gap-prone stocks, and never on forex.
◆ Interactive check
Do you know what the line adds up?
Questions traders ask about the Accumulation/Distribution line
A cumulative volume indicator by Marc Chaikin. Each bar's volume is weighted by where the bar closed inside its range — +1 at the high, −1 at the low, 0 mid-range — and added to a running total. The line rises when the market keeps closing strong on volume and falls when it keeps closing weak.
Multiplier = ((close − low) − (high − close)) ÷ (high − low). Money flow volume = multiplier × volume. A/D line = previous A/D line + money flow volume. It is cumulative from the first bar of the data and never resets.
Only against price. Both rising is confirmation. Price making a higher high while the line makes a lower high is bearish divergence — distribution. The mirror at lows is bullish divergence. The line rising while price is flat is accumulation under a range. The level itself carries no information.
OBV adds a bar's full volume if the close is above the prior close and subtracts it if below — direction between bars. The A/D line weights volume by where the close sat inside the bar's own range — conviction within the bar. A gap-up that closes at its low is positive for OBV and negative for the A/D line.
Same multiplier, same money flow volume. The A/D line accumulates it forever; CMF sums it over a rolling 20 bars and divides by volume, giving an oscillator between −1 and +1. CMF shows a divergence first; the A/D line shows it later and more slowly.
Its divergences lead structure breaks, often by weeks, because the line's long memory means a divergence takes sustained weak closes to form. Its confirmations are coincident. It does not time entries; the chart does.
Because it scores where bars close in their ranges, not whether price rose. A run of higher highs made on bars closing near their lows produces a falling line under a rising price — which is exactly the situation the line exists to flag.
On daily and 4-hour charts of BTCUSDT and ETHUSDT from a major exchange, yes, and better than on stocks because 24-hour markets rarely gap. On thin altcoins the volume is unreliable and the line with it.
Not on spot forex or CFDs, which report tick or broker volume. Use it on currency futures, exchange-traded stocks and ETFs, and centralised crypto data.
The TradingView built-in is exact. The Pressure Oscillator flags the heavy-volume, small-range bars the line scores as zero; the Multi-Oscillator Divergence Scanner covers faster divergences; Order Blocks with Volume gives the level a divergence should form at. Zeno, the premium engine, prints signals with stops and targets.
References & Related Guides
Read next
- Chaikin Money Flow
- On-Balance Volume (OBV)
- Volume Flow Indicator (VFI)
- Money Flow Index (MFI)
- Best Volume Indicators
- Divergence Trading
- Wyckoff Accumulation
- What Is a Market Structure Shift?
- Pressure Oscillator (free indicator)
- Multi-Oscillator Divergence Scanner (free indicator)
- Accumulation — glossary
- Zeno — the premium engine