Short Interest Explained: Percent of Float, Days to Cover, Reporting Dates and What It Tells Traders

Short interest is the total number of a stock's shares that have been sold short and not yet bought back. Traders read it as a percentage of the float (shares available to trade) and as days to cover, which is short interest divided by average daily volume. In the US it is reported twice a month through FINRA and published about a week later, so it is a lagging snapshot. High short interest shows strong bearish conviction and also the fuel for a possible short squeeze.
Short interest is one of the few numbers that shows what a large group of traders is betting against. It does not tell you the stock will fall, and it does not tell you a squeeze is coming. Read properly, it tells you how crowded the bearish side is and how hard it would be for those traders to get out. Here is how to read it, where it comes from, how stale it is, and how to use it without being misled.
What is short interest?
When a trader sells a stock short, they borrow shares and sell them, planning to buy them back later at a lower price. Until they buy back (cover), those shares count as short. Short interest is the total of all such open short positions in a stock at a point in time, reported in shares.
It is a stock, not a flow: it tells you how much short exposure is open, not how much shorting happened today. Daily short sale volume, which data sites also publish, is a different number and much noisier, because market makers short constantly as part of normal trading. For how a short trade works step by step, see what is short selling.
How do you read short interest as a percent of float?
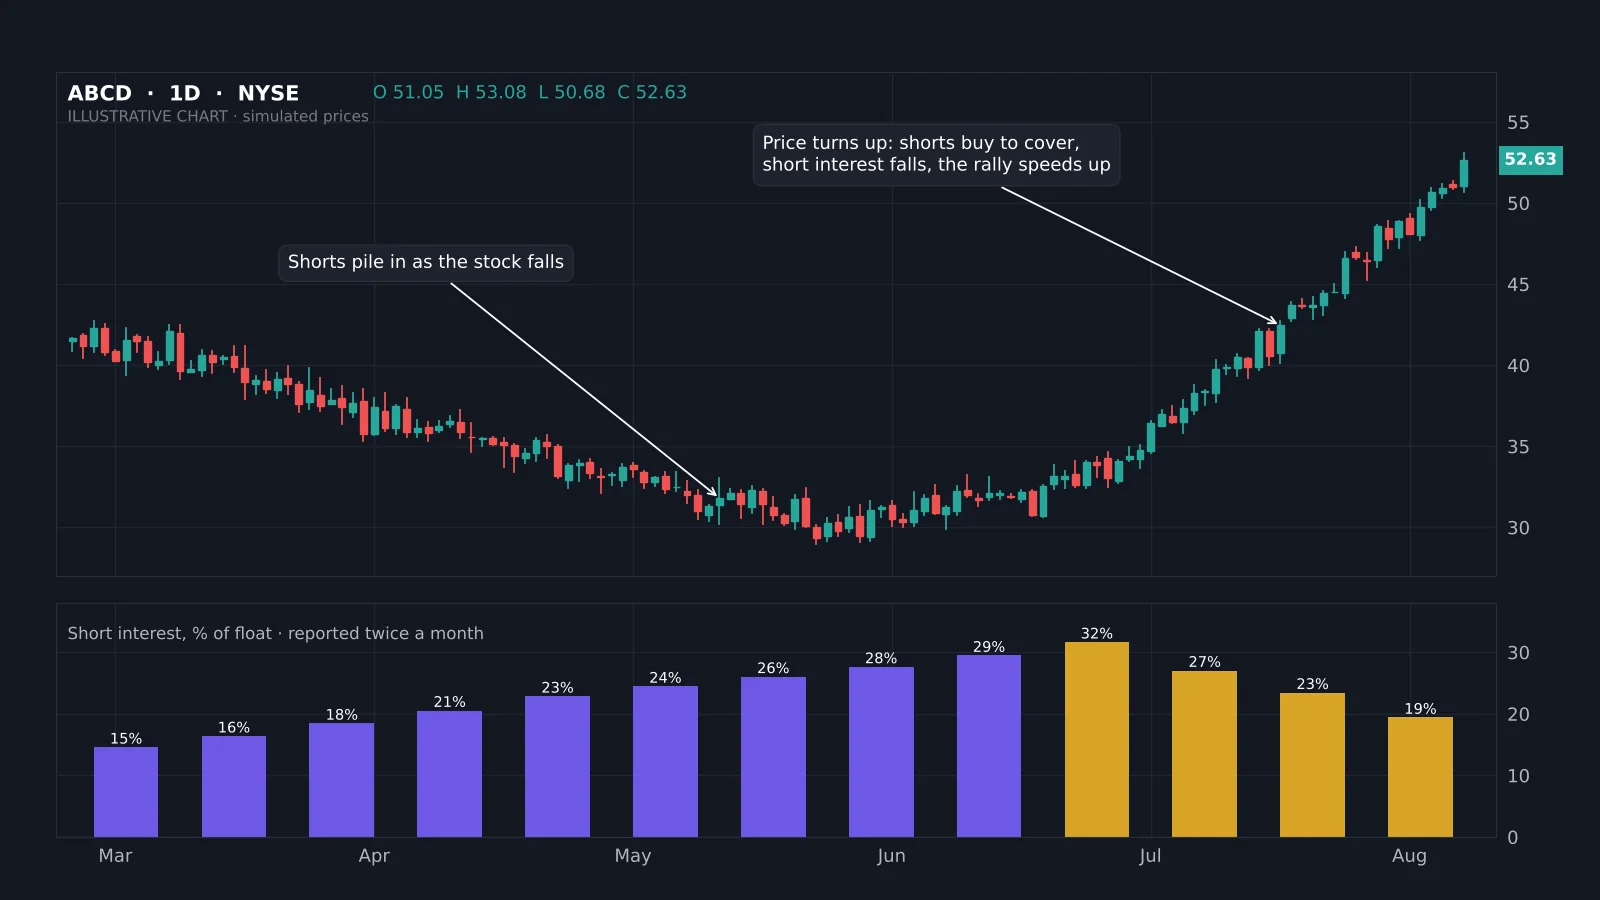
Raw share counts are hard to compare, so traders divide short interest by the float, the shares that are actually available to trade (excluding insider and locked-up holdings). A stock with 20 million shares short and a 100 million share float has 20% short interest.
| Short % of float | Rough reading |
|---|---|
| Under 5% | Low; normal for most large caps |
| 5–10% | Moderate; worth noting |
| 10–20% | High; strong bearish conviction |
| Over 20% | Very high; crowded, squeeze-prone if news turns |
| Over 100% | Possible when shares are lent more than once; rare and extreme |
These bands are rough. Some sectors, such as biotech or heavily hedged convertible issuers, carry high short interest as a matter of course. Always compare with the stock's own history: a rise from 5% to 15% in two months tells you more than a single 15% reading.
What is days to cover (the short interest ratio)?
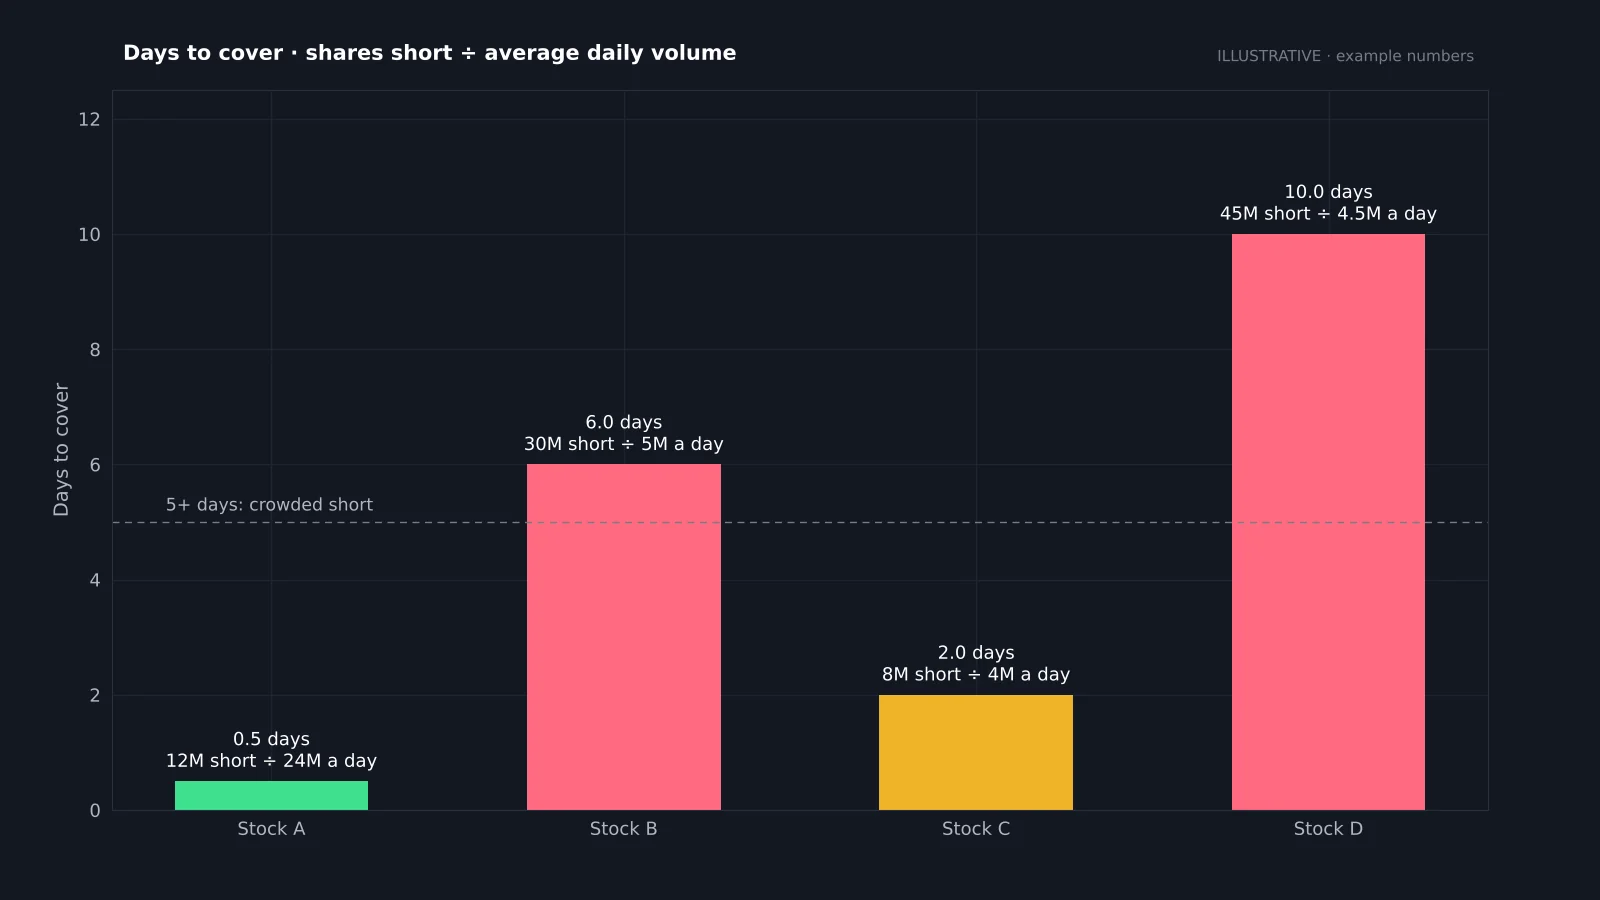
Days to cover divides short interest by average daily trading volume. It estimates how many days of normal volume it would take for every short to buy back. Thirty million shares short in a stock that trades five million a day gives six days to cover.
Days to cover often matters more than the percentage. A stock can carry 15% short interest and still clear its shorts in under a day if it trades heavily; another with 8% short interest can need many days if volume is thin. Above about five days the short side is crowded: if price turns against them, the exits are narrow. The same idea applies to open interest in futures.
How and when is short interest reported?
In the US, broker-dealers report their customers' short positions in every exchange-listed and OTC stock to FINRA twice a month, as of a mid-month and an end-of-month settlement date. They file two business days after the settlement date, and FINRA and the exchanges publish the totals roughly seven business days after it. By the time you read the number it is one to two weeks old.
The SEC has adopted a new rule (13f-2) requiring large institutional short positions to be reported on Form SHO and published in aggregate. Its compliance date has been pushed back to 2028, so for now the twice-monthly FINRA data remains the standard source. Outside the US, rules differ: the UK and EU publish individual net short positions above 0.5% of a company's shares.
What does high short interest tell you?
- Conviction: informed investors may see problems such as weak earnings, dilution or accounting concerns.
- Crowding: many traders share the same bet, so good news can force them out together.
- Cost: heavily shorted stocks are often expensive to borrow, which pressures shorts to be right quickly.
- Hedging: some short interest is not bearish at all, for example funds hedging convertible bonds or merger arbitrage positions.
High short interest is therefore neither a buy nor a sell signal by itself. It changes the risk profile: downside moves can be orderly, upside moves can become violent.
How is short interest linked to short squeezes?
A short squeeze happens when a heavily shorted stock rises and shorts rush to buy back, adding buying pressure that pushes the price higher, which forces more covering. The fuel is short interest; the trigger is usually news, earnings or a technical breakout; and days to cover tells you how long the squeeze could last.
Squeezes are often amplified by options. When traders also buy short-dated calls, dealers hedging those calls buy stock too, the mechanism explained in our guide to the gamma squeeze. Falling short interest after a big rally, as in the chart above, is the footprint of covering.
What are cost to borrow and utilization?
Short sellers pay a fee to borrow shares. For most large caps it is a fraction of a percent a year; for hard-to-borrow names it can be tens of percent or more. Utilization is the share of the lendable supply already on loan. Both update daily at data vendors and brokers, so they are fresher than official short interest.
When utilization approaches 100% and the borrow fee jumps, new shorts struggle to enter and existing ones face recalls. Combined with high days to cover, those are the conditions in which squeezes start.
How do traders use short interest?
- As a risk filter: avoid shorting stocks with high days to cover unless you have a strong reason; your exit may be crowded.
- As a squeeze watchlist: high short interest plus a catalyst and a technical breakout.
- As a trend check: rising short interest while price falls confirms bears are adding; falling short interest in a rally shows covering.
- Around earnings: crowded shorts can produce outsized gaps on good news.
Pair the data with price structure. A breakout above resistance in a crowded short is a stronger long setup than the same breakout in an ignored stock. The breakout trading guide covers how to confirm it.
Where can you find short interest data?
The free sources are FINRA's equity short interest data and the exchanges' own pages (Nasdaq and NYSE publish for their listings). Many free stock sites repeat the same figures with percent of float and days to cover already calculated. Paid services add estimated daily short interest, borrow fees and utilization.
Check the settlement date on any number you read, and be careful with floats: sites compute float differently, so the same short interest can show as 18% on one site and 23% on another.
Reference data
| Item | Value |
|---|---|
| Short % of float | Short interest ÷ float × 100 |
| Days to cover | Short interest ÷ average daily volume |
| US reporting | FINRA Rule 4560, twice a month |
| Broker filing | 2 business days after settlement date |
| Publication | About 7 business days after settlement date |
| Form SHO (Rule 13f-2) | Compliance delayed to 2028 |
| UK / EU disclosure | Individual net shorts ≥ 0.5% published |
Short interest calculator
Enter the shares sold short, the float and the average daily volume. The calculator returns short interest as a percentage of float and days to cover, with a rough reading of how crowded the short side is.
What are the limits of short interest data?
- Lag: one to two weeks old when published; positions can change completely in that time.
- Snapshots: twice a month only, so short-term trading in between is invisible.
- Hedges look bearish: convertible arbitrage and pairs trades inflate the number.
- Float definitions differ between sources.
- Market makers' shorts are included and are not directional bets.
Treat short interest as background context for your chart, not a signal to act on alone.
Is short interest a useful indicator?
Yes, as context. It tells you how crowded the bearish side is, how hard the exit would be, and where squeezes are possible. It does not tell you direction or timing, and its delay means price action and fresher borrow data should lead your decisions.
Add short interest and days to cover to your watchlist notes for the stocks you trade, look at how they change from one report to the next, and record in your trading journal whether crowded names behave differently on your setups.
Short interest is the number of shares sold short and not yet covered. Read it as a percentage of float and as days to cover (short interest ÷ average daily volume). US data comes from FINRA twice a month and is one to two weeks old when published. High short interest shows conviction and crowding: orderly on the way down, violent if a squeeze starts. Use it as context alongside price action, borrow fees and utilization.
◆ Interactive check
Can you read short interest?
Questions traders ask about short interest
Above about 10% of float is high for most stocks and above 20% is very high. Compare with the stock's own history and its sector.
Under two days is easy to exit; above five days is crowded. There is no 'good' number, only how much squeeze risk you accept.
In the US, twice a month, published about a week after each settlement date.
Yes, rarely. Lent shares can be sold and re-lent, so short positions can exceed the float.
No. It means many traders expect that. It can also set up a sharp rally if they are wrong.
Short interest is the open short position; short volume is how many shares were sold short in a day, much of it by market makers.
FINRA's short interest data, exchange websites and most free stock data sites.
No. The put/call ratio measures options activity; short interest measures borrowed and sold shares.
References & Related Guides
Read next
- What Is Short Selling?
- Gamma Squeeze
- Put/Call Ratio
- Open Interest Explained
- Breakout Trading Strategy
- How to Find Stocks for Day Trading
- Dead Cat Bounce
- How to Start Trading Stocks
- COT Report
- Trading Journal