Dead Cat Bounce: What It Is, How to Spot One and How Not to Get Trapped
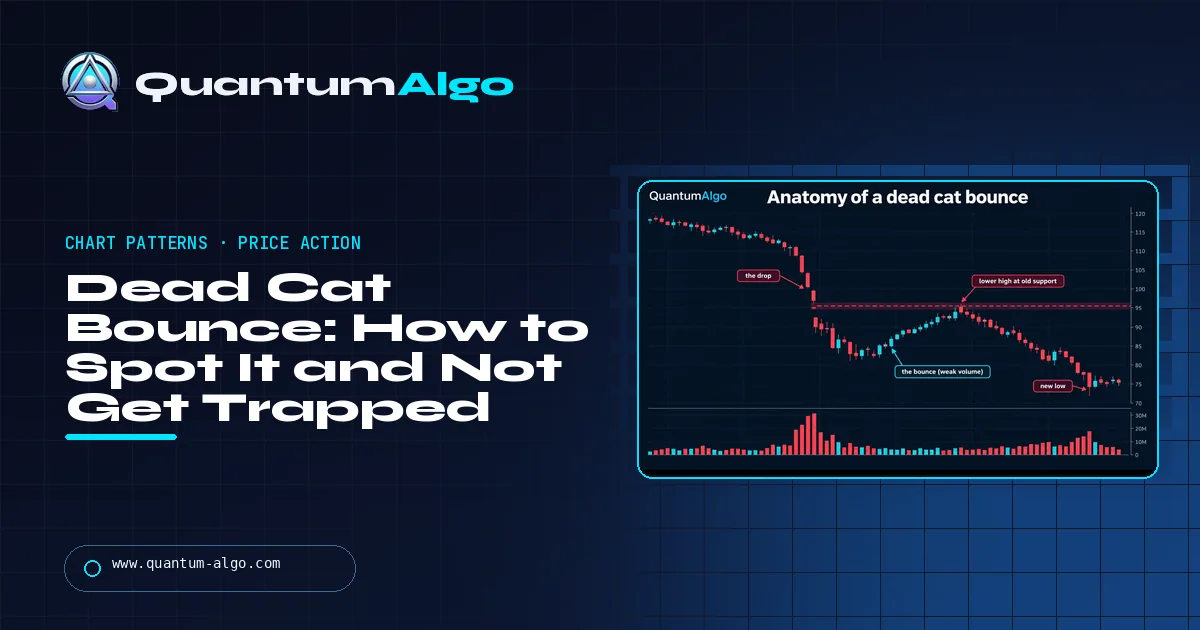
A dead cat bounce is a short-lived recovery after a steep decline that fails, after which price falls to new lows. It typically stalls at old support or another resistance and makes a lower high on fading volume. It is confirmed only afterwards; a real reversal holds a higher low and breaks the last lower high on rising volume.
After every crash, someone calls the bottom and someone calls the bounce a dead cat. Both are guessing — the pattern can only be confirmed after price makes a new low. What can be done in real time is to know where bounces usually fail, what the evidence for a genuine turn looks like, and how often each outcome happens. This guide covers what a dead cat bounce is and where the phrase comes from, its anatomy, Bulkowski's statistics on how bounces behave after big one-day drops, a side-by-side test against a real reversal, famous examples from the Nasdaq in 2001, the S&P 500 in 2008 and Bitcoin in 2018 and 2022 — plus the 2025 counter-example — how traders handle a suspected bounce, how it differs from bear market rallies and short squeezes, a worked earnings-gap example, the common mistakes, and a checker that scores a bounce as it unfolds.
Indicators that prove themselves in public.
One engine, four precision tools — the Gold (XAU) Scalper, the institutional Gravity Zone, the Zeno momentum Oscillator, and Zeno Stocks for equities.



What is a dead cat bounce?
A dead cat bounce is a short-lived recovery after a steep decline that fails, after which price falls to new lows. It is a continuation pattern: the bounce is a pause inside a downtrend, not the end of it. The term applies to a single stock after a bad earnings report, to an index in a bear market, to a cryptocurrency after a crash — anywhere a sharp fall is followed by a rally that looks like a turn and is not.
The phrase entered financial journalism in December 1985, when a Financial Times report on the Singapore and Malaysian stock markets quoted a broker describing the rebound that way; it may have circulated among traders earlier. It comes from the grim saying that even a dead cat will bounce if it falls from a great height. The point is the one every definition makes: the bounce is real, but it is not a sign of life. And because the trend only resumes afterwards, a dead cat bounce is usually recognised in hindsight — which is why the useful question is not "is this a dead cat bounce?" but "what would prove it is not?"
What does a dead cat bounce look like?
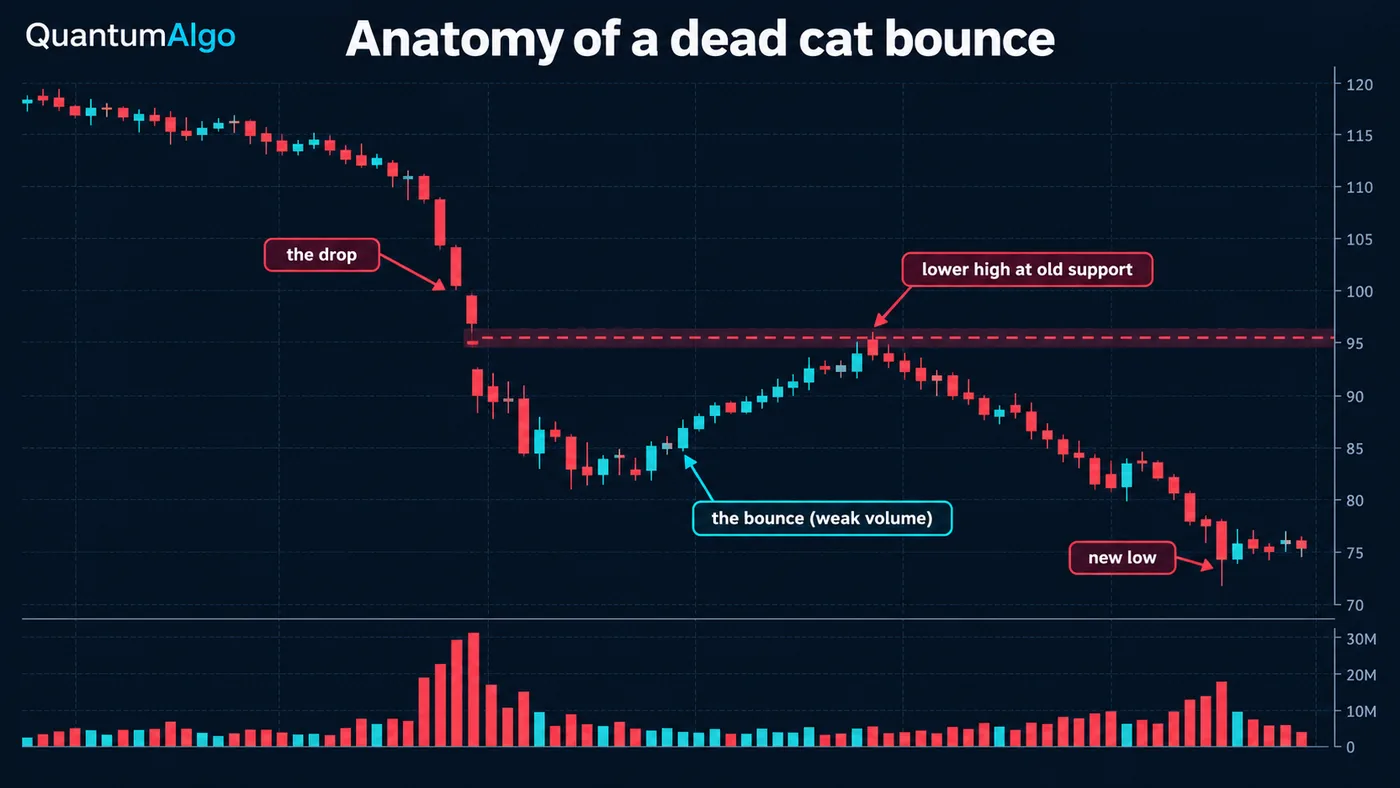
| Phase | What happens | What to watch |
|---|---|---|
| The drop | A sharp fall — often a gap on news — on heavy volume | Size of the drop; where the old support was |
| The bounce | Short-covering and bargain-hunting lift price for days or weeks | Volume — fading volume on the rally is the warning |
| The failure | The bounce stalls below a resistance level and makes a lower high | Old support turned resistance, the gap, a falling moving average, the 38.2–50% retracement |
| The resumption | Selling returns and price breaks below the drop's low | A close below the low confirms the pattern |
The places bounces tend to fail are the ones that matter to the sellers who were trapped by the drop. Support that broke on the way down becomes resistance from underneath — the support and resistance guide covers why. A down gap that has not been filled is another, as is a falling 50-day or 40-week moving average. Traders also watch the Fibonacci retracements of the drop: shallow bounces that stall below the 38.2% level are typical of failed rallies, though that is a convention rather than a tested rule (see the Fibonacci retracement guide).
How common are dead cat bounces?
The most detailed statistics come from Thomas Bulkowski, whose dead-cat-bounce study covers several hundred stocks across many industries. He treats the dead cat bounce as an "event pattern" that starts with a one-day drop of at least 15%, usually a gap on news, and his published figures for that version are:
| Bulkowski statistic | Value |
|---|---|
| Average drop on the event day | About 31% (range roughly 15–70%) |
| Lower low the next day | 46% of cases |
| Average time to the trend low after the event | About 7 days |
| Average bounce from the event low to the bounce high | About 28%, over about 23 days |
| Average decline after the bounce | About 30% from the bounce high, over about 49 days |
| Price ends below the event low | About 67% of the time, by an average of 18% |
| Gap closed during the bounce | 22% (38% within 3 months, 58% within 6 months) |
| A second dead cat bounce | 26% within 3 months, 38% within 6 months |
Two caveats. These numbers describe stocks after single-day collapses, not index bear markets, and Bulkowski notes they come from idealised "perfect" trades, so real fills are worse. Even so, the pattern they describe is clear: after a large one-day drop, a bounce of 20–30% is common, and in most cases it is followed by lower prices, not a recovery.
How do you tell a dead cat bounce from a real reversal?
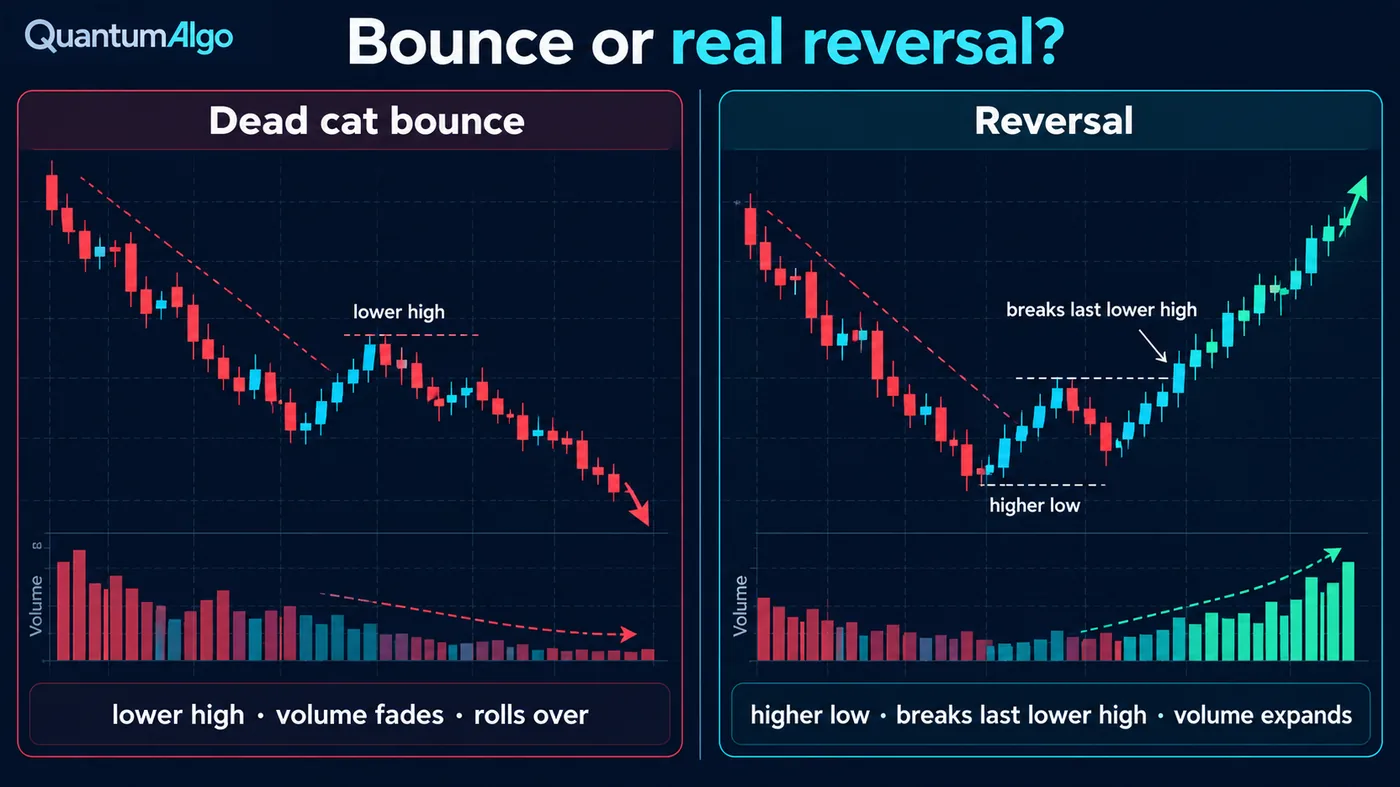
| Evidence | Dead cat bounce | Real reversal |
|---|---|---|
| Structure | Lower high; no higher low | Higher low, then a close above the last lower high |
| Volume | Fades on the rally | Expands on the rally and on the breakout |
| Depth of the bounce | Often shallow — under about 38.2% of the drop | Recovers 50–61.8% or more and holds |
| Moving averages | Rejected at a falling 50-day or 40-week | Reclaims and holds the 50-day; the average flattens and turns |
| Breadth (indexes) | Few stocks participate; narrow leadership | Broad participation; advancing issues outpace decliners |
| Catalyst | The cause of the drop is unresolved | The cause is resolved or fully priced |
No single row decides it, and all of them can be faked for a few days. The structural test is the most reliable because it is the definition: a real reversal breaks above the bounce's high and holds above the recent lows. In market-structure terms, a dead cat bounce is a lower high inside a downtrend; a reversal is a change of character followed by a higher low. Until one of those two things happens, the honest reading is "undecided".

Automate your trades. Let Quantum Algo trade for you.
Every signal executed on your own account — on your account, with the plan you define.
What are some famous dead cat bounces?
| Market | The bounce | What came next |
|---|---|---|
| Nasdaq Composite, 2001 | From 1,638.80 on 4 April 2001 up about 41% in a month, to around 2,300 | Fell to an intraday low of 1,108.49 on 10 October 2002 — 78% below the 2000 peak |
| S&P 500, 2001 | From 1,103 on 4 April to 1,315 on 22 May (+23.8%) | Down to 969 by 21 September (−30%) |
| S&P 500, autumn 2008 | +10.79% on 28 October to 940.51; about +18% to 1,005.75 by 4 November | Down to 752.44 on 20 November; the final low was 676.53 on 9 March 2009 |
| Bitcoin, 2018 | From below $6,000 on 5–6 February to above $11,000 on 19 February (about +80%) | Down to about $3,100 by December 2018 |
| Bitcoin, 2022 | From below $17,800 in June to above $25,000 in mid-August (about +40%) | Back to $15,000–$17,000 after the FTX collapse in November |
| Amazon, July 2001 (per Bulkowski) | A 25% one-day drop on earnings, then a bounce of about a week | Bottomed about 66% below the pre-earnings close |
The counter-example is just as important. On 9 April 2025 the S&P 500 rose 9.52% in one session to 5,456.90, a move the same size as 28 October 2008 — and that time there were no new lows; the index went on to record highs within a few months. Big bounces after big drops look identical at the start. What separated 2008 from 2025 was what happened on the next swing, not the size of the first one.
How do traders handle a suspected dead cat bounce?
- Do not buy the first bounce after a crash on its own. A large one-day drop is more often followed by lower prices than by a recovery; wait for structure.
- Mark where the bounce should fail. The old support, the down gap, the falling 50-day and the 38.2–50% retracement of the drop.
- Watch the second swing. A lower high on fading volume supports the dead-cat reading; a higher low and a close above the last lower high cancel it.
- If you short the failure, define the stop first. Above the bounce high, sized so the loss is small — bounces can extend sharply on short covering.
- If you are long, let the reversal prove itself. Buy the higher low or the break of the last lower high, not the hope of a bottom.
- Keep the timeframe straight. A dead cat bounce on the daily chart can contain a tradable uptrend on the 15-minute chart.
How is a dead cat bounce different from a bear market rally or a short squeeze?
| Term | What it means | Relation to a dead cat bounce |
|---|---|---|
| Dead cat bounce | A short recovery after a steep fall that fails and leads to new lows | — |
| Bear market rally | Any rally inside a bear market; thresholds vary by source (from about 5–10% to 10–20%) | A dead cat bounce is a bear market rally that fails quickly |
| Sucker's rally | A rally that lures buyers in before reversing | Often used as a synonym |
| Relief rally | A respite from selling pressure, for example after news that was feared | Neutral — it may or may not mark the end of the decline |
| Short squeeze | Short sellers forced to buy back, driving price up fast | Often the fuel of the bounce itself |
| Bull trap | A breakout above resistance that fails | Related idea at a level; a dead cat bounce fails before reclaiming the level |
Bounce or reversal checker
Enter the high before the drop, the low of the drop and the highest point of the bounce so far, then answer four questions about volume, structure and the 50-day average. The checker shows how deep the drop was, how much of it the bounce has retraced, the 38.2%, 50% and 61.8% levels, and which way the evidence leans.
Reference data
| Item | Value |
|---|---|
| Definition | A short-lived recovery after a steep decline, followed by a continuation to new lows |
| Pattern type | Continuation (bearish); confirmed only when price breaks the drop's low |
| First known press use | Financial Times, December 1985 (Singapore and Malaysian markets) |
| Common failure points | Old support, unfilled down gaps, a falling 50-day or 40-week average, 38.2–50% retracements |
| Bulkowski event version | Starts with a one-day drop of 15% or more; average bounce about 28% over about 23 days |
| Reversal test | A higher low and a close above the last lower high, on expanding volume |
| Related terms | Bear market rally, sucker's rally, relief rally, short squeeze, bull trap |
| Checked | October 2026 |
Worked example: a failed bounce after an earnings gap
An illustrative stock trades at $115 and has support at $95. It reports weak results and gaps down, falling through support to close at $83 — a 27.8% drop on four times normal volume. Over the next three weeks it bounces to $95, exactly the broken support. The bounce has retraced 12 of the 32 points, or 37.5% of the drop, and volume on the rally has run at about 60% of the 50-day average. The 50-day moving average, still above $100, is falling.
Everything on the evidence list points the same way: a lower high at old support, a shallow retracement, fading volume, a falling average. A trader who wants to act on it sells short at $94 after the first lower high on the daily chart, with a stop at $97.50 — above the $95 bounce high plus a small buffer — so the risk is $3.50 a share. The first target is the $83 low, about three times the risk; a close below it confirms the dead cat bounce, and the remainder is trailed above each new lower high. In this example price breaks the low and falls to $74. If instead the stock had held $88 on the next dip and then closed above $95, the same trader would have been stopped out for a small loss — and the evidence would have switched to a reversal.
What mistakes do traders make with dead cat bounces?
- Calling every bounce a dead cat bounce. Many rallies after big drops are the start of a recovery; the label is only confirmed by a new low.
- Buying the first sharp bounce because the drop "looks overdone". The statistics favour lower prices after large one-day drops.
- Shorting the bounce in the middle of nowhere instead of at a defined resistance level with a stop above it.
- Ignoring short squeezes. Bounces fuelled by short covering can run further and faster than the structure suggests.
- Reading index bounces without breadth. A rally carried by a handful of large stocks is weaker than the index line looks.
- Mixing timeframes: shorting a daily dead cat bounce on a 5-minute signal, or the reverse.
- Treating the 38.2% and 50% retracements as rules. They are places to watch, not proof.
How does the dead cat bounce fit with structure and the free indicators?
The dead cat bounce is a market-structure story — a lower high inside a downtrend — so it reads best with structure tools. The Smart Money Concepts Engine prints the breaks of structure and changes of character that separate a failing bounce from a turn; Liquidity Sweeps shows when a bounce runs the highs above old support and snaps back; and the Market Bottom Finder flags the conditions that a real bottom usually needs, which a dead cat bounce lacks. Zeno, the premium engine, prints buy and sell signals with a built-in stop and targets — after a crash, a sell signal at the old support with a stop above the bounce high is the dead-cat setup; a buy signal after a higher low is the reversal one. For the related failure at resistance, see bull traps and bear traps, and for gaps on news, the gap trading guide.
A dead cat bounce is a failed recovery inside a downtrend: a sharp drop, a bounce on fading volume into old support, a lower high and then a new low. It is only confirmed in hindsight, so trade the evidence — mark where the bounce should fail, watch the second swing, define the stop before you act — and let a higher low and a break of the last lower high tell you when the dead cat was a turn after all.
◆ Interactive check
Can you spot a dead cat bounce?
Questions traders ask about the dead cat bounce
A dead cat bounce is a temporary recovery after a steep decline that fails, after which the price continues down to new lows. It is a continuation pattern and is usually only recognised in hindsight.
From the saying that even a dead cat will bounce if it falls from a great height. The phrase appeared in a Financial Times report on the Singapore and Malaysian markets in December 1985, quoting a broker.
It varies. Thomas Bulkowski's figures for stocks after a one-day drop of 15% or more show an average bounce of about 28% lasting about 23 days, followed by a decline averaging about 30%. Index bounces in bear markets can last weeks to months.
Look at the next swing. A dead cat bounce makes a lower high, often at old support or a falling moving average, on fading volume. A reversal holds a higher low and closes above the last lower high on expanding volume.
Some traders short the failure at a defined resistance with a stop above the bounce high, or trade the bounce itself on a lower timeframe. Both carry real risk, because bounces can extend on short covering and the pattern is only confirmed afterwards.
A dead cat bounce is a kind of bear market rally — one that fails quickly and leads to new lows. Not every bear market rally is a dead cat bounce; some turn into the start of a new uptrend.
Yes. Bitcoin rallied about 80% in February 2018 and about 40% between June and August 2022 before falling to new lows both times.
There is no fixed level. Shallow bounces that stall below the 38.2% retracement of the drop are typical, and many fail around 50%, but those are conventions, not rules.
No. The April 2025 S&P 500 rally of 9.52% in one day looked like October 2008 at the start but was followed by record highs rather than new lows. Only the next swing tells them apart.
The free Smart Money Concepts Engine marks the lower highs and changes of character that separate a failing bounce from a turn, Liquidity Sweeps shows runs of the highs at old support, and Zeno prints buy and sell signals with a stop and targets.
References & Related Guides
Read next
- Bull Trap and Bear Trap
- What Is a Market Structure Shift
- Fibonacci Retracement
- Support and Resistance
- Gap Trading Strategy
- Bear Flag Pattern
- Head and Shoulders Pattern
- Trend Trading Strategy
- Moving Averages
- Mean Reversion Trading
- Market Bottom Finder (free indicator)
- Zeno — the premium engine