Rectangle Pattern: The Box, the False Break, the Real Break and the Measured Target
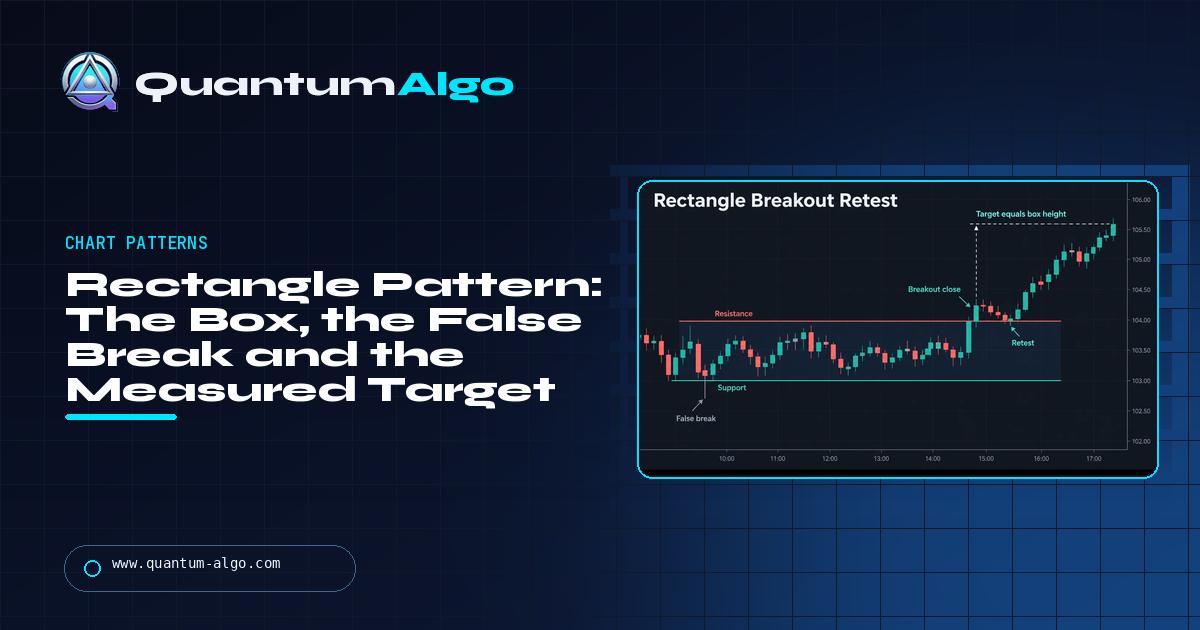
A rectangle pattern is price moving sideways between a horizontal resistance and a horizontal support, touching each at least twice, after a trend has led into it. Inside the box the trade is the edges — long at support, short at resistance, stop beyond the edge, target the other side — and nothing in the middle. The pattern resolves with a close beyond an edge, more often in the direction of the prior trend; the target is one box height from the broken edge, the stop goes back inside the box, and the retest of the old edge is the second and often better entry. Expect a false break first: a wick through an edge that closes back inside is a stop hunt, and it usually precedes the real break the other way.
The rectangle is the pattern nobody writes about because it seems too simple: two flat lines and a box. That simplicity is why it works — the edges are unambiguous, the height is a real measure, and the target is the one classical target that gets hit most reliably. It is also why it traps people, because everyone can see the box and the stops beyond its edges are the easiest liquidity on the chart. This page is the anatomy and the two-touch rule, the false break that is the rectangle's signature, the break, the retest and the measured move, how it differs from flags, triangles and the SMC dealing range, a EURUSD 1-hour box with a false break and then the real one, and the mistakes that turn the simplest pattern into a losing one. The planner validates the box and returns the plan.
Indicators that prove themselves in public.
One engine, four precision tools — the Gold (XAU) Scalper, the institutional Gravity Zone, the Zeno momentum Oscillator, and Zeno Stocks for equities.



What the rectangle pattern is
A rectangle is price moving sideways between a horizontal resistance and a horizontal support, touching each at least twice, after a trend has led into it. Draw the two lines and you have a box. It is the plainest pattern on the chart — no slopes, no convergence, nothing to argue about — and it is the classical name for what a range trader calls a range and a Smart Money trader calls consolidation. The pattern version adds two things the bare range does not: a trend leading in, which gives the eventual break a bias, and a measured target, which is the height of the box projected from the edge that breaks.
Rectangles form because the market has found a price where buyers and sellers are briefly balanced after a move. Every rally to the top is sold by those who think the move is over and by profit-takers from the trend; every dip to the bottom is bought by those who think it is not. The box holds until one side is exhausted. Because the trend that led in represents the larger flow, the break is more often a continuation than a reversal — which is the modest directional edge the pattern carries. It is not a strong one. A rectangle after an uptrend breaks up somewhat more than half the time; the real edge is that the break, whichever way, is measurable and tradeable.
This page is the classical pattern: the box, the break, the retest and the target. The range trading strategy covers how to trade the edges inside a range as a system; the opening range breakout is the intraday special case of a box defined by the first minutes of the session.
Anatomy of the box
| Element | Rule | Note |
|---|---|---|
| Resistance | A horizontal line through at least two swing highs within a small tolerance | The tolerance is the width of a normal wick on that timeframe, not a fixed number |
| Support | A horizontal line through at least two swing lows within the same tolerance | Two and two is the minimum; three and three is a strong box |
| Prior trend | A clear move into the box | Without one it is a range, not a rectangle pattern, and the break has no bias |
| Height | Resistance minus support | The target for the break; boxes under about half an ATR of height are too thin to trade |
| Duration | Longer than a flag, shorter than a base — typically 3 to 12 swings | Long, tight rectangles break harder than short, wide ones |
| Volume | Declining inside the box, expanding on the break | Volume rising inside the box with no resolution is a sign of distribution or accumulation — see the SMC view |
| False break | A wick through an edge with a close back inside | Common before the real break, and usually in the opposite direction to it |
The false break in the last row deserves its own paragraph because it is the rectangle's signature. Boxes are visible to everyone and their edges are where stops sit: sells under support, buys over resistance. Before the real break, price often pokes through one edge on a wick, takes those stops, and closes back inside — and then breaks the other way. A wick through the bottom followed by a close inside is not a breakdown; it is very often the last thing that happens before the breakout. The swing failure pattern is this event by another name.
The break, the retest and the target
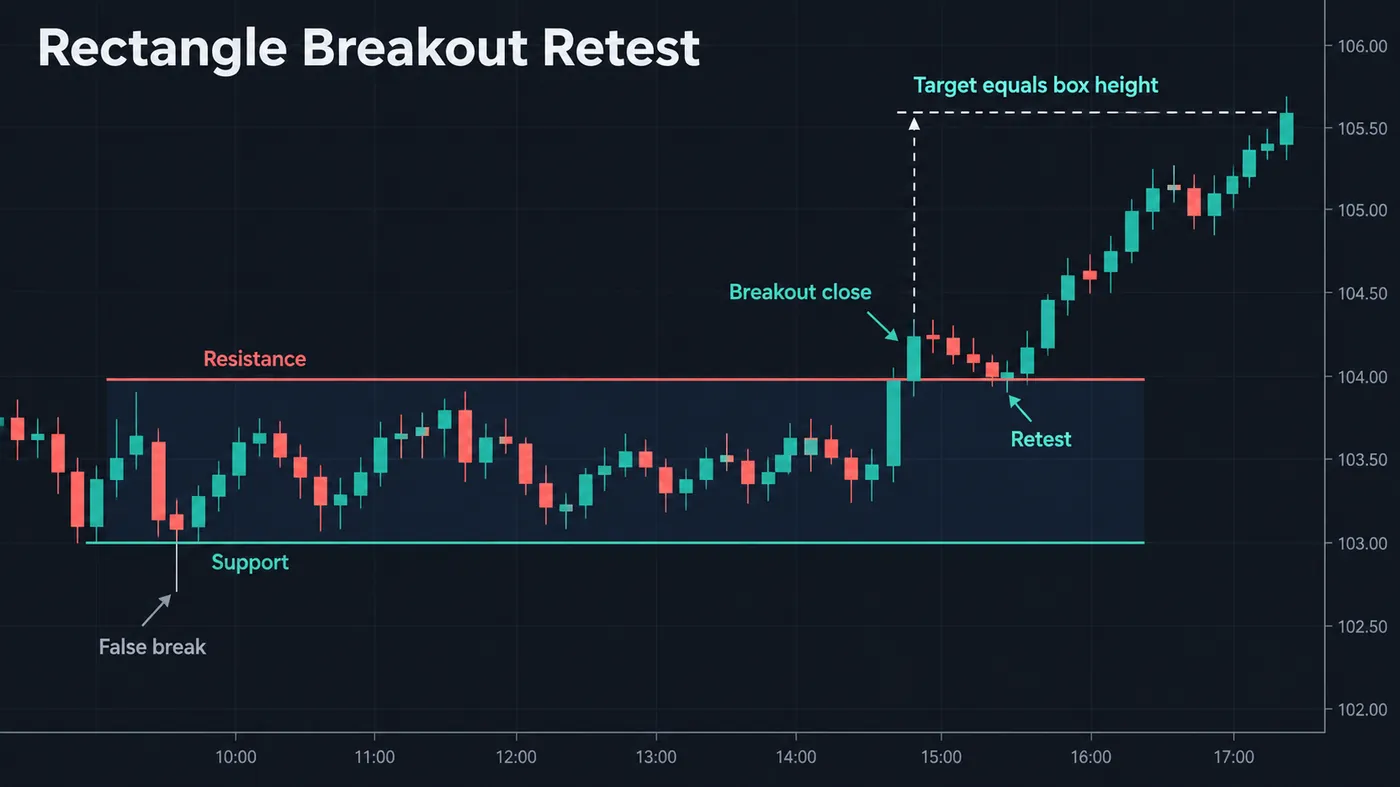
The break is a close beyond an edge on your trading timeframe — not a wick, not a touch, a close — ideally by more than the tolerance that defined the edge and on volume above the box average. The strongest breaks come from tight, long boxes, where the balance has held for many swings and both sides are heavily positioned. The measured target is one box height from the edge that broke: a box from 103 to 104 that breaks up targets 105. It is a first target, and a good one; rectangles are among the patterns where the measured move is hit most reliably, because the height is a real measure of how much the market was willing to move while it was undecided.
The retest is the second entry and often the better one. After the break, price frequently returns to the old edge — old resistance becomes support on an upside break — and holds it before continuing. Entering on the retest has a tighter stop than entering on the break, and it filters the false breaks, because a false break does not retest; it just fails. When the break comes on weak volume, the retest is the only entry worth taking.
The stop goes back inside the box, a small fraction of the height beyond the edge. If price closes back inside, the break has failed and the pattern is no longer a reason to be in. On a retest entry the stop sits just below the retested edge. Take most of the position at the measured move and let the remainder run on structure; a rectangle that breaks with the trend often travels two box heights, but the second one is a trend trade, not a pattern trade.

Automate your trades. Let Quantum Algo trade for you.
Every signal executed on your own account — on your account, with the plan you define.
How to trade it
- Draw the box on two touches of each edge. Horizontal lines, wick tolerance. If the highs or lows slope, it is a channel or a triangle.
- Note the trend into it. That is the bias for the break. No trend means a range — trade the edges, expect nothing from the break.
- Inside the box, trade the edges only. Long from support with the stop below it, short from resistance with the stop above, target the other side. Nothing in the middle.
- Expect the false break. A wick through an edge with a close back inside is a stop hunt, not a resolution — and it often precedes the real break the other way.
- On a close beyond an edge, trade the break or the retest. Break entry on volume ≥ 1.5× average; otherwise wait for price to return to the edge and hold.
- Stop back inside, target one box height. Take most at the measured move. The second box height is a trend trade with a trailing stop.
Rectangle planner
Put in the top and bottom of the box, how many times each has been touched, the trend before it, the last close and the volume on the break. The tool tells you whether the box is valid yet, whether price is at an edge or dangerously mid-box, whether a break is confirmed or weak, and returns the stop, target and R multiple for the edge trade or the break — and flags when the entry is already late.
Rectangle versus the other sideways shapes
| Shape | Highs | Lows | Where it sits | What to do |
|---|---|---|---|---|
| Rectangle | Flat | Flat | Mid-trend or at a top/bottom | Edges inside; break with box height as target |
| Flag | Sloping against the trend | Sloping against the trend | After a sharp pole | Break in the pole direction; target = pole |
| Symmetrical triangle | Falling | Rising | Mid-trend | Break; target = widest part |
| Ascending triangle | Flat | Rising | Usually mid-uptrend | Bullish bias; break above the flat top |
| Descending triangle | Falling | Flat | Usually mid-downtrend | Bearish bias; break below the flat bottom |
| Opening range | Flat | Flat | First minutes of the session | Intraday box; see the ORB guide |
| SMC consolidation / dealing range | Flat with sweeps | Flat with sweeps | Anywhere structure pauses | Read the sweeps and the order blocks; the break follows the sweep |
The last row is the same box read differently. Where the classical rectangle trader sees a false break, the Smart Money trader sees a liquidity sweep — the market taking the stops beyond an edge before moving the other way — and trades the return inside as the entry. The two readings agree on what happens; the SMC version gives a more precise entry and the classical version gives the target. Use both. The ranges and consolidation lesson in the academy covers the sweep-based reading in full.
Reference data
| Item | Value |
|---|---|
| Also called | Trading range, box, consolidation, darvas box (a related method), continuation rectangle / reversal rectangle |
| Geometry | Horizontal resistance and support, ≥2 touches each, a trend leading in |
| Bias | Continuation of the prior trend, modestly more often than not |
| Inside trade | Edges only: long at support, short at resistance, stop beyond the edge, target the other side |
| Break | A close beyond an edge, ideally ≥1.5× average volume; retest entry when volume is weak |
| Stop | Back inside the box, ~15% of the height beyond the edge; just beyond the retested edge on a retest entry |
| Target | One box height from the broken edge; second height is a trend trade |
| False break | Wick through an edge, close back inside — a stop hunt; often precedes the real break the other way |
| Minimum size | Height ≥ ~0.5 ATR; thinner boxes leave no room for spread and stop |
| Best timeframes | 1H to daily on any liquid market; the ORB is the 5–15-minute intraday version |
Worked example: EURUSD 1-hour, a false break and then the real one
EURUSD, 1-hour chart. The pair rallied from 1.0740 to 1.0840 over two sessions, then stalled: highs at 1.0841, 1.0839 and 1.0843, lows at 1.0803, 1.0801 and 1.0805 across fourteen hours. A box from 1.0802 to 1.0841, height 39 pips, three touches each side, prior trend up. Inside it, one edge trade: long at 1.0806 on the third touch of support with a pin bar, stop 1.0796, target the top at 1.0840 — 34 pips against 10, filled in five hours.
Then the false break. At 08:00 London a candle wicked to 1.0791, eleven pips under support, and closed at 1.0812 — inside the box. The sells under 1.0800 were taken; the close was a rejection. No breakdown trade, and for a trader reading it the SMC way, a long from the close back inside with a stop under the wick. Three candles later, at 11:00, the pair closed at 1.0852, eleven pips above resistance on volume 1.8× the box average. The break. Long at 1.0852, stop at 1.0835 (six pips inside the box, 15% of the height), target one box height above the top at 1.0880 — 28 pips against 17, 1.6R. Price retested 1.0842 at 13:00 and held, which was the second entry with a stop at 1.0834 and 2.4R to the same target. The target filled at 16:00, and the pair went on to 1.0905 the next morning — the second box height, for the trend trade.
Mistakes traders make with rectangles
- Trading the middle of the box. The edges are the trade; mid-box has no stop location and no target.
- Calling a break on a wick. A wick through the edge is the false break; the pattern needs a close.
- Shorting the false break. The wick under support that closes back inside is a stop hunt and very often the last event before the real break up.
- Drawing the box on one touch. Two of each edge is the minimum; one touch is a swing, not a level.
- Ignoring the trend into it. The bias comes from what led in; a rectangle with no prior trend is a range with no bias.
- Skipping the retest on a weak break. Low-volume breaks fail; the retest filters them and gives a tighter stop.
- Trading boxes thinner than half an ATR. The target is too small for the spread and the stop is inside the noise.
The rectangle and the free indicators
The box is the pattern the free library reads most directly. The Institutional Key Levels script draws the horizontal levels the edges sit on, so the box is on the chart before you draw it. The Liquidity Sweeps script marks the wick through an edge and the close back inside — the false break — which is both the trap to avoid and the entry the SMC reading uses. The Smart Money Concepts Engine prints the structure break when the box resolves and the order block the retest returns to, and the Volatility Storm Tracker shows the volatility contraction inside the box that precedes a hard break. The premium engine, Zeno, prints signals with a stop and targets; a Zeno buy signal on the retest of a broken rectangle top is the pattern's best entry with the levels already placed.
Two touches of each edge, a trend leading in, a height that is the target. Trade the edges inside, never the middle. Treat a wick through an edge that closes back inside as a stop hunt, not a break — and expect the real break to follow the other way. On a close beyond an edge, take the break on volume or the retest without it, stop back inside the box, most of the position off at one box height.
◆ Interactive check
Do you know a break from a false break?
Questions traders ask about the rectangle pattern
A sideways pattern where price moves between a horizontal resistance and a horizontal support, touching each at least twice, after a trend has led into it. It is the classical name for a trading range with a trend behind it, and it resolves with a break beyond one edge that targets one box height from that edge.
Neither by shape. The bias comes from the trend that led into it: a rectangle after an uptrend breaks up somewhat more often than down, and the reverse after a downtrend. The edge is modest; the reliable part is that the break, whichever way, has a measurable target.
Two ways. Inside the box, trade the edges: long at support with the stop below it, short at resistance with the stop above, target the other side, and nothing in the middle. On a close beyond an edge, trade the break — on volume — or the retest of the old edge, with the stop back inside the box and the target one box height beyond the edge.
The height of the box — resistance minus support — projected from the edge that broke. A box from 103 to 104 that breaks up targets 105. It is one of the more reliable measured moves among classical patterns; a second box height is possible but is a trend trade rather than a pattern trade.
A wick through one edge that closes back inside the box. It takes the stops resting beyond the edge and is very often the last event before the real break in the opposite direction. Do not trade it as a break; the SMC reading treats it as a liquidity sweep and trades the close back inside.
On the break if it closes clearly beyond the edge on volume of at least 1.5× the box average. On the retest — price returning to the old edge and holding — if the volume is weak, or always if you prefer a tighter stop. The retest filters false breaks because a false break does not retest; it fails.
At least two of each edge, within a wick's tolerance. Three and three is a strong box. One touch is a swing, not a level, and a box drawn on one touch each is a guess.
A flag slopes against the trend and follows a sharp pole; its target is the pole length. A rectangle is horizontal, usually lasts longer, and its target is its own height. A flag is a brief pause in a fast move; a rectangle is a real balance between the two sides.
Same box, different reading. The classical trader sees edges, a false break and a measured target; the Smart Money trader sees a range whose edges hold liquidity, a sweep of that liquidity, and the move that follows the sweep. They agree on what happens; the SMC version gives the sharper entry, the classical version the target.
Not a pattern classifier. The Institutional Key Levels script draws the horizontal levels the edges sit on, the Liquidity Sweeps script marks the false break — the wick through and the close back inside — and the Smart Money Concepts Engine prints the structure break on the resolution and the order block the retest returns to. Zeno, the premium engine, prints signals with a stop and targets; a Zeno buy on the retest of a broken rectangle top is the pattern's best entry.
References & Related Guides
Read next
- Range Trading Strategy
- Opening Range Breakout (ORB)
- Chart Patterns: Complete Guide
- Support and Resistance
- Breakout Trading Strategy
- Swing Failure Pattern (SFP)
- Flag Pattern
- Ranges and Consolidation (SMC)
- Institutional Key Levels (free indicator)
- Liquidity Sweeps (free indicator)
- Dealing Range — glossary
- Zeno — the premium engine