Megaphone Pattern: How to Trade the Broadening Formation From the Inside and on the Break
A megaphone pattern — the broadening formation — is two diverging trendlines: price makes higher highs and lower lows in turn, each swing wider than the last, until the shape opens to the right like a megaphone. It needs five touches to call and it is the mirror of a triangle: volatility expands instead of contracting, because each rally traps buyers and each drop traps sellers. There are two trades. Inside the pattern, fade the lines — short at a touch of the upper line with a rejection candle, stop just beyond it, target the lower line — because the swings are wide and the stop is small. On a decisive close through a line, stop fading and trade the break, with the widest part of the pattern as the target. After a long uptrend it is a broadening top with a mild bearish edge; the trap is the break through the upper line at touch 5, where the crowd is short.
The megaphone is the pattern that does the opposite of what most pattern trading teaches. Triangles coil and break; megaphones expand and whipsaw, and traders who bring triangle habits to a broadening formation get stopped on every swing. This page is the anatomy and the five-touch rule, why the pattern expands and what that says about who is trapped, the two contradictory trades — the fade inside and the break outside — and when to switch from one to the other, the right-angled and diamond variants, a NASDAQ 100 daily broadening top traded twice, and the mistakes that make the megaphone the most expensive shape on the chart. The planner checks the geometry and returns both plans.
Indicators that prove themselves in public.
One engine, four precision tools — the Gold (XAU) Scalper, the institutional Gravity Zone, the Zeno momentum Oscillator, and Zeno Stocks for equities.



What the megaphone pattern is
A megaphone — the textbooks call it a broadening formation — is a pattern of two diverging trendlines: price makes a higher high, then a lower low, then a higher high above the last one, then a lower low below the last one, and so on, with each swing larger than the one before. Draw a line through the rising highs and a line through the falling lows and the shape opens to the right like a megaphone. It usually needs five touches to be called — three on one line, two on the other — and the fifth touch is where most of them resolve.
It is the mirror image of a triangle. In a triangle the range contracts, volatility falls, and the break comes from a coiled market. In a megaphone the range expands, volatility rises, and every swing is a bigger overshoot than the last. That tells you what is happening underneath: two sides are both wrong in turn, each rally sucks in buyers who are then run over, each drop sucks in sellers who are then squeezed, and the stops on both sides are being taken at ever-wider prices. It is a pattern of indecision with rising emotion, and it appears most often at the end of long trends and around major news.
What it is not: a reliable directional pattern. Broadening tops after a long uptrend resolve down more often than up, and broadening bottoms after a downtrend resolve up more often, but the edge is modest and the pattern's real value is in how it is traded — not in guessing which way it breaks.
Anatomy: the five touches
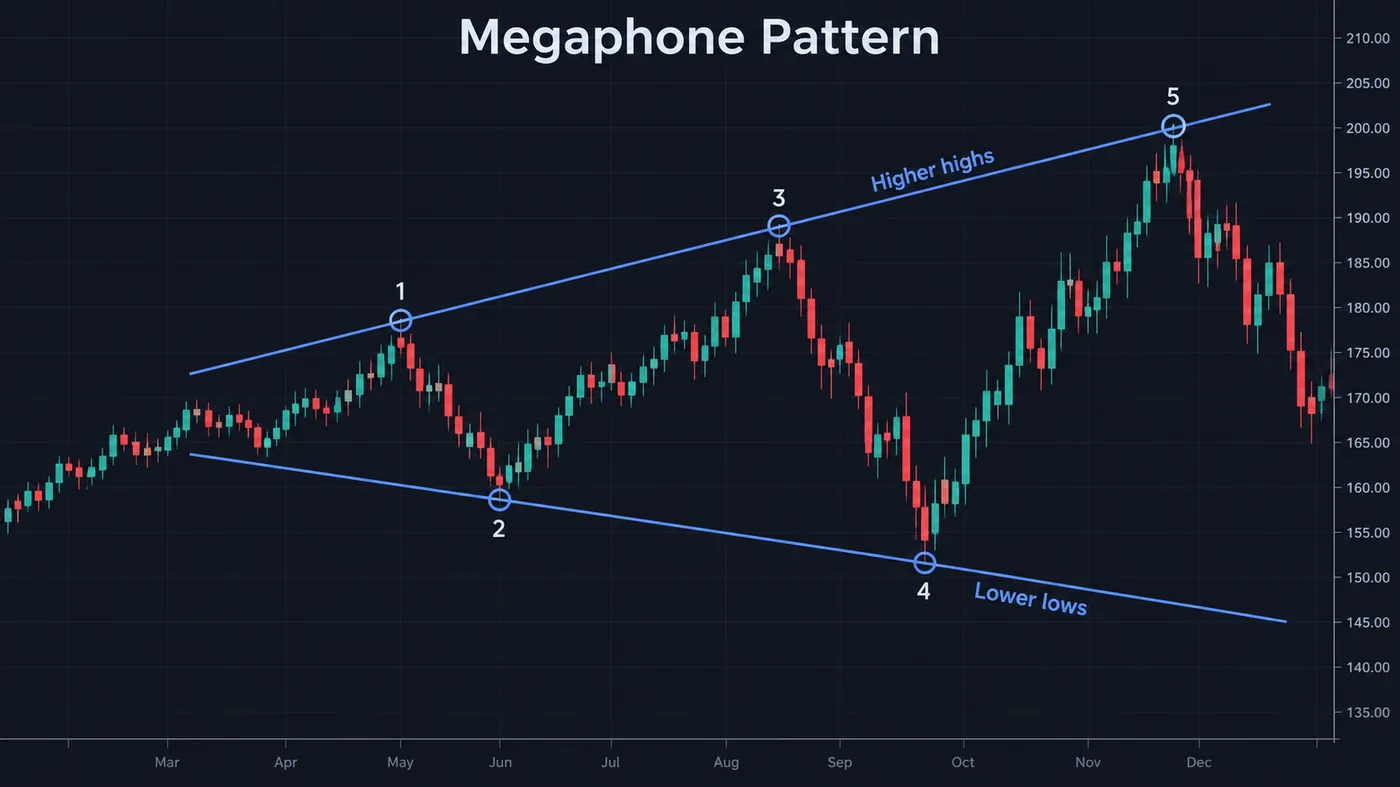
| Element | Rule | Why it matters |
|---|---|---|
| Upper line | Through at least two, preferably three, rising highs (touches 1, 3, 5) | Each higher high is a failed breakout that trapped buyers |
| Lower line | Through at least two falling lows (touches 2, 4) | Each lower low is a failed breakdown that trapped sellers |
| Divergence | The lines must diverge — highs rising and lows falling | Highs rising with lows rising is a channel; both converging is a triangle |
| Swing growth | Each swing wider than the last, typically 1.2–1.6× | Expanding volatility is the pattern; if the swings stop growing it is becoming a range |
| Volume | Rising or erratic, often heaviest at the touches | Unlike a triangle, volume does not dry up — the crowd is engaged, not waiting |
| Fifth touch | The most common resolution point | By touch 5 the pattern is widely visible and the crowd is positioned for the fade — which is why the running break through touch 5 is the trap |
| Right-angled variants | One line flat, the other diverging | A flat top with falling lows (right-angled descending) is the more bearish version; flat bottom with rising highs the more bullish |
The right-angled variants matter more than their share of the textbooks suggests. A megaphone with a flat lower line and rising highs is a market where every dip is bought at the same price and every rally goes further — that is accumulation with a noisy top, and it usually resolves up. The symmetrical version, both lines diverging, is the true indecision pattern and the one with no directional edge to speak of.
Two ways to trade it
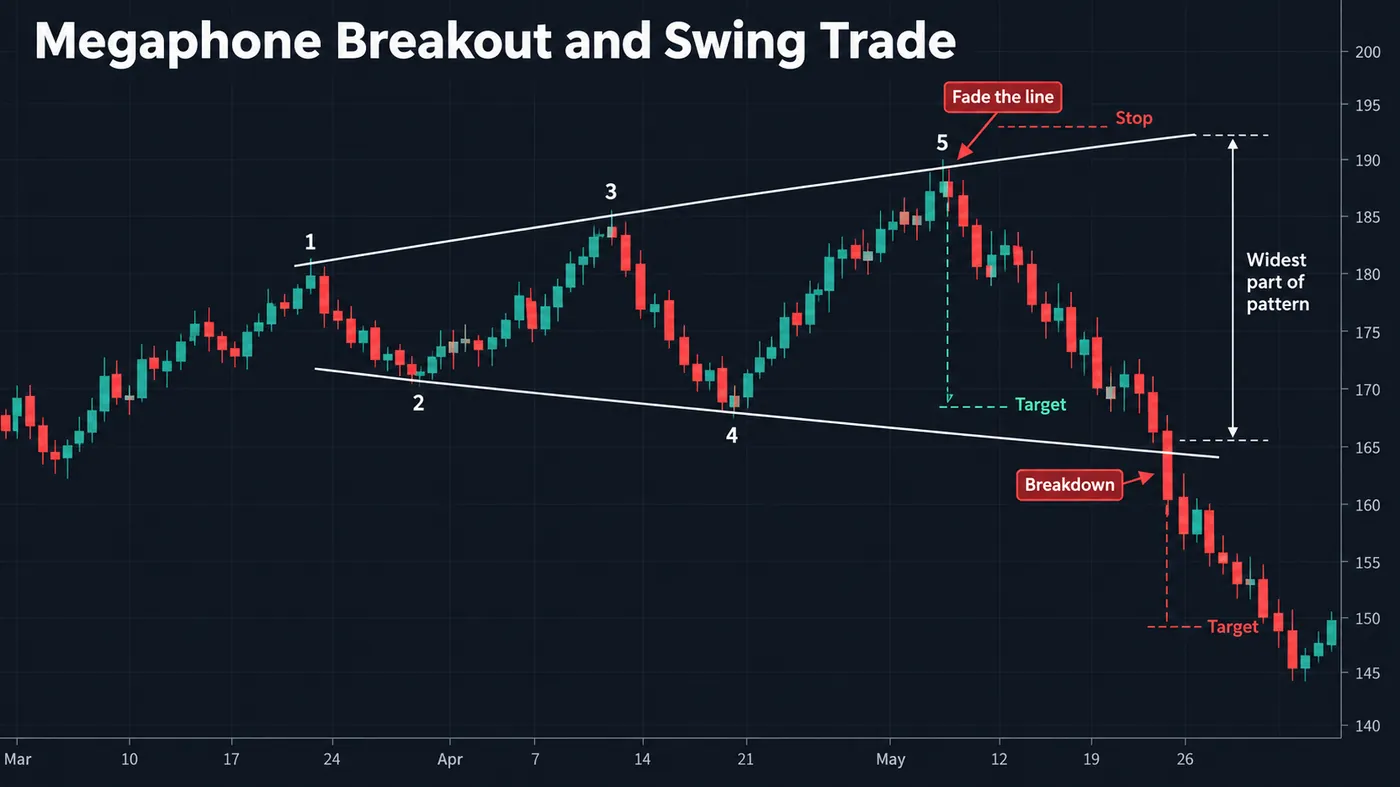
The first trade is inside the pattern: fade the lines. At the third or fifth touch of the upper line, short with the stop a little above the line and the target at the lower line; at the fourth touch of the lower line, the mirror. This works because the pattern is made of failed breakouts — the lines are where the crowd gets trapped — and because the swings are wide, so the reward from one line to the other is several times the stop needed to sit just beyond the line. It needs a rejection candle at the line: a wick through and a close back inside, an engulfing candle, a pin bar. Without one you are catching a knife in an expanding market.
The second trade is the resolution: the break. When a candle closes decisively through one of the lines — beyond the line by more than a normal touch would go, on volume — the pattern is over and the move that follows is often violent, because everyone who was fading the lines is now wrong at once. The measured target is the widest part of the pattern, the distance from the last high to the last low, projected from the break. The stop goes back inside the pattern. Because the crowd is positioned for the fade at touch 5, the "running" megaphone — the break through the upper line at touch 5 instead of a reversal there — is the version that hurts most people, and it is the reason the fade needs an honest stop.
The two trades contradict each other, and that is fine: they are taken at different moments. Inside the pattern, before the break, you fade. After a close through a line, you stop fading and go with the break. What you do not do is fade a line that has just been closed through, hoping it comes back.

Automate your trades. Let Quantum Algo trade for you.
Every signal executed on your own account — on your account, with the plan you define.
How to trade it
- Confirm the geometry. Higher highs and lower lows, at least five touches, lines diverging. Rising highs with rising lows is a channel; do not force it.
- Read the context. After a long uptrend it is a broadening top and the downside resolution has the edge; after a downtrend, the reverse. A flat lower line tilts it bullish, a flat upper line bearish.
- Fade a touch only with a rejection candle. Wick through the line, close back inside. Stop 0.5–1 ATR beyond the line; target the opposite line; take most there.
- Size the fade smaller than usual. The pattern expands; the fifth touch is where it most often breaks. A fade at touch 5 is the highest-reward and the highest-risk entry.
- On a decisive close through a line, switch. Stop fading. Trade the break with the stop back inside the pattern and the target one pattern width from the break.
- Never fade a line that has just been closed through. A break in a megaphone is the crowd being wrong all at once; it does not come back to let you in.
Megaphone planner
Put in the five touch prices, the ATR and the trend before the pattern. The tool checks that the swings actually broaden, estimates where the lower line sits now, and returns the fade plan at touch 5 — stop above the line, target at the lower line, R multiple — alongside the breakdown plan with the measured-move target. It warns when the swings are growing fast enough that the pattern is about to resolve.
Megaphone versus the patterns it is confused with
| Pattern | Highs | Lows | Volatility | Trade |
|---|---|---|---|---|
| Megaphone (broadening) | Rising | Falling | Expanding | Fade the lines inside; trade the break with the widest part as target |
| Symmetrical triangle | Falling | Rising | Contracting | Wait for the break; target the widest part |
| Channel | Rising | Rising (parallel) | Steady | Trade with the slope, buy the lower rail |
| Range / rectangle | Flat | Flat | Steady | Fade the edges; break the box |
| Diamond top | Broadening then narrowing | Broadening then narrowing | Expands then contracts | A megaphone that turned into a triangle — trade the triangle break |
| Rising wedge | Rising | Rising faster | Contracting | Bearish resolution, trade the break |
The diamond deserves a line of its own because it begins as a megaphone. When the swings stop growing and start shrinking, the broadening half is over and a triangle has started — the two halves together are the diamond. If you are fading a megaphone and the touches begin arriving inside the lines instead of at them, the pattern has changed and so should the trade.
Reference data
| Item | Value |
|---|---|
| Also called | Broadening formation, broadening top / bottom, expanding triangle, inverted triangle |
| Geometry | Two diverging trendlines; higher highs on the upper, lower lows on the lower; five touches to call |
| Volatility | Expanding — each swing wider than the last |
| Volume | Rising or erratic; does not dry up like a triangle |
| Context | Ends of long trends, around major news, high-emotion markets |
| Bias | Broadening top (after an uptrend): mild bearish edge; broadening bottom: mild bullish edge; symmetrical: none to speak of |
| Trade inside | Fade the lines with a rejection candle; stop 0.5–1 ATR beyond; target the opposite line |
| Trade the break | Close through a line on volume; stop back inside; target = widest part of the pattern from the break |
| The trap | The running megaphone — a break through the upper line at touch 5 where the crowd is short |
| Best timeframes | 4H and daily on indices, forex majors, crypto majors; intraday versions are common around news |
Worked example: NASDAQ 100 daily, a broadening top
NASDAQ 100 futures, daily chart, after a four-month uptrend. Touch 1 a high at 18,420; touch 2 a low at 17,910; touch 3 a high at 18,690, above the first; touch 4 a low at 17,560, below the second; touch 5 a high at 18,960, the third higher high. Swings of 510, 780, 1,130 and 1,400 points — each wider than the last, roughly 1.3× growth. The lines diverged cleanly, volume was heaviest on the touch days, and the context was a mature uptrend: a broadening top.
The fade at touch 5: the touch day printed a long upper wick and closed 180 points off the high — a rejection. Short at 18,780 on the next open, stop at 19,060 (about 0.75 ATR above the line), target the lower line, which by then sat near 17,400. Risk 280 points, reward 1,380 — 4.9R, which is the kind of number the fade produces and the reason the stop has to be real. The trade reached 17,620 in nine sessions before a bounce; two-thirds was taken there for 4.1R and the remainder closed at 17,700.
Then the break. Three sessions later the index closed at 17,180, below the lower line by 220 points on the heaviest volume of the pattern. Not a touch — a resolution. Short again on the close, stop back inside the pattern at 17,610 (15% of the width), target one pattern width — 1,560 points — below the break at 15,620. That is a long way, and it was not reached; the trade was stopped out on a breakeven trail at 16,900 after touching 16,430, 1.7R. Two trades, one pattern, and both were only possible because the fade was abandoned the moment the line closed.
Mistakes traders make with megaphones
- Fading without a rejection candle. The pattern expands; a line that is being touched may be about to be closed through.
- Using a normal stop. The swings are wide and the lines are where the crowd is trapped; the stop sits just beyond the line, and the size is smaller.
- Fading a line that just closed through. A megaphone break is everyone being wrong at once; it does not come back.
- Calling it too early. Three touches is a possible pattern; five is a pattern. Rising highs with rising lows is a channel.
- Expecting a directional edge. The bias after a trend is mild; the trade is the structure, not the prediction.
- Ignoring the diamond. When the swings start shrinking, the megaphone is over and a triangle has begun.
- Trading it on a low timeframe in a quiet market. The pattern needs volatility and emotion; on a dead chart it is noise with lines on it.
The megaphone and the free indicators
The pattern is made of trapped traders, and the free library reads exactly that. The Liquidity Sweeps script marks the wick through a prior high or low — every touch of a megaphone line is one — and the close back inside that makes it a fade. The Trendline Architect draws the diverging lines automatically and flags the close through one of them that ends the pattern. The Volatility Storm Tracker confirms the expanding-volatility regime that separates a real megaphone from a noisy range, and the Smart Money Concepts Engine shows the structure break on the resolution. The premium engine, Zeno, prints signals with a stop and targets; a Zeno sell signal at the fifth touch of a broadening top is the fade with the rejection already confirmed.
Higher highs, lower lows, five touches, expanding swings. Inside the pattern fade the lines — only with a rejection candle, with a tight stop and smaller size — and take most at the opposite line. The moment a candle closes decisively through a line, stop fading and trade the break with the widest part of the pattern as the target. Respect the fifth-touch trap, and if the swings start shrinking, the megaphone has become a diamond.
◆ Interactive check
Do you know which trade you are in?
Questions traders ask about the megaphone pattern
A broadening formation: two diverging trendlines with price making higher highs on the upper line and lower lows on the lower, each swing wider than the last. It needs about five touches to call and it forms when both sides are trapped in turn, usually at the end of a long trend or around major news.
Mildly directional at best. A broadening top after a long uptrend resolves down somewhat more often than up, and a broadening bottom after a downtrend resolves up more often, but the edge is modest. A flat lower line tilts it bullish and a flat upper line bearish. The reliable part is the structure — wide swings between two lines — not the direction.
Two ways. Inside the pattern, fade the lines: short at a touch of the upper line with a rejection candle, stop just beyond the line, target the lower line, and the mirror at the lower line. On a decisive close through a line, stop fading and trade the break, with the stop back inside the pattern and the target one pattern width from the break.
The widest part of the pattern — the distance from the last high to the last low — projected from the break in the direction of the break. It is a first target; the move after a megaphone break is often violent and the remainder can run on structure.
It is where most megaphones resolve. By the fifth touch the pattern is visible to everyone and the crowd is positioned to fade it, which is exactly why the running break — through the upper line at touch 5 where everyone is short — is the trap. The fade at touch 5 is the best entry and the one that most needs a real stop.
They are mirrors. A triangle has converging lines, contracting swings, drying volume, and a break from a coiled market. A megaphone has diverging lines, expanding swings, rising or erratic volume, and a whipsaw market. Triangle habits — waiting for the apex, trusting the first break — lose money in a megaphone.
A megaphone that turns into a triangle: the swings expand, then start contracting. The two halves together make a diamond. When touches start arriving inside the megaphone lines instead of at them, the broadening phase is over and the trade becomes a triangle break.
4-hour and daily charts on indices, forex majors and crypto majors, where the pattern has room to form over weeks. Intraday megaphones are common around news releases and behave the same way at smaller scale, but on a quiet low-timeframe chart the shape is usually noise.
Rising or erratic, typically heaviest on the touch days — the opposite of a triangle, where volume dries up into the apex. Volume that fades across the touches suggests the emotion is leaving and the pattern is turning into a range or a diamond.
Not a pattern classifier. The Trendline Architect draws the diverging lines automatically and flags the close through one, the Liquidity Sweeps script marks the wick-and-reject at each touch that makes a fade valid, and the Volatility Storm Tracker confirms the expanding-volatility regime. Zeno, the premium engine, prints signals with a stop and targets; a Zeno sell signal at a fifth-touch rejection is the fade with the confirmation done.
References & Related Guides
Read next
- Chart Patterns: Complete Guide
- Triangle Pattern
- Rising Wedge Pattern
- Double Top Pattern
- Swing Failure Pattern (SFP)
- Engulfing Candle
- Breakout Trading Strategy
- ATR: Average True Range
- Liquidity Sweeps (free indicator)
- Trendline Architect (free indicator)
- Swing Failure Pattern — glossary
- Zeno — the premium engine