Tweezer Top and Tweezer Bottom: The Two-Candle Level Test and How to Trade It
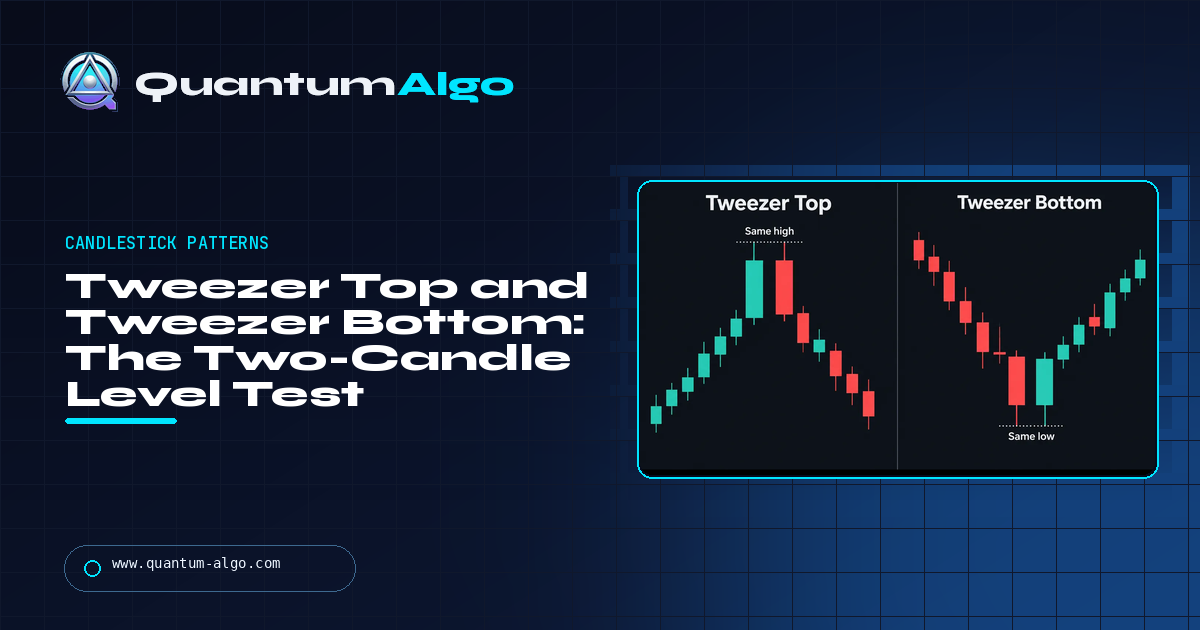
A tweezer top is two consecutive candles with the same high; a tweezer bottom is two with the same low. The first candle continues the trend, the second reverses it, and the matching extreme is the price the market tested twice in a row and was refused twice. The pattern only means something at a level — a prior swing, a zone, a range edge — after a trend that has something to reverse; away from a level it is noise, and tweezers are everywhere. The trade is the third candle: a close beyond the pair (above the tweezer highs for a bottom, below the tweezer lows for a top) is the entry, the stop sits about a quarter of an ATR beyond the matching extreme, and the target is the last swing, then the next level. The tight stop is the pattern's main advantage.
Tweezers are the candlestick pattern that beginners find first and abandon fastest, because they are on every chart every day and most of them do nothing. That is not a flaw in the pattern; it is a flaw in reading candles before reading levels. Put the level first and the tweezer becomes one of the cleanest two-candle reversal signals available, with the tightest structural stop in candlestick trading. This page is the definition and the rules with real tolerances, why the location and the third-candle confirmation are non-negotiable, the trade for both versions, how tweezers relate to engulfing candles, pin bars, double tops and the swing failure pattern, a GBPUSD 4-hour tweezer bottom at a prior low, and the mistakes that make the pattern look worse than it is. The checker tests the match, the level and the context and returns the plan.
Indicators that prove themselves in public.
One engine, four precision tools — the Gold (XAU) Scalper, the institutional Gravity Zone, the Zeno momentum Oscillator, and Zeno Stocks for equities.



What tweezer tops and bottoms are
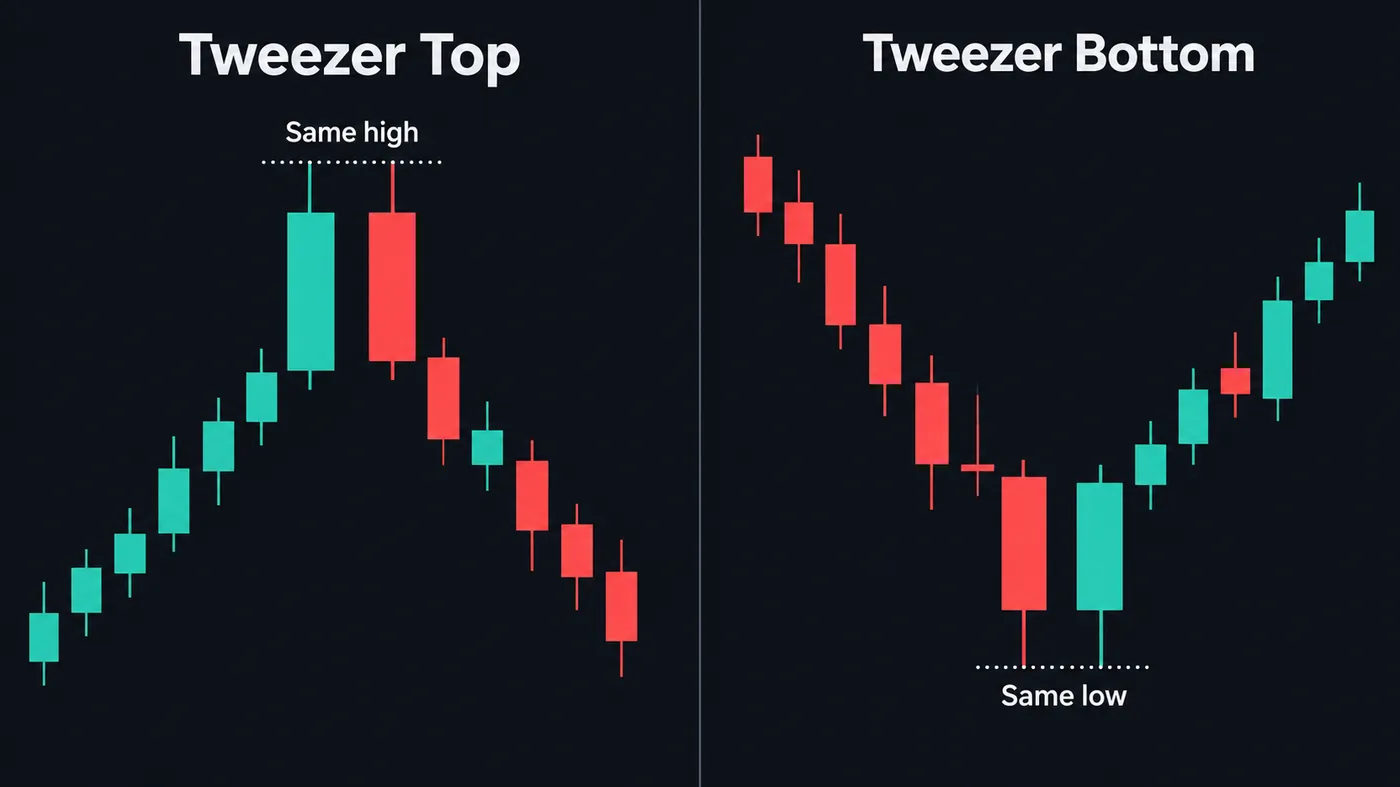
A tweezer is two consecutive candles with the same high (a tweezer top) or the same low (a tweezer bottom). In the textbook version the first candle continues the trend — a tall green candle into a tweezer top, a tall red one into a tweezer bottom — and the second reverses it, with the matching extreme marking the exact price the market tested twice and was refused twice. Steve Nison brought the pattern west with the rest of the Japanese candlestick canon; the name is the picture, two prongs at one level.
What the two candles record is simple. Price reached a level, was pushed back, and on the next candle went back to exactly the same level and was pushed back again. Once is a wick; twice in a row at the same price is a wall. The pattern is the wall, and the second refusal is the evidence that it is real. That is also the pattern's limitation: it says a level held for two candles, and nothing about whether it will hold for a third. On its own, on any chart, tweezers are everywhere and most of them mean nothing. At a support or resistance that matters, after a trend that has something to reverse, they are one of the cleanest two-candle reversal signals there is — and the matching extreme gives you the tightest logical stop in candlestick trading.
What they are not: a standalone strategy. The candlestick patterns guide makes the general point and it applies here with force — a candlestick pattern is a confirmation at a level, not a reason to be at the level.
Anatomy and the rules
| Rule | Tweezer top | Tweezer bottom | Tolerance |
|---|---|---|---|
| The match | Two consecutive highs at the same price | Two consecutive lows at the same price | Within about 10% of ATR — a tick or two on liquid markets |
| First candle | Green, continuing the uptrend | Red, continuing the downtrend | Colour matters less than the trend it extends |
| Second candle | Red, closing well into the first | Green, closing well into the first | A body of at least 0.4 ATR; a doji second candle is a weaker version |
| Location | At resistance, a prior high, a supply zone, a round number | At support, a prior low, a demand zone, a round number | Within half an ATR of the level; further away it is noise |
| Context | An uptrend into it — a rally to reverse | A downtrend into it — a decline to reverse | No trend, no reversal |
| Confirmation | A third candle closing below the tweezer lows | A third candle closing above the tweezer highs | The entry; without it the pattern is a warning, not a trade |
| Stop | Just above the matching highs | Just below the matching lows | About 0.25 ATR beyond — a close beyond the match ends the pattern |
| Target | The last swing low, then the next level | The last swing high, then the next level | Take most at the first swing |
Two things in the table are stricter than most descriptions. The location rule — within half an ATR of a level — is what removes ninety per cent of tweezers from consideration, and that is the point; the pattern has no meaning away from a price that other traders also care about. And the confirmation rule: the third candle closing beyond the pair. Nison's own view was that tweezers are a minor pattern that needs other evidence, and the third candle is the cheapest evidence there is. Without it you are trading a level that held for two candles; with it you are trading a level that held and then pushed price the other way.
Trading the pattern
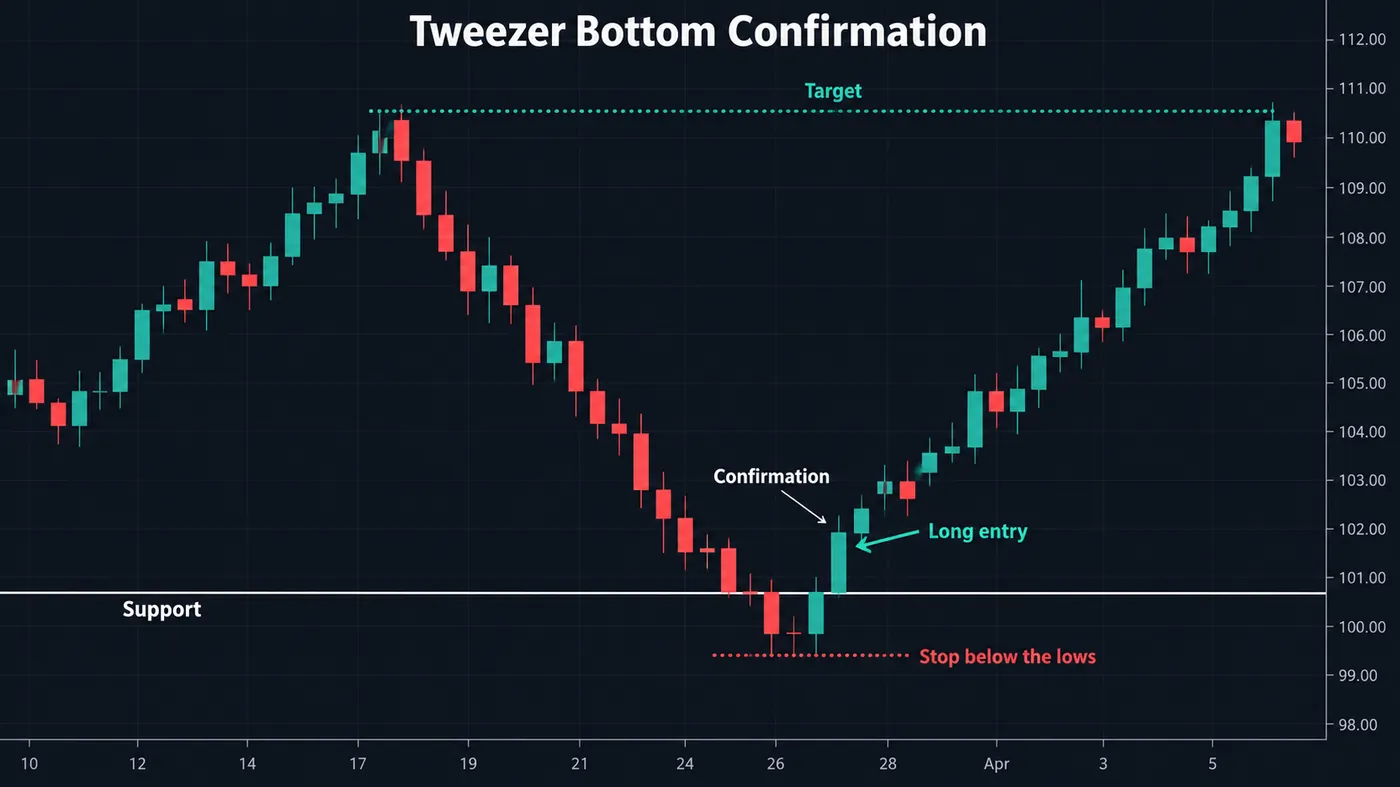
The setup is the level first and the candles second. You are watching a support — a prior swing low, a demand zone, the bottom of a range, a level the Institutional Key Levels script has drawn — and price comes down to it in a downtrend. A red candle reaches the level and closes off its low. The next candle opens, tests the same low to the tick, and closes green, well up into the red candle's body. That is the tweezer bottom. Nothing happens yet.
The third candle is the trade. If it closes above the higher of the two tweezer highs, the level has not only held but reversed price, and the long is taken on that close with the stop a quarter of an ATR below the matching lows. The first target is the last swing high; the second, if the trend context allows, is the next level above. Reward to risk is usually good because the stop is tight — the two matching lows are the whole thesis, and a close below them means the thesis is wrong — and the first swing is usually several times the stop away. If the third candle closes inside the pair, wait; if it closes below the lows, the pattern has failed and the level is likely to break.
The tweezer top is the mirror at resistance in an uptrend: green candle to the level, red candle to the same high closing down into the green body, third candle closing below the pair, short on that close, stop above the matching highs, target the last swing low. Both versions are stronger when the second candle is large, when the matching extreme is a wick rather than a body (a wick says the level was tested intrabar and rejected, a flat body says the candle simply opened or closed there), and when the pair sits on a level that has a reason to exist beyond the pattern.

Automate your trades. Let Quantum Algo trade for you.
Every signal executed on your own account — on your account, with the plan you define.
How to trade it
- Start with the level, not the candles. Support or resistance with a reason — a prior swing, a zone, a range edge, a round number. A tweezer away from a level is discarded.
- Require the trend into it. A tweezer bottom needs a decline to reverse; a tweezer top needs a rally. In a range, the pattern at the edges is fine; mid-range it is noise.
- Check the match and the second candle. Highs or lows within a tick or two, and a second candle with a real body closing well into the first. A doji second candle is a weak version.
- Wait for the confirmation candle. A close beyond the pair — above the tweezer highs for a bottom, below the tweezer lows for a top. That close is the entry.
- Stop just beyond the matching extreme. About 0.25 ATR. A close beyond the match means the level is breaking; the tight stop is the pattern's main advantage.
- First target the last swing, then the next level. Take most at the swing. If the first swing is under 1.5R away, the setup does not pay for its own stop — skip it.
Tweezer checker
Put in the open, high, low and close of both candles, the ATR, the nearest level, the trend into the pair and the last swing as the target. The tool tests whether the highs or lows match within a tenth of an ATR, whether the colours reverse, whether the pair sits on the level, and whether there is a trend to reverse — then returns the confirmation price, the stop beyond the match and the R multiple, and tells you when the setup does not pay for its own stop.
Tweezers versus the patterns they resemble
| Pattern | Candles | Signal | Compared with the tweezer |
|---|---|---|---|
| Tweezer top / bottom | Two, matching high or low | A level tested twice in a row and refused | The tightest stop of the reversal patterns; needs a third-candle close |
| Engulfing | Two, second body swallows the first | A full reversal of the prior candle | Stronger on its own; a tweezer whose second candle engulfs the first is both patterns at once |
| Pin bar / hammer / shooting star | One, long wick | A single intrabar rejection | The tweezer is two rejections; a hammer followed by a matching-low candle is a tweezer bottom with a stronger first candle |
| Doji at a level | One, open ≈ close | Indecision | A tweezer with a doji second candle is the weakest tweezer |
| Double top / bottom | Many, two swings at one price | The same idea at swing scale | A tweezer is a double top compressed into two candles; the double top has a neckline and a measured target, the tweezer does not |
| Swing failure pattern | One or two, wick through a prior extreme and close back | A stop hunt | A tweezer whose second candle wicks slightly through the first before closing back is an SFP on the lower timeframe |
The last row is worth keeping in mind on the way down to lower timeframes. What looks like an exact match on the 4-hour chart is often, on the 15-minute, the second candle poking a few ticks through the first — taking the stops under the first low — before reversing. That is the swing failure pattern, and it is why the tolerance in the rules is a tick or two rather than zero: the best tweezers frequently overshoot by a hair.
Reference data
| Item | Value |
|---|---|
| Origin | Japanese candlestick analysis; introduced to Western traders by Nison (Japanese Candlestick Charting Techniques) |
| Definition | Two consecutive candles with matching highs (top) or matching lows (bottom) |
| Type | Minor two-candle reversal; needs a level, a trend into it, and confirmation |
| Match tolerance | About 10% of ATR — a tick or two on liquid markets |
| Confirmation | A third candle closing beyond the pair |
| Stop | ~0.25 ATR beyond the matching extreme |
| Target | The last swing, then the next level; skip if the first swing is under 1.5R |
| Strongest when | The second candle is large, the match is on wicks, the pair sits on a level with a reason to exist |
| Weakest when | Mid-range, no trend into it, doji second candle, matching bodies rather than wicks |
| Best timeframes | 1H to daily; on 1–5-minute charts the matches are constant and meaningless |
Worked example: GBPUSD 4-hour, a tweezer bottom at a prior low
GBPUSD, 4-hour chart, in a decline from 1.2780 that had run for six sessions. A prior swing low sat at 1.2612 from three weeks earlier — a level with a reason. The 08:00 candle fell to 1.2609, three pips under the old low, and closed at 1.2631, red, with a long lower wick. The 12:00 candle opened at 1.2630, fell to 1.2610 — one pip from the first low, well inside a tenth of the 4-hour ATR of 42 pips — and closed green at 1.2668, thirty-seven pips up and above the midpoint of the red candle. Matching lows on wicks, colours reversed, a real second body, sitting on a prior low after a decline. A tweezer bottom with everything in the table.
The 16:00 candle closed at 1.2681, above the higher of the two tweezer highs at 1.2672. Confirmation. Long at 1.2681, stop at 1.2599 — ten pips, a quarter of the ATR, below the lower of the two matching lows — for 82 pips of risk. First target the last swing high at 1.2790, 109 pips away, 1.3R; that is under the 1.5R rule on its own, so the trade was sized for the second target, the next level at 1.2850, 169 pips and 2.1R. Two-thirds off at 1.2790 two days later, the remainder at 1.2848 on the fourth day. The pattern did not predict the rally; the level did. The pattern said the level was holding, and the third candle said the market agreed.
Mistakes traders make with tweezers
- Trading every match. Tweezers are everywhere; the ones away from a level are noise with matching wicks.
- Entering on the second candle. The pattern is complete but unconfirmed; the third candle's close is the entry.
- Skipping the trend check. A tweezer bottom in an uptrend is a pullback candle pair, not a reversal.
- Loosening the stop. The matching extreme is the thesis; a stop far beyond it throws away the pattern's one structural advantage.
- Taking it on the 1-minute chart. Matching highs and lows every few candles mean nothing at that scale.
- Ignoring the second candle's body. A doji second candle is the weakest version and needs the confirmation most.
- Expecting a measured move. The tweezer has no target of its own; the target is the last swing and the next level.
Tweezers and the free indicators
The pattern is a level test, so the tools that matter are the ones that draw the level and read the test. The Institutional Key Levels script puts the support and resistance on the chart before the candles arrive, which is the order this pattern has to be traded in. The Liquidity Sweeps script marks the second candle's small overshoot through the first — the stop hunt that the best tweezers contain. The Market Bottom Finder adds the exhaustion reading that says a decline into a tweezer bottom has something to reverse, and the Order Blocks with Volume script shows whether the level the pair sits on is a zone with institutional footprints. The premium engine, Zeno, prints signals with a stop and targets; a Zeno buy signal on the confirmation candle of a tweezer bottom at a key level is the whole setup with the levels already placed.
Level first, candles second. A tweezer is a price tested twice in consecutive candles and refused twice; it matters at a support or resistance after a trend, and nowhere else. Wait for the third candle to close beyond the pair, enter on that close, put the stop just beyond the matching highs or lows, and take most at the last swing. The tight stop is the whole advantage — do not loosen it.
◆ Interactive check
Do you know when a tweezer is a trade?
Questions traders ask about tweezer tops and bottoms
Two consecutive candles with the same high, appearing at resistance after a rally: the first is green and continues the move, the second is red and closes down into the first candle's body. The matching high is the price the market tested twice in a row and was refused twice.
The mirror at support after a decline: two consecutive candles with the same low, the first red, the second green and closing well up into the first. It is a bullish reversal signal when it sits on a level with a reason to exist and is confirmed by a third candle closing above the pair.
Within about a tenth of the ATR — a tick or two on liquid markets. The best tweezers often overshoot by a hair, with the second candle poking slightly through the first before closing back, which is a stop hunt on the lower timeframe and strengthens the pattern rather than invalidating it.
On its own, no — tweezers appear constantly and most mean nothing. At a support or resistance with a reason, after a trend into it, with a real second candle and a third-candle confirmation, it is a clean two-candle reversal with the tightest structural stop in candlestick trading. The reliability is in the level and the confirmation, not the two candles.
Wait. The pattern is complete on the second candle but unconfirmed; the entry is a third candle closing beyond the pair — above the tweezer highs for a bottom, below the tweezer lows for a top. If the third candle closes inside the pair, keep waiting; if it closes beyond the matching extreme, the pattern has failed.
Just beyond the matching extreme — about a quarter of an ATR below the matching lows for a bottom, above the matching highs for a top. The match is the entire thesis, so a close beyond it means the level is breaking. Loosening the stop throws away the pattern's main advantage.
The tweezer has no measured move of its own. The first target is the last swing — the previous swing high for a bottom, swing low for a top — and the second is the next level. If the first swing is under about 1.5R away, the setup does not pay for its stop and is skipped.
An engulfing candle's body swallows the previous candle's body; a tweezer matches the previous candle's high or low. They overlap: a tweezer whose second candle also engulfs the first is both patterns at once and is a stronger signal than either alone.
One-hour to daily charts. On 1- to 5-minute charts matching highs and lows occur every few candles and carry no information; on the 4-hour and daily, a match to the tick at a known level is a real event.
Not a candlestick classifier. The Institutional Key Levels script draws the support and resistance the pattern has to sit on, the Liquidity Sweeps script marks the second candle's overshoot through the first, the Market Bottom Finder reads exhaustion into a tweezer bottom, and Order Blocks with Volume shows whether the level is a zone with institutional footprints. Zeno, the premium engine, prints signals with a stop and targets on the confirmation candle.
References & Related Guides
Read next
- Candlestick Patterns: Complete Guide
- Engulfing Candle
- Hammer Candlestick
- Shooting Star Pattern
- Pin Bar Trading
- Doji Candlestick
- Double Top Pattern
- Swing Failure Pattern (SFP)
- Support and Resistance
- Institutional Key Levels (free indicator)
- Market Bottom Finder (free indicator)
- Zeno — the premium engine