Elliott Wave Flat Corrections: Regular, Expanded and Running Flats, and How to Tell Them From a Zigzag
A flat correction is a three-wave sideways correction in Elliott Wave theory, labelled A-B-C and subdividing 3-3-5, so it moves broadly sideways rather than sharply against the trend like a zigzag. There are three kinds: the regular flat (B retraces about 90% of A, C ends slightly beyond A), the expanded flat — the most common — (B exceeds the start of A, sweeping the prior extreme, and C runs well beyond A, often to 1.618 × A), and the running flat (B exceeds A's start but C fails to reach A's end, a sign of a strong trend). The expanded flat's wave B is a liquidity sweep with a name.
Our Elliott wave guide covers the rules and the count; it names the flat and moves on, and the flat is where most real corrections live. This page is the correction itself: the three variants drawn to the same scale, an expanded flat on a real chart, the tell that separates a flat from a zigzag, how to identify one as it forms, the two ways to trade it, where flats sit in the larger count, a worked Bitcoin example and the checklist. The identifier below tells you which flat you are looking at from three numbers.
Indicators that prove themselves in public.
One engine, four precision tools — the Gold (XAU) Scalper, the institutional Gravity Zone, the Zeno momentum Oscillator, and Zeno Stocks for equities.



What is a flat correction in Elliott Wave?
A flat correction is a three-wave sideways correction in Elliott Wave theory, labelled A-B-C, in which the three waves subdivide 3-3-5 — wave A is three waves, wave B is three waves and retraces most or all of A, and wave C is five waves — so that the correction moves broadly sideways rather than sharply against the trend the way a zigzag does. There are three kinds: the regular flat, where B retraces about 90% of A and C ends slightly beyond A; the expanded flat, the most common in real markets, where B exceeds the start of A (it sweeps the prior extreme) and C then ends well beyond the end of A; and the running flat, where B exceeds the start of A but C fails to reach the end of A, a sign of a strong underlying trend. Knowing which one is forming decides where the correction ends, and the expanded flat's wave B is the single most useful thing Elliott gives a Smart Money trader, because it is a liquidity sweep with a name.
The three flats side by side
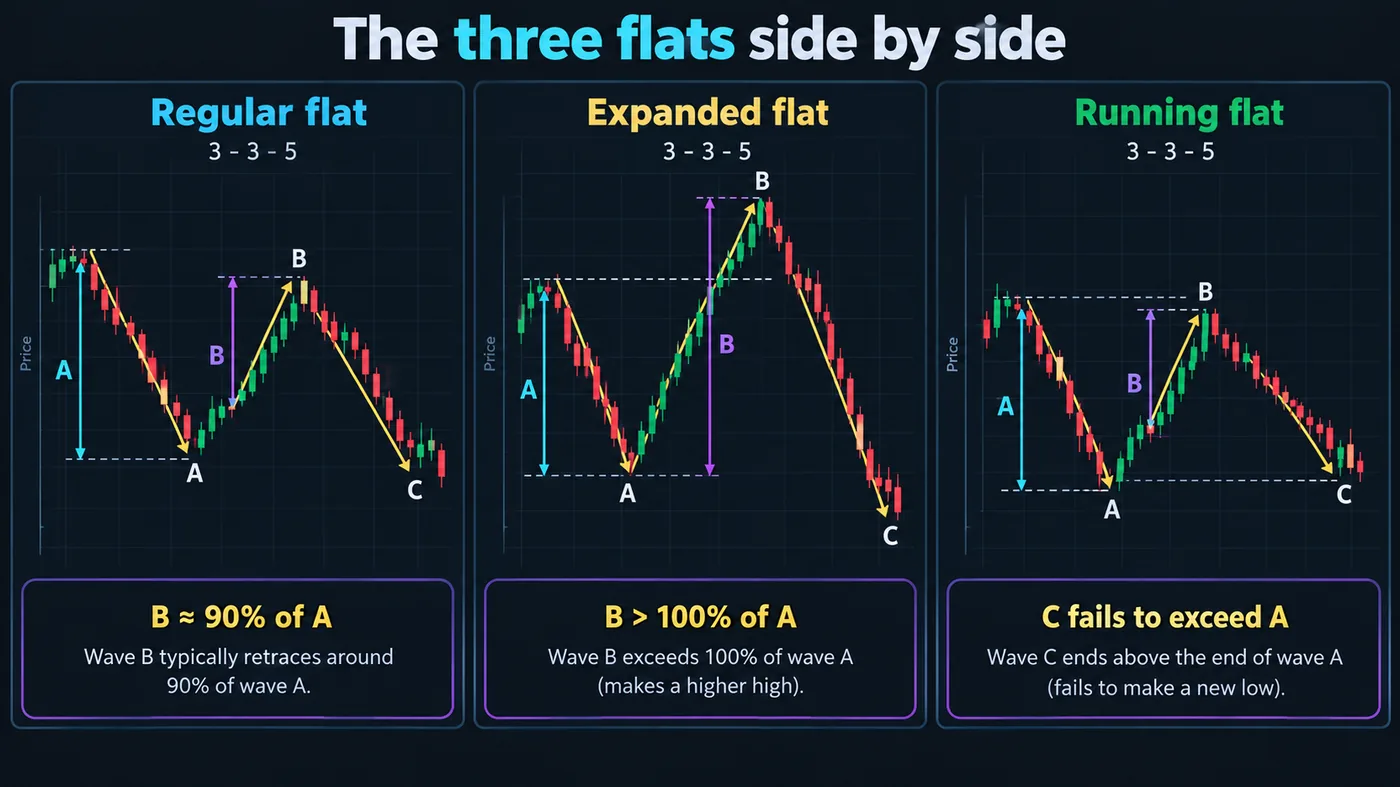
The three-panel illustration in this guide draws them to the same scale so the difference is in wave B and wave C:
- Regular flat (3-3-5). B retraces roughly 90% of A — nearly back to where the correction started; C ends slightly beyond the end of A. A tidy sideways box.
- Expanded flat (3-3-5). B goes beyond the start of A — it makes a new high in a bullish correction, or a new low in a bearish one — and C then runs well beyond the end of A, often to 1.618 × A. The correction is wider than the move it corrects and traps traders in both directions.
- Running flat (3-3-5). B goes beyond the start of A like the expanded version, but C is truncated — it fails to reach the end of A. The trend is so strong that the correction cannot even complete its shape.
The proportions, as Elliott and Prechter describe them: regular B ≈ 0.9 × A and C ≈ 1.0–1.1 × A; expanded B ≈ 1.05–1.38 × A and C ≈ 1.6–2.6 × A; running B beyond A and C < A.
An expanded flat on a real chart
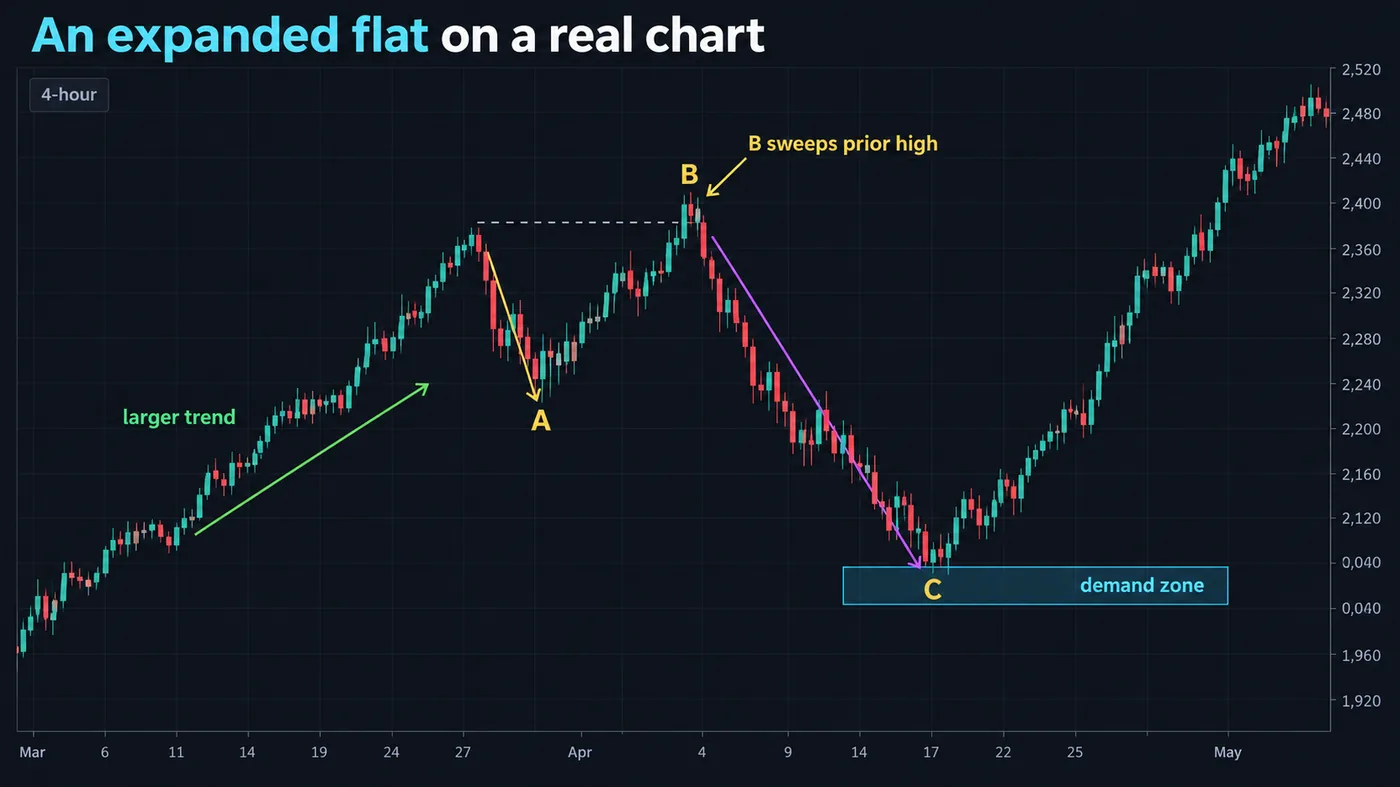
The chart illustration in this guide is a 4-hour chart inside a larger uptrend: wave A drops from the swing high in three legs; wave B rallies past the swing high — sweeping the buy stops above it and printing what looks like a breakout — then wave C falls in five legs to a demand zone below the end of A, where the trend resumes. Three things to notice: the B wave's new high was a sweep, not a continuation; the C wave was the real correction; and the low of C landed on the order block the impulse had left. That is the expanded flat, and it is also, in Smart Money vocabulary, a liquidity sweep followed by a return to demand. Two languages, one event.

Automate your trades. Let Quantum Algo trade for you.
Every signal executed on your own account — on your account, with the plan you define.
Flat versus zigzag
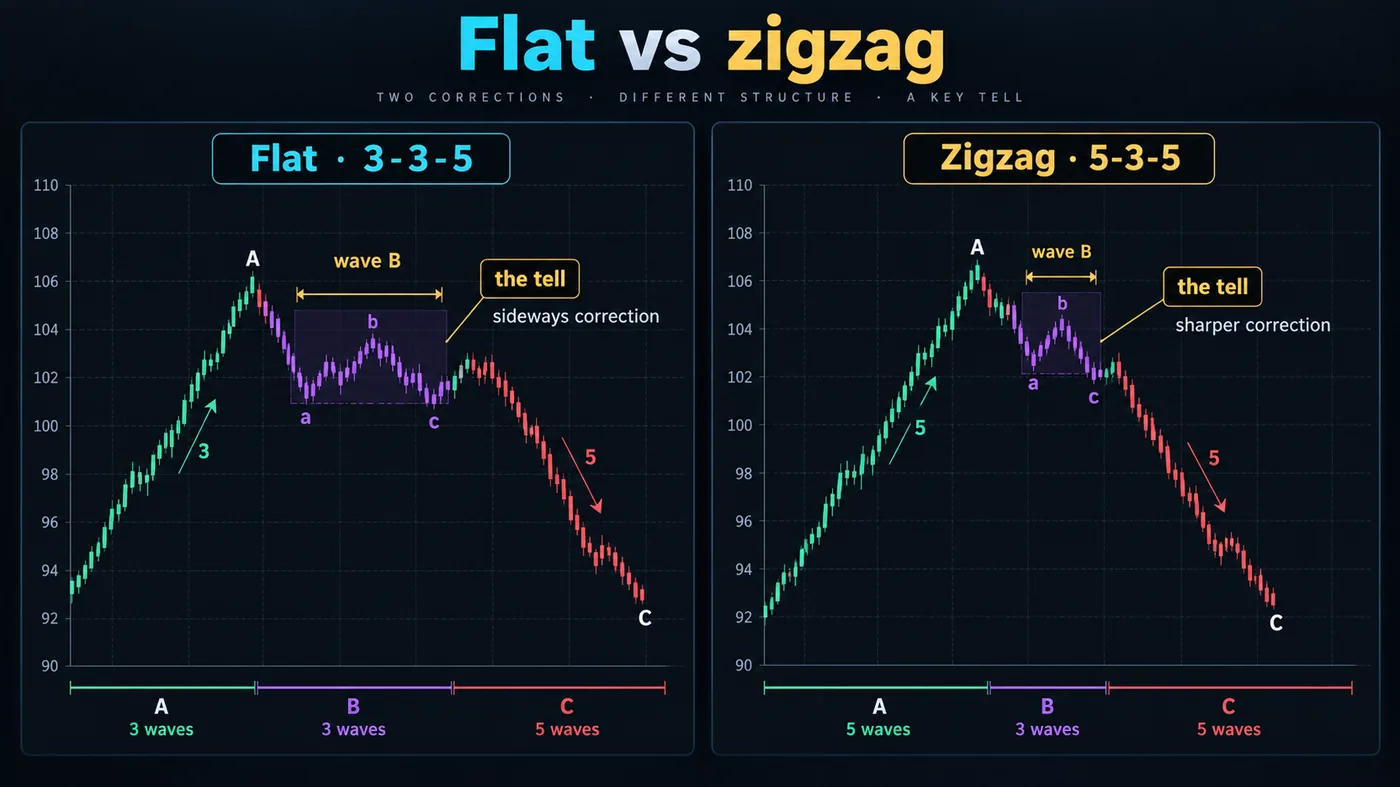
The comparison illustration in this guide puts the two correction families side by side. A zigzag subdivides 5-3-5: wave A is an impulse (five waves), B a small three-wave bounce that retraces less than A, and C another five. It is sharp and directional — a correction that looks like a trend. A flat subdivides 3-3-5 and is sideways: A is only three waves, B is deep or beyond, C completes the shape. The tell is wave B: shallow (under 62% of A) and quick suggests a zigzag; deep (90% or beyond) suggests a flat — and beyond the start of A, an expanded or running flat. Counting wave A's internal structure is the confirmation: three waves means flat, five means zigzag.
How to identify a flat as it forms
- Confirm the larger trend and the impulse it is correcting — flats are corrections; without an impulse there is nothing to correct.
- Watch wave A — if it subdivides into three legs and stalls without much depth, expect a flat.
- Watch wave B — if it retraces most of A, a regular flat; if it exceeds the start of A, an expanded or running flat. This is the sweep of the prior extreme; the Liquidity Sweeps indicator marks it.
- Project wave C — regular: slightly beyond the end of A; expanded: 1.618 × A from the end of B is the common target; running: watch for five waves that stall before the end of A.
- Locate the end of C on structure — the demand or supply zone the impulse left (an order block, a ranked level); the Fibonacci extension gives the region, the structure gives the price.
Trading the flats
- The expanded-flat B-wave fade (advanced). When B exceeds the start of A on a sweep and reverses with a change of character, C is due; short (in a bullish correction) toward the 1.618 extension with the stop above B's extreme. Counter-trend, quick, and only for traders who take sweep-reversals already.
- The end-of-C entry (the standard trade). Wait for C to complete five waves into structure, then enter with the larger trend — the resumption after the correction. Stop beyond C's extreme; target the next impulse's projection. This is the Elliott version of the order-block retest, and the two agree on the price.
- The running-flat signal. A B beyond A followed by a C that fails to reach the end of A tells you the trend is strong; the trade is the continuation the moment C's fifth wave ends, sized normally, target the extension of the larger impulse.
Flats within the larger count
Flats appear most often as wave 4 of an impulse (alternating with a zigzag in wave 2 — the guideline of alternation), as wave B of a larger zigzag, and inside triangles. A wave-4 flat that exceeds the wave-1 territory violates the rule and the count is wrong; an expanded flat in wave 4 that sweeps the wave-3 high is common and is exactly the liquidity grab before the fifth wave. Our Elliott wave guide covers the rules and the count; this page is the correction the guide only names.
A worked example: an expanded flat as wave 4
Bitcoin, 4-hour. Wave 3 of an impulse tops at $71,200 on a displacement candle that leaves an order block at $67,800–68,300. Wave A drops in three legs to $68,900 — shallow, overlapping, a flat's opening. Wave B rallies in three legs to $71,650, above the wave-3 high: buy stops taken, "new high" headlines, the Liquidity Sweeps tool prints a bearish sweep. Wave C falls in five clean legs; 1.618 × A from the end of B projects $67,930 — inside the order block. Price reaches $68,050, prints a bullish change of character on the 1-hour chart, and wave 5 begins. The entry was the retest of the block after the change of character — the standard Smart Money trade — and the Elliott count told the trader three days earlier where to expect it and why the "breakout" at $71,650 was not one.
The flat checklist
- An impulse exists to correct; the flat is a correction, never a trend.
- Wave A subdivides into three; if it is five, think zigzag.
- Wave B retraces 90% or more of A (regular) or exceeds A's start (expanded / running).
- B's excursion beyond A's start coincides with a liquidity sweep of the prior extreme.
- Wave C subdivides into five; project 1.0–1.1 × A (regular) or 1.618 × A (expanded) from the end of B.
- C's end coincides with structure — the order block or ranked level the impulse left.
- Entry with the larger trend after C completes and a change of character prints; stop beyond C.
- A wave-4 flat must not enter wave-1 territory; if it does, recount.
Flats on different timeframes
On the daily and weekly charts, flats are the multi-month consolidations that end bull-market corrections — the expanded flat's B wave is the "double top" that breaks the previous high by a fraction before the real leg down. On the 15-minute chart, flats are the session ranges: the Asian session builds A and B, London prints C into demand, New York resumes the trend. The proportions are the same; the Smart Money reading — sweep, then return to the zone — is the same; only the clock changes.
Three waves sideways, 3-3-5, in three sizes: regular, expanded, running. Watch wave B — a deep retrace is a flat, a move beyond A's start is an expanded or running flat and a liquidity sweep — and trade the end of wave C on the structure the impulse left, with the larger trend. Elliott names the shape; Smart Money names the mechanism; the price is the same.
◆ Interactive check
Do you know your flats?
Questions traders ask about Elliott flats
In a regular flat wave B retraces about 90% of A and C ends just beyond A; in an expanded flat B exceeds the start of A and C runs well beyond the end of A, typically to 1.618 × A. The expanded flat is the more common and the more useful.
A flat whose B exceeds the start of A but whose C fails to reach the end of A — a truncated correction that shows the underlying trend is strong.
Wave A: three waves in a flat, five in a zigzag. Wave B: deep or beyond A's start in a flat, shallow in a zigzag. Flats move sideways; zigzags are sharp.
Commonly at 1.618 × the length of A measured from the end of B, and in practice at the demand or supply zone the impulse left; use the extension for the region and structure for the price.
Yes — it takes the stops beyond the prior extreme and reverses; Elliott named the shape, Smart Money Concepts name the mechanism. The Liquidity Sweeps indicator marks it.
No — Zeno reads structure, and the free indicators mark sweeps and zones. The end of an expanded flat's wave C is usually a Zeno entry; the count is a way to anticipate it.
Because markets sweep liquidity before reversing: wave B's move beyond the prior extreme takes the stops there, which is why the expanded version appears more often than the tidy regular flat in real charts.
Yes, though wave 2 is more often a zigzag and wave 4 a flat (the guideline of alternation). A flat in wave 2 tells you to expect a sharp wave 4.
Typically 1.05–1.38 × A beyond the start of A; beyond about 1.38 the count is suspect and a different structure is likely.
Extend to 2.618 × A as the next common target; beyond that, the "correction" may be the start of a new trend and the count should be revisited.
Constantly — the Asian session builds A and B, London prints C into demand, New York resumes. The proportions and the Smart Money reading are the same as on the daily.
No; Zeno reads structure and the free indicators mark sweeps and zones. The end of an expanded flat's wave C is usually a Zeno entry, and the count is a way to anticipate it.
References & Related Guides
Read next
- Elliott Wave Theory: Complete Guide
- Liquidity Sweep Trading
- Fibonacci Retracement
- Wyckoff Method
- BOS & CHoCH: Market Structure
- Liquidity Sweeps (free indicator)
- Order Blocks with Volume (free indicator)
- Zeno — the premium engine