Linear Regression Channel: How to Draw, Read and Trade It
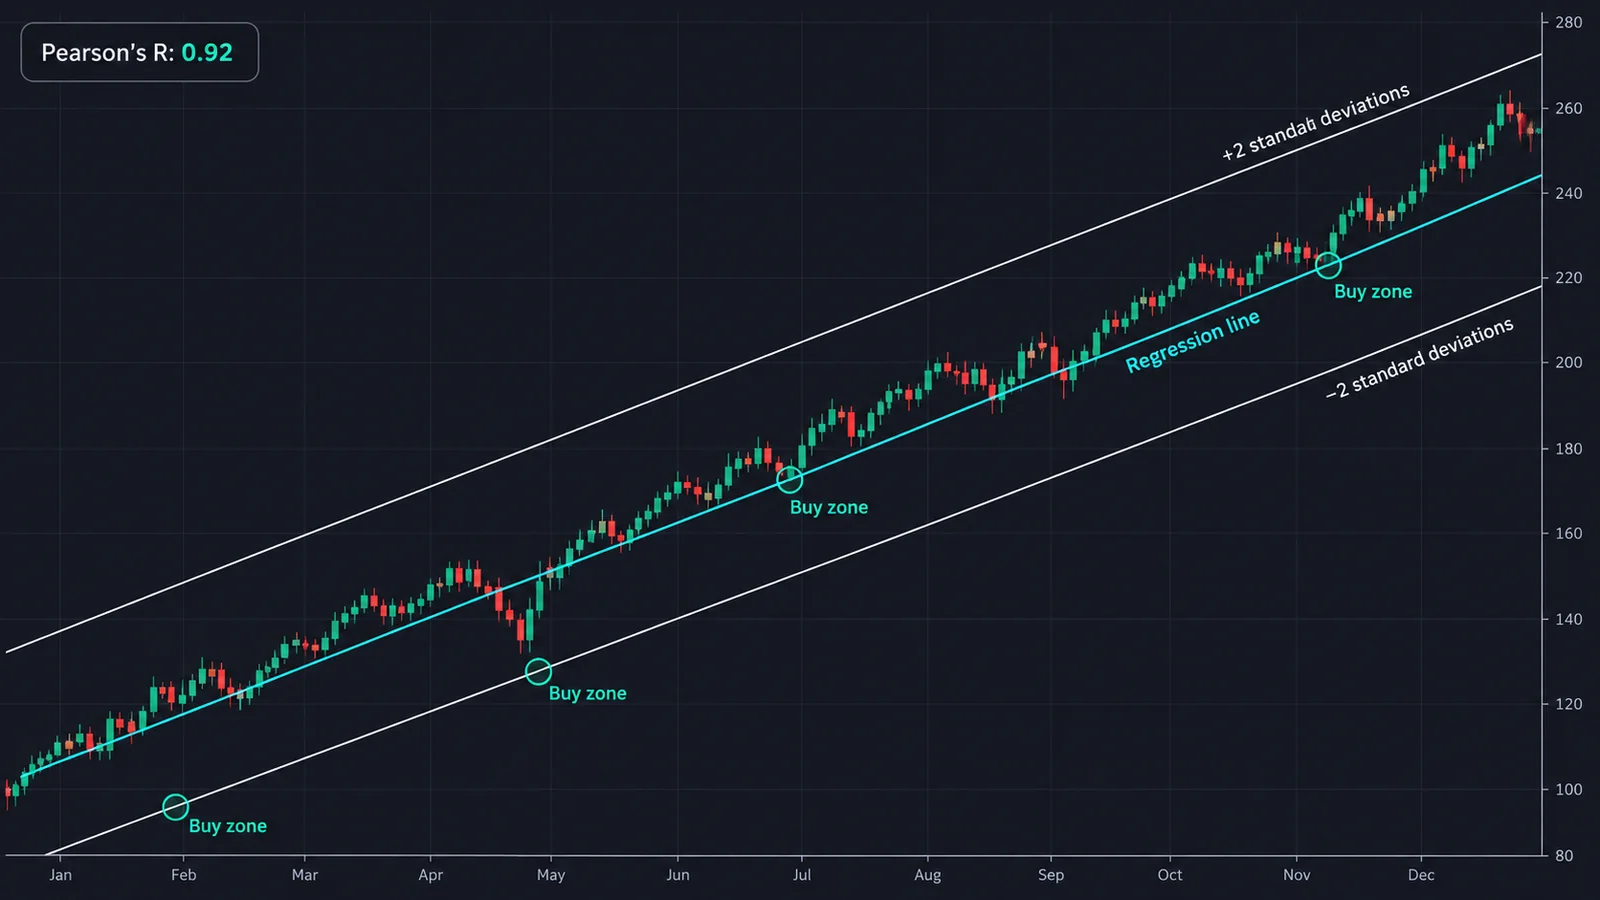
A linear regression channel draws the best-fit straight line through a set of closing prices (the least-squares line) and adds two parallel lines a set number of standard deviations above and below it, usually two. The midline shows the trend's direction and slope; the outer lines show how far price normally strays from it. Traders buy near the lower line in an uptrend channel and sell near the upper line in a downtrend channel, and treat a close outside the channel as a sign the trend may be changing. On TradingView the built-in Linear Regression Channel defaults to 100 bars and 2 deviations. Because the line is refitted on every new bar, past channels shift, so judge it in real time.
Trendlines depend on which two points you pick. A linear regression channel takes the choice away: it fits a line through every close in the window using statistics, then measures how far price usually wanders from it. This guide explains how the channel is calculated, what the slope, width and Pearson's R tell you, how to set it up on TradingView, the main ways to trade it and the trap of a channel that redraws itself. A calculator below fits the channel to your own prices.
Indicators that prove themselves in public.
One engine, four precision tools — the Gold (XAU) Scalper, the institutional Gravity Zone, the Zeno momentum Oscillator, and Zeno Stocks for equities.
What is a linear regression channel?
A linear regression channel is a trend tool made of three parallel straight lines. The middle one is the linear regression line: the straight line that fits a set of closing prices best, in the statistical sense of least squares. The upper and lower lines are drawn a fixed distance above and below it, usually two standard deviations of price around the line.
Unlike a hand-drawn trendline, which connects two or three chosen highs or lows, the regression line uses every close in the window. Two traders who pick the same start and end points get exactly the same channel. That objectivity is its main appeal.
The channel answers three questions at once: which way is the trend going (the midline's slope), how fast (the steepness of that slope), and how far price normally strays from it (the width of the bands). Variants include the Raff regression channel, developed by Gilbert Raff, which places the outer lines at the furthest high and low from the midline instead of using standard deviations, and standard error bands, which use a different statistical measure of spread.
How is a linear regression channel calculated?
For a window of N closing prices:
- Fit the line. Least squares finds the slope and intercept of the straight line that minimises the sum of squared vertical distances between each close and the line. Bar numbers (1, 2, 3 … N) are the x values; closes are the y values.
- Measure the spread. Calculate the standard deviation of the closes around that line, in other words of the residuals.
- Draw the bands. Upper band = regression line + k × standard deviation; lower band = regression line − k × standard deviation. With k = 2, roughly 95% of closes fall inside the channel if the deviations are close to normally distributed, which market data often is not.
Platforms differ in small details. Some measure the deviation of closes from the line, others from the mean of the closes, and some use highs and lows for the outer lines. The picture is similar, but exact band levels can differ between charting tools.
How do you read the slope, width and Pearson's R?
- Slope: the midline's rise or fall per bar. A steep slope means a strong trend; a slope near zero means a range, where the channel behaves more like a mean-reversion envelope.
- Width: wide bands mean price swings a lot around the trend; narrow bands mean an orderly trend. A channel that narrows while the slope stays steady is a clean, controlled move.
- Pearson's R: the correlation between time and price in the window, from −1 to +1. Values near +1 or −1 mean price has moved in a near-straight line; values near zero mean the "trend" is mostly noise. Many traders only trade channel pullbacks when the absolute value is above about 0.7 to 0.8.
Pearson's R and slope answer different questions. A shallow but very consistent trend can have a high R; a steep trend with violent swings can have a lower one. Use both.
Linear regression channel on TradingView
TradingView offers the channel two ways:
- The Linear Regression Channel indicator. Search "Linear Regression Channel" in the indicators menu. Its defaults are a length of 100 bars and 2 deviations for both bands, with options to turn either band off, extend the lines and show Pearson's R on the chart. It always fits the most recent bars, so the channel moves forward with every new candle.
- The Regression Trend drawing tool. Found with the trend-line tools, it lets you click a start and end point and fits the channel between them, with the deviations shown. Use it to study a specific swing or leg.
Common settings by timeframe:
| Style | Timeframe | Length | Deviations |
|---|---|---|---|
| Scalping | 1 to 5 minutes | 50 to 100 | 2 |
| Day trading | 15 minutes to 1 hour | 100 | 2 |
| Swing trading | 4 hours to daily | 100 to 200 | 2 to 2.5 |
| Position trading | Weekly | 52 to 104 | 2 |
Pine Script has a built-in function, ta.linreg(source, length, offset), that returns the regression line's value, which is useful for building your own channel or a linear regression curve.
Linear regression channel calculator
Paste a series of closing prices, oldest first, and choose how many standard deviations the bands should sit from the midline. The calculator fits the least-squares line, then reports the slope, the midline and band levels at the last bar, Pearson's R and where the last close sits inside the channel. The default data is illustrative.
How do you trade a linear regression channel?
Three common approaches:
- Trend pullbacks. In a rising channel with a strong Pearson's R, buy pullbacks to the midline or lower band and target the upper band; reverse it for falling channels. Only trade in the direction of the slope.
- Mean reversion in flat channels. When the slope is close to zero, fade moves to the outer bands back toward the midline, as with Bollinger Bands. This works in ranges and fails badly in breakouts, so use tight stops.
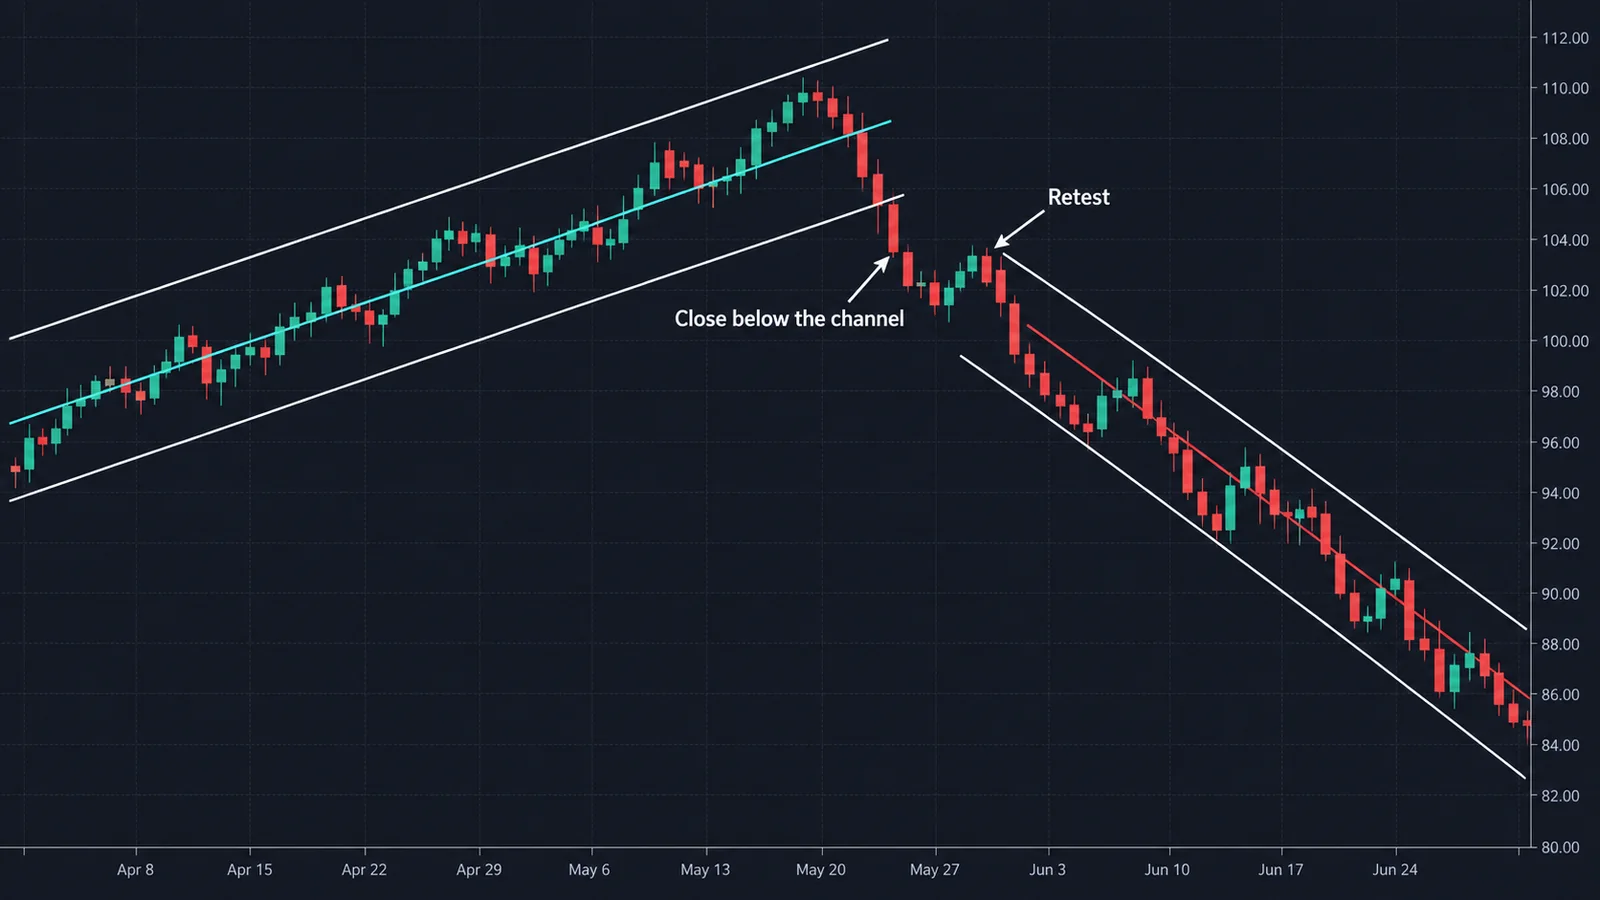
- Channel breaks. A close outside the channel against the trend, for example below the lower band of a rising channel, warns that the trend may be ending. Traders often wait for a retest of the broken band or a new channel in the other direction before acting.
Stops usually go beyond the outer band or beyond the last swing point. An ATR-based buffer keeps normal noise from triggering them.
Why does the linear regression channel repaint?
The channel is a fit to the last N bars. Each new bar adds a close and drops the oldest one, so the whole line and its bands are recalculated. Past channels shift, and the version you see on a historical chart is not the version you would have seen at the time.
That has practical consequences:
- Old touches of the bands look cleaner in hindsight than they were in real time.
- Backtests that use the current channel on past bars overstate results.
- A band touch that triggers your entry can move away from price on the next bar.
To work around it, judge the channel only at the latest bar, use the drawing tool to freeze a channel on a completed leg, or use a non-repainting relative such as a linear regression curve (the endpoint of the regression line plotted bar by bar). Read more about testing strategies honestly.

Automate your trades. Let Quantum Algo trade for you.
Every signal executed on your own account — on your account, with the plan you define.
Linear regression channel vs other channels
| Channel | Midline | Band width | Behaviour |
|---|---|---|---|
| Linear regression channel | Straight least-squares line | Standard deviations of the residuals | Straight, refitted every bar |
| Bollinger Bands | 20-period SMA | 2 standard deviations of price | Curved, follows price |
| Keltner Channels | 20-period EMA | ATR multiple | Curved, smoother bands |
| Donchian Channels | None (optional middle) | Highest high and lowest low | Steps up and down |
| Andrews' Pitchfork | Median line from three pivots | Parallel lines through the pivots | Hand-drawn, angled |
Keltner Channels and Bollinger Bands follow price closely; Donchian Channels track breakouts; the Andrews' Pitchfork projects a channel from three chosen pivots. The regression channel is the only one that fits a single straight trend statistically.
Linear regression channels and Quantum Algo
A regression channel tells you the trend's angle and its normal range. It does not tell you where liquidity sits, whether structure has shifted or where to place a precise stop.
The free Quantum Algo indicators mark structure, liquidity sweeps and trendlines on TradingView, which pair well with a channel's bands. Zeno, the premium engine from Quantum Algo (QuantumAlgo), prints signals with an entry, a stop and two targets on stocks, indices, gold, forex and crypto, and every call is on the public track record.
A linear regression channel fits a least-squares line through recent closes and draws bands a set number of standard deviations above and below it, two by default. The slope shows trend direction and strength, the width shows normal variation and Pearson's R shows how clean the trend is. Trade pullbacks in the trend's direction, treat closes outside the channel as warnings, and remember that the channel is refitted on every bar.
◆ Interactive check
How well do you know the linear regression channel?
Questions traders ask about the linear regression channel
A trend channel made of a least-squares line through recent closes and two parallel bands a set number of standard deviations above and below it.
TradingView's defaults of 100 bars and 2 standard deviations suit most day and swing trading. Shorter lengths react faster but are noisier; 2 to 2.5 deviations is the usual band width.
Yes, in the sense that the whole channel is recalculated as each new bar enters the window, so historical channels shift. Judge it at the latest bar and be careful with backtests.
The correlation between time and price in the window, from −1 to +1. Values near ±1 mean a clean, straight trend; values near zero mean the trend is weak or noisy.
Buy pullbacks to the midline or lower band in rising channels and sell rallies to the midline or upper band in falling channels, with stops beyond the outer band. Treat closes outside the channel as warnings.
A regression channel uses a straight best-fit line and bands around it; Bollinger Bands use a 20-period moving average that curves with price and bands based on price's standard deviation.
A version developed by Gilbert Raff that draws the outer lines through the furthest high and low from the regression line, instead of using standard deviations.
Yes. There is a built-in Linear Regression Channel indicator and a Regression Trend drawing tool. Pine Script also has the ta.linreg function.
References & Related Guides
Read next
- Bollinger Bands
- Keltner Channels
- Donchian Channels
- Andrews' Pitchfork
- Trendline Trading
- Gaussian Channel
- Mean Reversion Trading
- ATR
- Support and Resistance
- Backtesting a Strategy
- Free TradingView indicators
- Zeno — the premium engine