Shrinkage Estimator
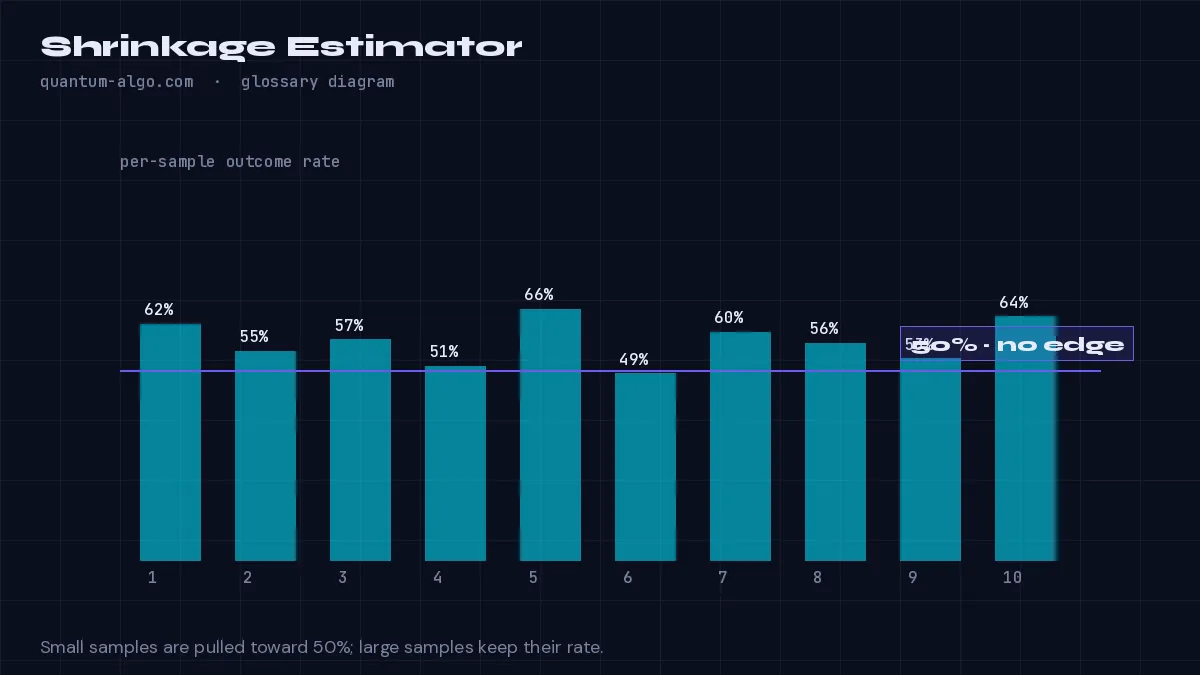
Shrinkage is pulling an estimate toward a neutral prior in proportion to how little data supports it — for a win rate, adding pseudo-samples at 50% — so that a three-for-three streak reads as slightly better than a coin flip rather than as 100%.
What it means
A shrinkage estimator blends the observed rate with a prior. For win rates the simplest form adds k pseudo-samples at 50%: shrunk rate = (wins + 0.5k) / (samples + k). With k = 10, three wins of three become 8/13 ≈ 62% instead of 100%; with 300 samples the prior barely matters. The estimate is biased toward the prior on purpose, because the alternative is being wildly wrong on small samples.
Shrinkage and the Wilson bound solve related problems: shrinkage moves the point estimate, the bound describes the uncertainty around it. Used together — as in the per-symbol statistics of Quantum Algo scripts — they make it impossible for a tool to display a flattering number that its data cannot support.
The idea is general: shrinking sector returns toward the market, shrinking a player's early-season average toward the league — any time a small sample would otherwise produce an extreme, shrinkage is the correction.
How to identify it on a chart
- Choose a prior (50% for a win rate) and a strength k (pseudo-samples).
- Compute (wins + prior × k) / (samples + k).
- Report the shrunk rate; note that as samples grow it converges to the raw rate.
Worked example
A divergence family has 4 wins of 5 on a new chart. Raw: 80%. Shrunk with k = 10: (4 + 5) / (5 + 10) = 60%. The dashboard shows 60% with "n = 5", and the number rises only as the family proves itself.
See it on the chart, read it in depth
Frequently asked questions
Is shrinkage cheating?
It is the opposite: it prevents the tool from claiming an edge the data does not support. The raw rate is the misleading one at small n.
What k should I use?
Between 8 and 20 pseudo-samples for trading statistics; larger k is more conservative.
Does shrinkage go away with more data?
Yes — at hundreds of samples the prior contributes almost nothing.
Which scripts use it?
Every Quantum Algo tool that reports per-symbol win rates, including the Event Probability Engine, which combines it with overlap correction and Wilson bounds.
Related terms
See Shrinkage Estimator on your TradingView chart
Zeno reads Smart Money structure across timeframes and prints the entry, stop and targets — with a public record of every posted trade. The free indicators draw the concepts this page defines.