Best VWAP Settings for Intraday Trading: Why the 3 Lines and Bands Matter
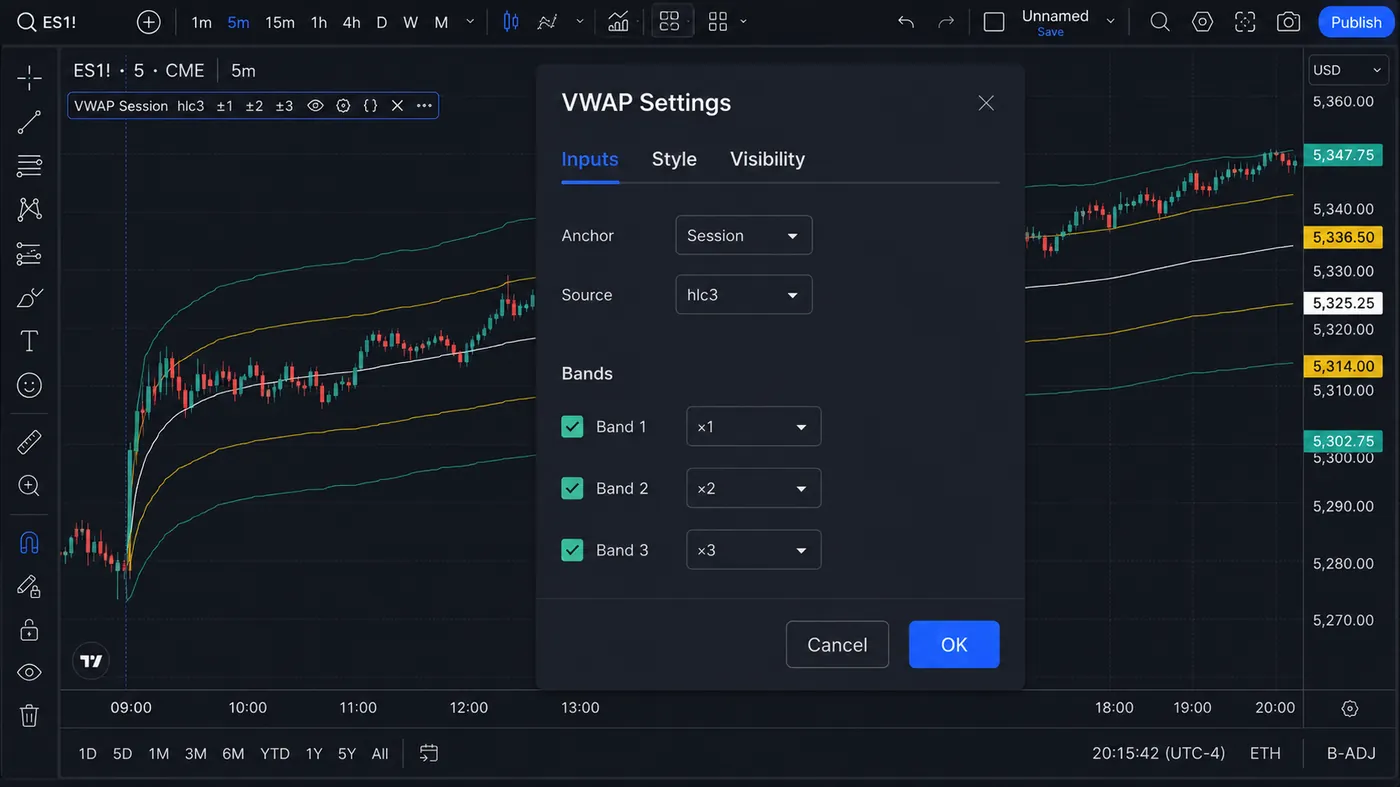
For most intraday charts the best VWAP setting is TradingView's built-in VWAP with Session as the anchor, hlc3 as the source and standard-deviation bands at 1, 2 and 3. The three lines are the volume-weighted average price plus symmetric ±1σ and ±2σ bands, context zones for stretch, not support and resistance rules. Change the anchor before anything else.
The most common VWAP question I get is “why are there three lines and which one do I trade?” — and the second is “what settings should I use?” Both have the same answer: the anchor decides what the line means, the bands describe how far price has stretched from it, and the setting you keep is the one that matches the setup you actually trade. This guide gives the presets by use case, explains the maths behind the bands, and shows how I combine VWAP context with the structure that Quantum Algo’s free indicators mark on the chart. Zeno remains the separate signal layer with SL/TP and built-in risk management.
Indicators that prove themselves in public.
One engine, four precision tools — the Gold (XAU) Scalper, the institutional Gravity Zone, the Zeno momentum Oscillator, and Zeno Stocks for equities.
What does VWAP actually measure?
VWAP is the cumulative average price weighted by volume. TradingView describes the calculation as:
- Calculate typical price:
(high + low + close) / 3. - Multiply typical price by volume.
- Accumulate price × volume.
- Accumulate volume.
- Divide cumulative price × volume by cumulative volume.
The result estimates the average traded price for the selected anchor period. Price above VWAP suggests buyers have traded at higher prices than the period’s volume-weighted average; price below VWAP suggests the opposite. VWAP is descriptive and lagging, not a predictive guarantee.
Why is the anchor the first VWAP setting?
The anchor determines when the cumulative sums reset. Session VWAP resets at the start of each regular session and is the most common intraday choice. Week and month anchors answer a different question: where is price relative to the average transaction price over a larger calendar period? Anchored VWAP starts from a user-selected event such as a swing low, earnings gap, breakout, or news candle.
Do not compare a session VWAP and an anchored VWAP as if they were competing indicators. They represent different populations of trades. A day trader might use session VWAP for execution and a weekly anchored VWAP for higher-timeframe context.
Why does VWAP have three lines?
The central VWAP is the weighted mean. If standard-deviation bands are enabled, the platform measures dispersion of the VWAP-related values since the anchor and plots upper/lower distances. TradingView allows up to three band multipliers. A common display is 1, 2, and 3 standard deviations:
Upper band n = VWAP + multiplier n × standard deviation
Lower band n = VWAP − multiplier n × standard deviation
The bands are not support and resistance laws. They are context zones. A strong trend can walk the upper band, while a range can repeatedly reject the outer bands. Use price action and regime context to decide whether a touch is continuation, exhaustion, or noise.
Which VWAP settings should you start with?
| Use case | Anchor | Source | Bands | Interpretation |
|---|---|---|---|---|
| General day trading | Session | hlc3 | 1, 2, 3 SD | Trend bias plus stretch zones |
| Fast execution | Session | hlc3 | 1, 2 SD | Less visual clutter |
| Opening-range plan | Session | hlc3 | 1, 2 SD | Wait for opening structure first |
| Event analysis | Anchored at event | hlc3 | 1, 2, 3 SD | Average price since event |
| Swing context | Week or Month | hlc3 | optional | Broader acceptance level |
These are transparent baselines, not a promise that every instrument respects them.
Which source should VWAP use: hlc3, hl2 or close?
TradingView’s default source is typically hlc3, the typical price. hl2 uses the bar midpoint, while close emphasizes the final traded price. The difference can be small on liquid markets but meaningful during wide candles or gaps. Use one source consistently when testing. If you switch from hlc3 to close after seeing a better chart, you are changing the model, not “fine-tuning” the display.
How do you read price relative to VWAP?
Trend context
Above a rising VWAP, pullbacks that hold the line can support a continuation thesis. Below a falling VWAP, rallies that fail near the line can support a short thesis. The key is the slope and the reaction, not merely the side of the line.
Mean-reversion context
In a balanced range, price may rotate from an outer band toward VWAP. A mean-reversion rule should specify how to identify balance, what confirms rejection, where the stop belongs, and when the setup is invalidated by a trend expansion.
Band walks
When price rides the upper or lower band while VWAP slopes strongly, fading the band can be dangerous. Treat a band walk as evidence of persistent directional pressure until price closes back inside the band and structure changes.
How do the 1σ, 2σ and 3σ bands differ?
The 1-SD band is a nearby deviation area and often interacts with normal pullbacks. The 2-SD band is more extended and may attract profit-taking or continuation in strong trends. The 3-SD band is an extreme reference that can remain untouched for days or be reached quickly during a shock. Plotting all three can help readers describe location, but displaying all three does not create three independent signals.
Use opacity and color hierarchy: the central VWAP should be visually dominant, the 1-SD band moderately visible, and the outer bands lighter. Overly bright bands encourage traders to treat every touch as an alert.
Example: a VWAP reclaim-and-retest long
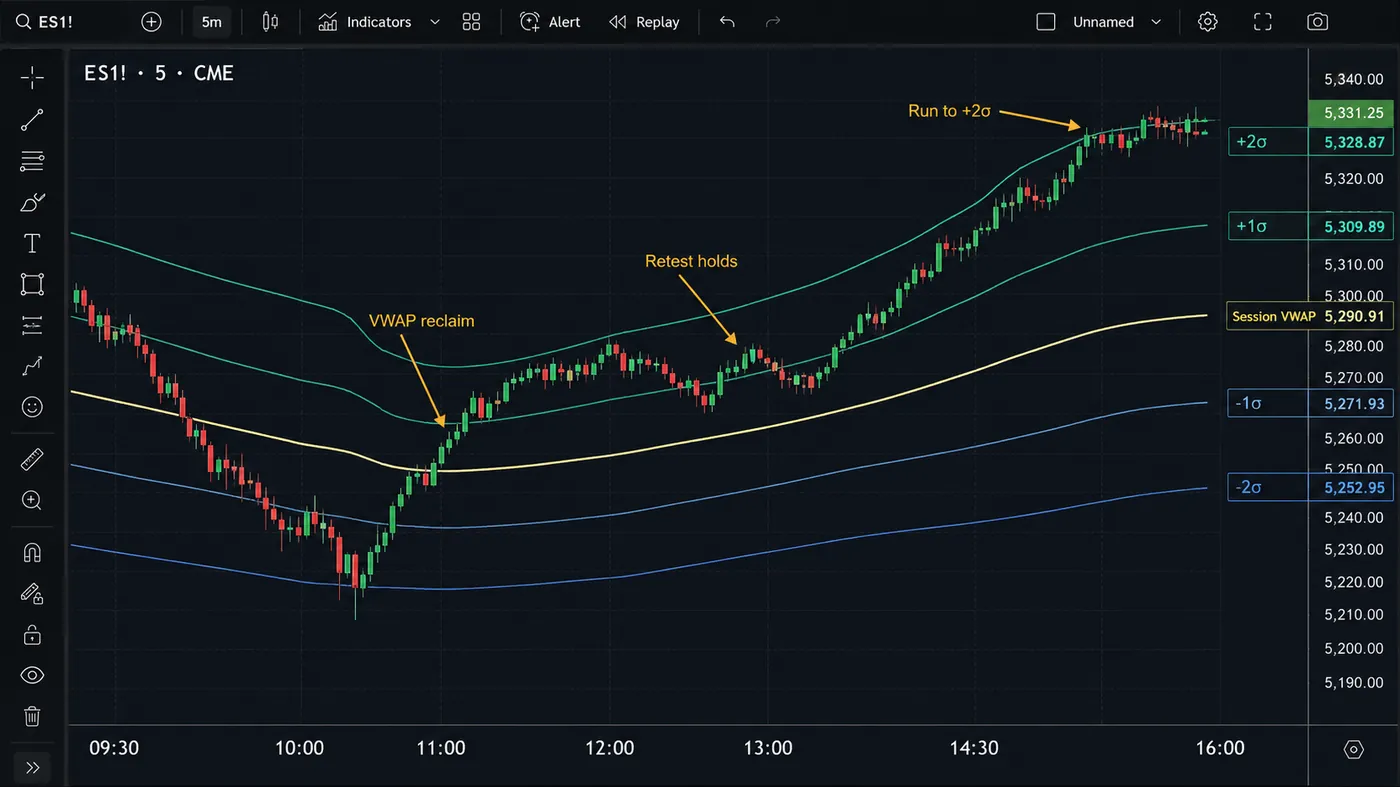
Price opens below session VWAP, reclaims the line after an opening-range break, and then holds VWAP on a retest. The VWAP slope turns upward and the 1-SD upper band expands. A rules-based trader could enter after the retest bar closes, place the stop under the retest low, and use the next band or a prior high as a target. If price falls back below VWAP and the retest fails, the setup is invalid.
Example: a 2σ mean-reversion plan
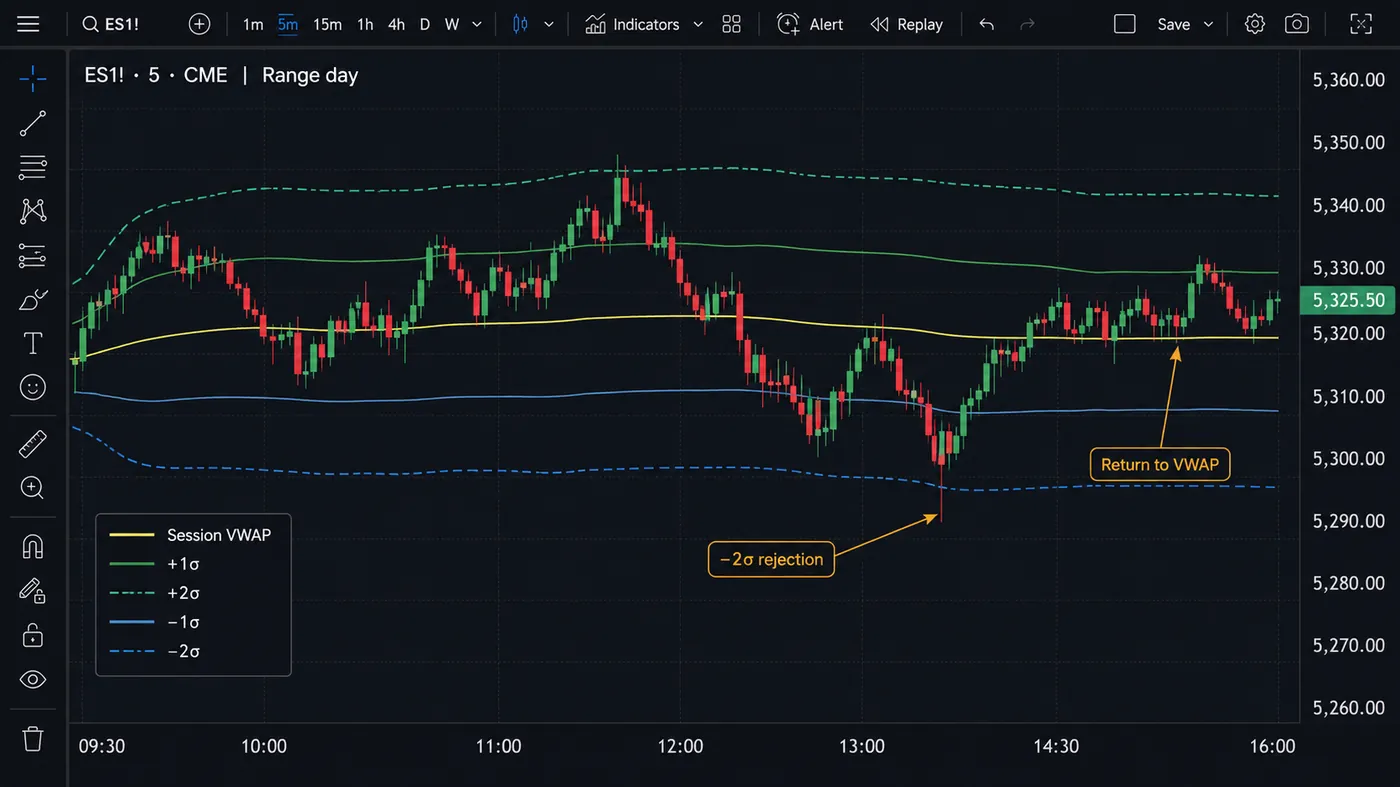
During a confirmed range, price reaches the upper 2-SD band, prints rejection, and closes back inside the band. A mean-reversion trader may target the 1-SD band or VWAP, but only if the expected reward remains larger than spread, fees, and slippage. If the market breaks the range with expanding volume, the mean-reversion premise is cancelled.
Why is VWAP not a stop-loss system?
VWAP can help define context, but it does not know your entry, account size, or risk tolerance. Place stops at a price level that invalidates the setup. A stop exactly one tick beyond VWAP is often vulnerable to normal noise. Position size should be calculated from the stop distance, not from the apparent confidence of the VWAP interaction.
VWAP versus moving averages: what is the difference?
An EMA weights recent price by time; VWAP weights price by volume since an anchor. VWAP can remain near a high-volume acceptance area even when an EMA moves quickly. Neither is inherently superior. Use VWAP when the average transaction price over an anchor matters; use moving averages when time-based smoothing is the intended model.
What does a complete intraday VWAP playbook look like?
Start before the session by marking the prior session high, low, close, and any event anchor you plan to use. Add session VWAP with the central line visible and choose whether the bands are needed for the day’s setup. During the opening phase, classify the market as acceptance above VWAP, acceptance below VWAP, or two-sided rotation. Do not call a one-candle spike “acceptance”; require repeated closes or a retest that holds.
If price remains above a rising VWAP and pullbacks hold the line, continuation setups have a logical context. If price repeatedly crosses VWAP with a flat slope, trend signals are lower quality and a range framework may be more appropriate. If price reaches an outer band while the slope is steep and volume expands, avoid automatically fading it. Wait for evidence that the auction is losing momentum, such as a close back inside the band and a break of the immediate swing.
At the end of the session, save a screenshot and record where the day accepted value. This creates a useful dataset for deciding whether 1-SD, 2-SD, or 3-SD interactions are relevant for your instrument. A single chart is an illustration; a distribution of days is evidence.
When should you use anchored VWAP instead?
Anchored VWAP is valuable when the question is “what is the average traded price since this event?” Anchor it to a major gap, earnings release, breakout, swing low, or swing high. The anchor should be defined objectively, not moved until the line fits the chart. If multiple anchors are drawn, label each one and explain why it exists.
An event-anchored VWAP can act as a context line for a multi-day trade, while session VWAP manages the day’s execution. The two can converge, diverge, or cross. Confluence is only useful when the underlying questions are different: one line describes event participants and the other describes today’s participants.
Standard-deviation or percentage bands?
TradingView can calculate bands using percentage distance or standard deviation. Percentage bands are easy to communicate: a 1% upper band is VWAP × 1.01. Standard-deviation bands adapt to observed dispersion. If the session is quiet, the bands contract; if the session is volatile, they expand. That adaptive behavior is useful, but it means a band’s price distance cannot be compared casually from one day to another.
When writing a backtest, store the band mode and multipliers as part of the strategy specification. “VWAP bands” is incomplete without saying whether the test used 1%/2%/3% or 1/2/3 standard deviations, and whether the standard deviation was calculated on typical price, VWAP values, or the platform’s built-in series.
Which VWAP mistakes cost the most?
- Resetting at the wrong time: a shifted session changes every value.
- Calling every band a support level: bands describe dispersion, not a guaranteed reversal.
- Using outer-band fades in a trend: band walks can persist.
- Changing source after the fact: hlc3, hl2, and close are not interchangeable.
- Ignoring volume type: tick volume is not centralized traded volume.
- Overloading the chart: three bands plus several moving averages can hide price structure.
- Using a daily chart with a session anchor: the line may reset once per bar and add little information.
Anchor first, source second, bands last. Session + hlc3 + ±1σ/±2σ is the transparent intraday baseline; the three lines are one indicator, not three. Trade the reclaim and the retest, respect band walks, put the stop at the price that invalidates the idea, and record the anchor and band mode with every test so the result is reproducible.
◆ Interactive check
Do you know what the three VWAP lines mean?
Questions traders ask about VWAP settings
It is the most transparent starting point because it resets with the trading session, but the best anchor depends on the market and strategy.
They provide a visual hierarchy of normal, extended, and extreme distance. Three bands are optional; they are not three independent indicators.
Standard deviation adapts to dispersion; percentage bands use fixed distance. Test both, but label the mode clearly because a 1% band is not the same as a 1-SD band.
No. It identifies an average price and context. Reversal entries need structure, confirmation, and risk controls.
Anchor: Session; source: hlc3; bands: standard deviation ×1 and ×2 (add ×3 for mean-reversion work). Keep the central line visually dominant and the bands lighter, and confirm the session boundaries match the exchange you trade.
Because the bands option is on. The middle line is VWAP itself; the two outer lines are ±1 standard deviation (or ±1%) from it. Each extra band pair adds another multiplier, which is why some charts show five or seven lines.
VWAP is anchor-based, not timeframe-based: a session VWAP shows the same value on 1m and 15m charts. Use the timeframe that matches your holding time — 1–5 minutes for scalps, 15 minutes for day trades — and keep the anchor consistent.
Yes, but forex feeds provide tick volume, not centralised traded volume. VWAP and its bands then describe dispersion around a tick-weighted average, which is still useful context but not institutional acceptance in the way it is on futures or stocks.
No. Each bar’s VWAP value is computed from completed data since the anchor. What can change is the current bar’s value until it closes, so use bar-close confirmation for alerts.
Quantum Algo’s free public indicators mark order blocks, fair value gaps and liquidity; a VWAP reclaim that lands on one of those levels is a higher-quality context. Zeno then supplies confirmed Buy/Sell signals with SL/TP and built-in risk management; it does not use VWAP as an input.
References & Related Guides
Read next
- VWAP: The Complete Guide
- VWAP Intraday Trading Strategy: 3 Setups
- Does VWAP Actually Work?
- Is VWAP a Lagging Indicator?
- Can You Use VWAP on a Daily Chart?
- What Is ORB (Opening Range Breakout)?
- Volume Profile Trading Guide
Authoritative sources
- TradingView: Volume Weighted Average Price (VWAP)
- TradingView: Anchored VWAP
- CME Group: order types and execution basics
- Investopedia: VWAP definition and formula
- NSE: market timings (session boundaries)