Schaff Trend Cycle (STC): The MACD Run Through a Stochastic Twice
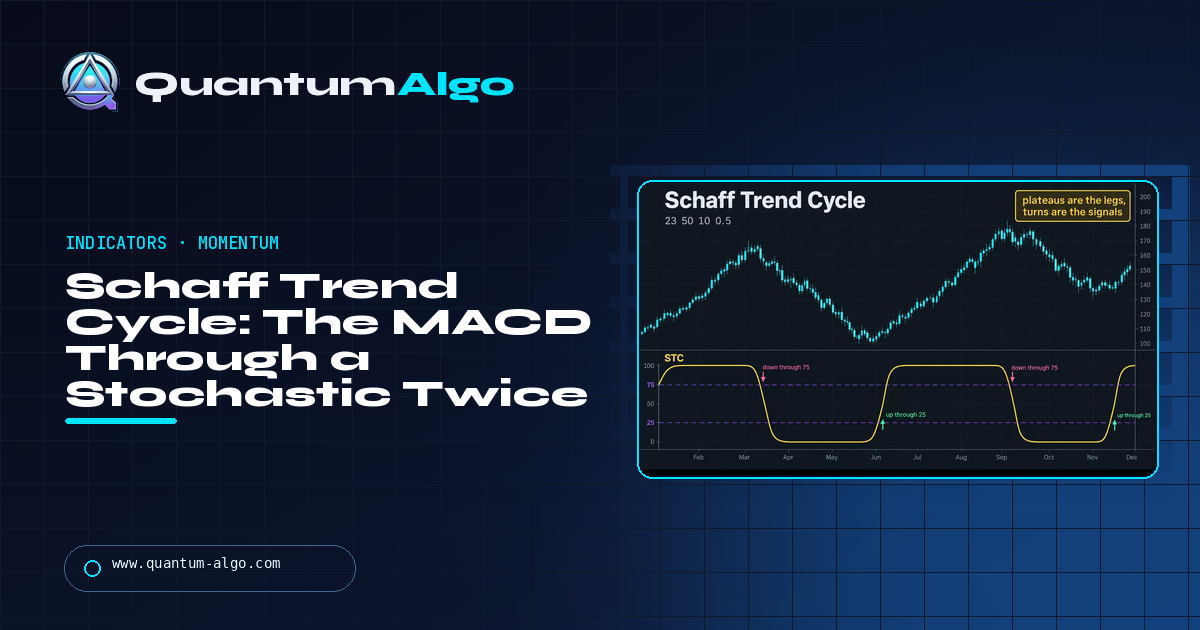
The Schaff Trend Cycle (STC) is a MACD (EMA 23 − EMA 50) passed through a 10-period stochastic, smoothed by half, then through a second 10-period stochastic and smoothed again. It runs from 0 to 100, sits on a plateau at the extremes during trend legs and turns quickly at the swings. The signals are the turns: up through 25 is the buy, down through 75 the sell. It is faster than MACD because the stochastic stages amplify changes in momentum's slope, and it turns falsely in ranges for the same reason — so it needs a trend filter and a level, and it gives up divergence entirely.
STC is the indicator that looks like it is cheating: flat at 100 through the whole leg, then a clean turn a few bars after the top. It is not cheating, it is a stochastic of a stochastic of a MACD, and the same machinery that makes the turns clean makes them constant in a range. This page is the chain, the defaults and what changes them, the plateau-and-turn reading, the trade with a trend filter and a level, a NAS100 morning with two turns taken and one skipped, and the comparison with MACD, TSI and Stochastic RSI. The calculator runs the full chain on pasted closes.
Indicators that prove themselves in public.
One engine, four precision tools — the Gold (XAU) Scalper, the institutional Gravity Zone, the Zeno momentum Oscillator, and Zeno Stocks for equities.



What the Schaff Trend Cycle is
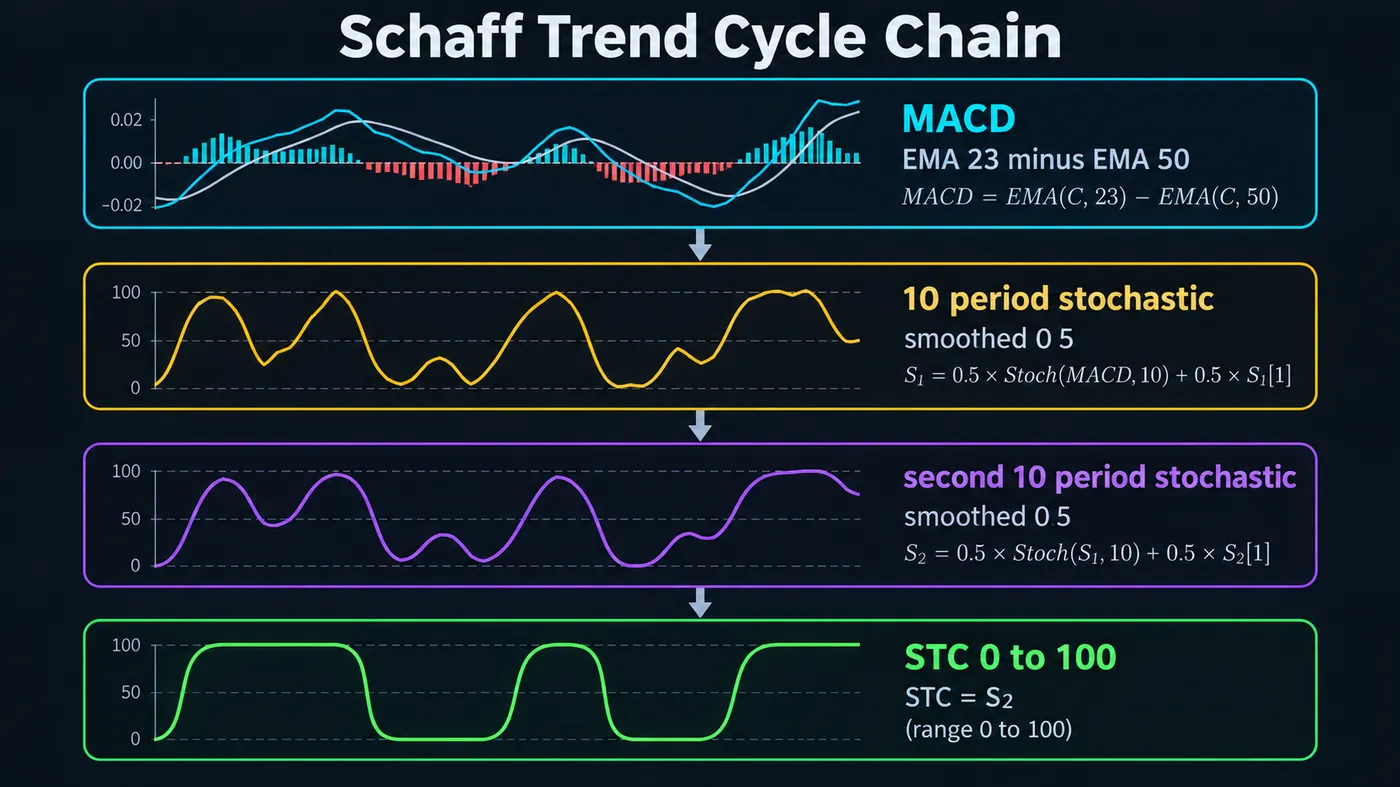
The Schaff Trend Cycle is a MACD run through a stochastic twice. Doug Schaff's idea, from the late 1990s, was that trends contain cycles — accelerations and pauses of roughly repeating length — and that a stochastic applied to momentum rather than to price would find those cycles and turn faster than the MACD itself. Take the MACD line (EMA 23 minus EMA 50), compute a 10-period stochastic of it and smooth the result by half; then compute a 10-period stochastic of that and smooth again. The output runs from 0 to 100, flattens at the extremes during trends, and turns quickly at the swings.
The behaviour is distinctive: STC does not oscillate smoothly like RSI. It sits at 0 or 100 for stretches and then moves through the middle in a few bars. That is the double stochastic doing its job — the cycle in the MACD is being amplified, and the flat stretches are the trend legs. The signals are the turns: STC leaving 25 on the way up is the buy, leaving 75 on the way down is the sell.
What it is not: a leading indicator, whatever the marketing says. STC is faster than MACD because the stochastic stages exaggerate small changes in the MACD's slope, and that same amplification is why it turns falsely in ranges. It also carries no volume and no notion of a level; it says when momentum's cycle has turned, not where price should stop.
The formula
| Step | Formula | Default |
|---|---|---|
| 1. MACD | EMA(close, fast) − EMA(close, slow) | fast 23, slow 50 |
| 2. First stochastic | (MACD − lowest MACD over n) ÷ (highest − lowest) × 100 | n = 10 |
| 3. First smoothing | prior + factor × (step 2 − prior) | factor 0.5 |
| 4. Second stochastic | The same formula applied to step 3 over n | n = 10 |
| 5. Second smoothing → STC | prior + factor × (step 4 − prior) | 0.5 |
| Levels | 25 (turn up = buy) and 75 (turn down = sell) | convention |
The 0.5 smoothing factor is a half-speed EMA applied at each stage, and it is why STC is usable: an unsmoothed double stochastic of the MACD is a square wave. The 23/50 EMA pair is slower than MACD's 12/26 by design — Schaff wanted the underlying momentum slow so that the stochastic stages, not the MACD, supplied the speed.
| Use | Fast | Slow | Cycle | Factor | Note |
|---|---|---|---|---|---|
| Default (Schaff) | 23 | 50 | 10 | 0.5 | Daily and 4H; TradingView's defaults |
| Swing | 23 | 50 | 10 | 0.5 | Keep it |
| Intraday 15M | 23 | 50 | 10 | 0.5 | Same — the cycle length is in bars, so it adapts; add a session filter |
| Slower, fewer turns | 30 | 65 | 14 | 0.5 | For regime rather than timing |
| Crypto 4H | 23 | 50 | 12 | 0.4 | Slightly more smoothing for 24-hour noise |
How to read it
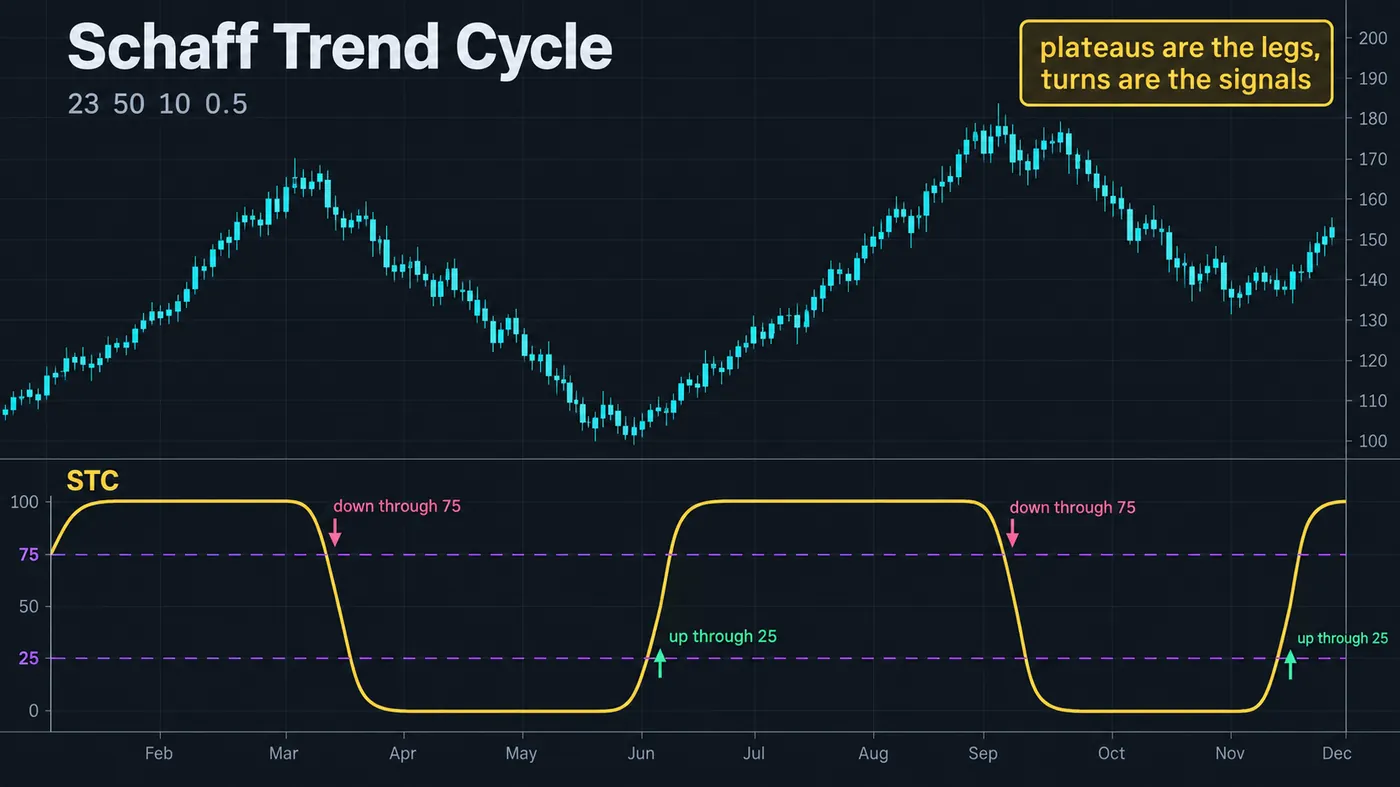
The plateaus. STC at 100 is an uptrend leg; at 0, a downtrend leg. It can stay there for twenty bars, and the level says nothing about how much further the leg has to run. Do not sell 100 or buy 0.
The turns. STC rising through 25 after a low plateau is Schaff's buy; falling through 75 after a high plateau is the sell. These come a few bars after the price swing — faster than a MACD cross, slower than the swing itself.
The transit. Between 25 and 75 STC is moving and the last signal is in force. A turn that starts and reverses before reaching the far level is a failed cycle, which in a trend means a shallow pullback and in a range means noise.
What it lacks. Divergence on STC is unreliable because the double stochastic destroys the amplitude information — a lower STC high against a higher price high just means the MACD's rate of change was lower, which it usually is late in a trend. Read divergence on the TSI or MACD instead and use STC for the turn.

Automate your trades. Let Quantum Algo trade for you.
Every signal executed on your own account — on your account, with the plan you define.
How to trade it
- Set the trend elsewhere. A 200 EMA, higher-timeframe structure, or the daily candle. STC turns up in downtrends constantly; those are bounces, and taking them is where the indicator loses money.
- Wait for the plateau, then the turn. In an uptrend, STC drops to the low plateau on a pullback and turns up through 25. In a downtrend, the mirror through 75.
- Require a level. The turn should coincide with price at an order block, a fair value gap, VWAP or the last swing. STC has no level of its own.
- Enter on the close that takes STC through 25 (or 75). Stop under the level, not under an STC reading.
- Hold through the plateau. STC at 100 is not an exit. The exit is the turn down through 75, or a structure break — whichever comes first.
- Skip failed cycles. A turn that stalls at 40 and rolls back is a pullback continuing; wait for the next full turn.
STC calculator
Paste closing prices and the tool runs the whole chain — the 23/50 MACD, the first stochastic and its smoothing, the second stochastic and its smoothing — and reports STC, whether it turned through 25 or 75 on the last bar, and the plateau state. The preloaded sample is an uptrend, a downtrend and the start of the next up-cycle.
STC versus MACD, TSI and the stochastic
| Indicator | Built from | Range | Turns | Where STC differs |
|---|---|---|---|---|
| STC | Double stochastic of a 23/50 MACD | 0–100 with plateaus | Fast, few | — |
| MACD | EMA 12 − EMA 26, signal 9 | Unbounded | Slower | STC is the MACD's cycle, extracted and sharpened; it turns earlier and plateaus instead of trending |
| TSI | Double EMA of momentum, normalised | ±100 | Medium | TSI keeps amplitude (divergence works); STC discards it (turns are cleaner) |
| Stochastic | Close position in the price range | 0–100 | Fast, many | The stochastic is applied to price; STC applies it to momentum, which is why it plateaus rather than pinning |
| Stochastic RSI | RSI position in its range | 0–100 | Very fast, many | Same family — an oscillator of an oscillator — but StochRSI is single-stage and unsmoothed by default; STC is double-stage and smoothed |
STC and Stochastic RSI are cousins: both put a stochastic on top of another indicator. STC's second stage and its smoothing are why it produces a handful of clean turns where StochRSI produces dozens of crossings. The price is that STC gives up divergence entirely.
Reference data
| Item | Value |
|---|---|
| Origin | Doug Schaff, late 1990s; popularised via FX-Strategy and later publications |
| Formula | Stochastic(smoothed Stochastic(MACD 23/50, 10), 10), each stage smoothed by 0.5 |
| Range | 0–100; plateaus at the extremes during trend legs |
| Signals | Turn up through 25 (buy), turn down through 75 (sell) |
| Not a signal | The level itself; STC at 100 is a trend leg, not overbought |
| Weakness | False turns in ranges; no amplitude, so divergence is unreliable; no level, no volume |
| Pair with | A trend filter (200 EMA, structure) and a level (order block, FVG, swing) |
| TradingView | Built-in "Schaff Trend Cycle" (23, 50, 10, 0.5) |
Worked example: NAS100 15-minute, two turns and one skipped
NAS100 CFD, 15-minute chart, a New York morning, STC at defaults. The daily and 1-hour structure were up; the 200 EMA on the 15-minute sat well below price. At 09:45 STC was on the high plateau at 99 after the opening drive. Price pulled back from 18,712 to 18,641 over five candles and STC dropped to 3 — the low plateau — with price sitting on the 15-minute fair value gap left by the 09:35 candle, 18,630–18,652. At 10:15 the candle closed at 18,663 and STC printed 31, through 25. Long at 18,663, stop under the gap at 18,622, 41 of risk. Target the opening high at 18,712 and beyond it the overnight high at 18,748.
STC reached the high plateau at 10:45 with price at 18,724; the opening high had been taken. It sat at 97–100 for six candles while price ground to 18,751 — the plateau is the leg, and selling 100 at 18,724 would have cost the last 27 points. The turn down through 75 came at 12:15 with the close at 18,733. Out for 70 points on 41 of risk, 1.7R. The overnight high had been touched at 11:45; a target-based exit would have taken 85 points.
The turn skipped: at 13:30, in the lunch chop, STC turned up through 25 with price at 18,690 — mid-range, no gap, no swing, ten points above VWAP. No level, no trade. Price went to 18,705 and back to 18,672 within an hour. Same indicator, same signal; the difference was the fair value gap under the first one.
Where the Schaff Trend Cycle fails
Ranges. The double stochastic amplifies every wiggle in the MACD. In a range STC turns through 25 and 75 every few bars, and each turn looks identical to the real ones. The trend filter and the level are not optional.
Divergence. Unreliable by construction; the stochastic stages remove amplitude. Use TSI or MACD for divergence.
Late in a trend. STC cannot tell the first turn up in a new uptrend from the sixth. By the sixth, the pullbacks are shallower and the plateau shorter; read structure for where you are in the move.
Fast reversals. STC needs the MACD to change slope before the stochastic stages can react. A V-reversal leaves STC on the wrong plateau for several bars.
Parameter fitting. The 23/50/10/0.5 set is the indicator. A backtest that prefers 17/38/7 on one symbol has found noise.
Mistakes traders make with STC
- Selling 100 and buying 0. The plateaus are trend legs; the turns are the signals.
- Taking turns against the higher-timeframe trend. In a downtrend, an STC buy is a bounce.
- Trading turns without a level. A turn at nothing is a coin flip.
- Reading STC divergence. The formula discards amplitude; there is no divergence to read.
- Exiting when STC reaches the plateau. Exit on the turn down through 75 or on structure.
- Changing the parameters to reduce false turns. The filter is structure, not settings.
STC and the free indicators
TradingView's built-in Schaff Trend Cycle is exact. The library supplies the two things STC lacks: the Fair Value Gaps + Inversion and Order Blocks with Volume scripts give the level a turn should land on, and the Adaptive Trend Sentinel gives the regime that decides which turns to take. The MACD Matrix shows the underlying momentum across four timeframes. The premium engine, Zeno, prints buy and sell signals with a stop and targets; a Zeno buy signal at a fair value gap as STC turns up through 25 is the first trade in the example above.
A momentum cycle detector with a fast turn and no memory of amplitude. Read the plateaus as legs and the turns through 25 and 75 as signals, take them only with the higher-timeframe trend and at a level, hold through the plateau, and exit on the turn back or on structure. Keep 23/50/10/0.5, read divergence on TSI or MACD instead, and skip any turn that happens at nothing.
◆ Interactive check
Do you know what STC extracts?
Questions traders ask about the Schaff Trend Cycle
An oscillator by Doug Schaff that takes a MACD (EMA 23 minus EMA 50), runs a 10-period stochastic over it, smooths the result by half, then runs a second 10-period stochastic and smooths again. It moves from 0 to 100, plateaus at the extremes during trend legs and turns quickly at swings.
MACD = EMA(close, 23) − EMA(close, 50). First stage: stochastic of the MACD over 10 bars, then each value = prior + 0.5 × (new − prior). Second stage: the same stochastic and smoothing applied to the first stage. The result is the STC.
Schaff's defaults — fast 23, slow 50, cycle 10, factor 0.5 — on any timeframe, because the cycle length is in bars and adapts. For a slower regime read use 30/65/14. On 4-hour crypto a factor of 0.4 adds a little smoothing. Fitting the numbers to reduce false turns finds noise; the fix for false turns is a trend filter and a level.
Set the trend with a 200 EMA or higher-timeframe structure. In an uptrend, wait for STC to fall to the low plateau on a pullback and turn up through 25 while price sits at a level — an order block, fair value gap, VWAP or swing. Enter on that close, stop under the level, hold through the high plateau, and exit on the turn down through 75 or a structure break.
No. It turns earlier than a MACD cross because the stochastic stages amplify changes in the MACD's slope, but it still needs the MACD to bend first, which happens after the price swing. It is a fast lagging indicator.
STC is the MACD's cycle extracted by two stochastic stages. MACD trends and diverges; STC plateaus and turns. STC gives earlier, cleaner turns and more false ones in ranges; MACD keeps the amplitude that makes divergence readable. They are two views of the same momentum.
Poorly. The double stochastic amplifies every wiggle, so STC turns through 25 and 75 every few bars. Only the turns that coincide with a level and agree with the higher-timeframe trend are worth taking, and in a genuine range few do.
On 15-minute to daily BTCUSDT and ETHUSDT charts with a trend filter and a level, yes. A smoothing factor of 0.4 on 4-hour charts helps with 24-hour noise. On thin altcoins the MACD itself is noise and STC amplifies it.
No. Every stage is computed from completed closes and prior values; nothing changes once the bar closes.
The TradingView built-in is exact. The library supplies the level (Fair Value Gaps + Inversion, Order Blocks with Volume), the regime (Adaptive Trend Sentinel) and a multi-timeframe momentum read (MACD Matrix). Zeno, the premium engine, prints signals with stops and targets.
References & Related Guides
Read next
- MACD Indicator: Complete Guide
- True Strength Index
- Stochastic Oscillator
- Stochastic RSI
- WaveTrend Oscillator
- Fair Value Gaps: Complete Guide
- Momentum Trading Strategy
- Order Blocks: Complete Guide
- MACD Matrix (free indicator)
- Fair Value Gaps + Inversion (free indicator)
- Adaptive Trend Sentinel (free indicator)
- Zeno — the premium engine
Primary sources
- TradingView: Schaff Trend Cycle (built-in indicator documentation)
- Schaff, "The Schaff Trend Cycle", FX-Strategy / Stocks & Commodities coverage
- Appel, Technical Analysis: Power Tools for Active Investors (2005) — the MACD it is built on
- Lane, "Lane's Stochastics", Technical Analysis of Stocks & Commodities (1984) — the stochastic stages