How to Read Stock Charts: Price, Candles, Trend, Volume and Relative Strength, Step by Step
To read a stock chart, start with the basics: the ticker and timeframe at the top, price on the right axis, time along the bottom and volume underneath. Then read it in order: what each candle or bar shows (open, high, low, close), which way the trend points (higher highs and higher lows, or lower ones), where buyers and sellers have stepped in before (support and resistance), and whether volume confirms the move. Finally, compare the stock with the market to see if it is leading or lagging.
A stock chart is a record of every decision buyers and sellers made, compressed into one picture. Most beginners look at it the wrong way round: they hunt for a pattern before they know what the chart is even showing. I read every chart in the same order, top to bottom and left to right, and this guide walks you through that routine on a real-looking daily chart, then covers the two settings that change what you see: log scale and relative strength.
How do you read a stock chart?
Read it in a fixed order, the same way every time. That stops you jumping to conclusions from one dramatic candle.
- Orientation: ticker, exchange, timeframe, price scale.
- Price action: what the latest candles say about who is in control.
- Trend: the direction of swing highs and lows over the period you trade.
- Levels: support and resistance from earlier turning points.
- Volume: whether participation confirms what price is doing.
Everything else, from chart patterns to indicators, is built on these five steps. If you skip them, an indicator just gives you a confident-looking answer to the wrong question.
What are the parts of a stock chart?
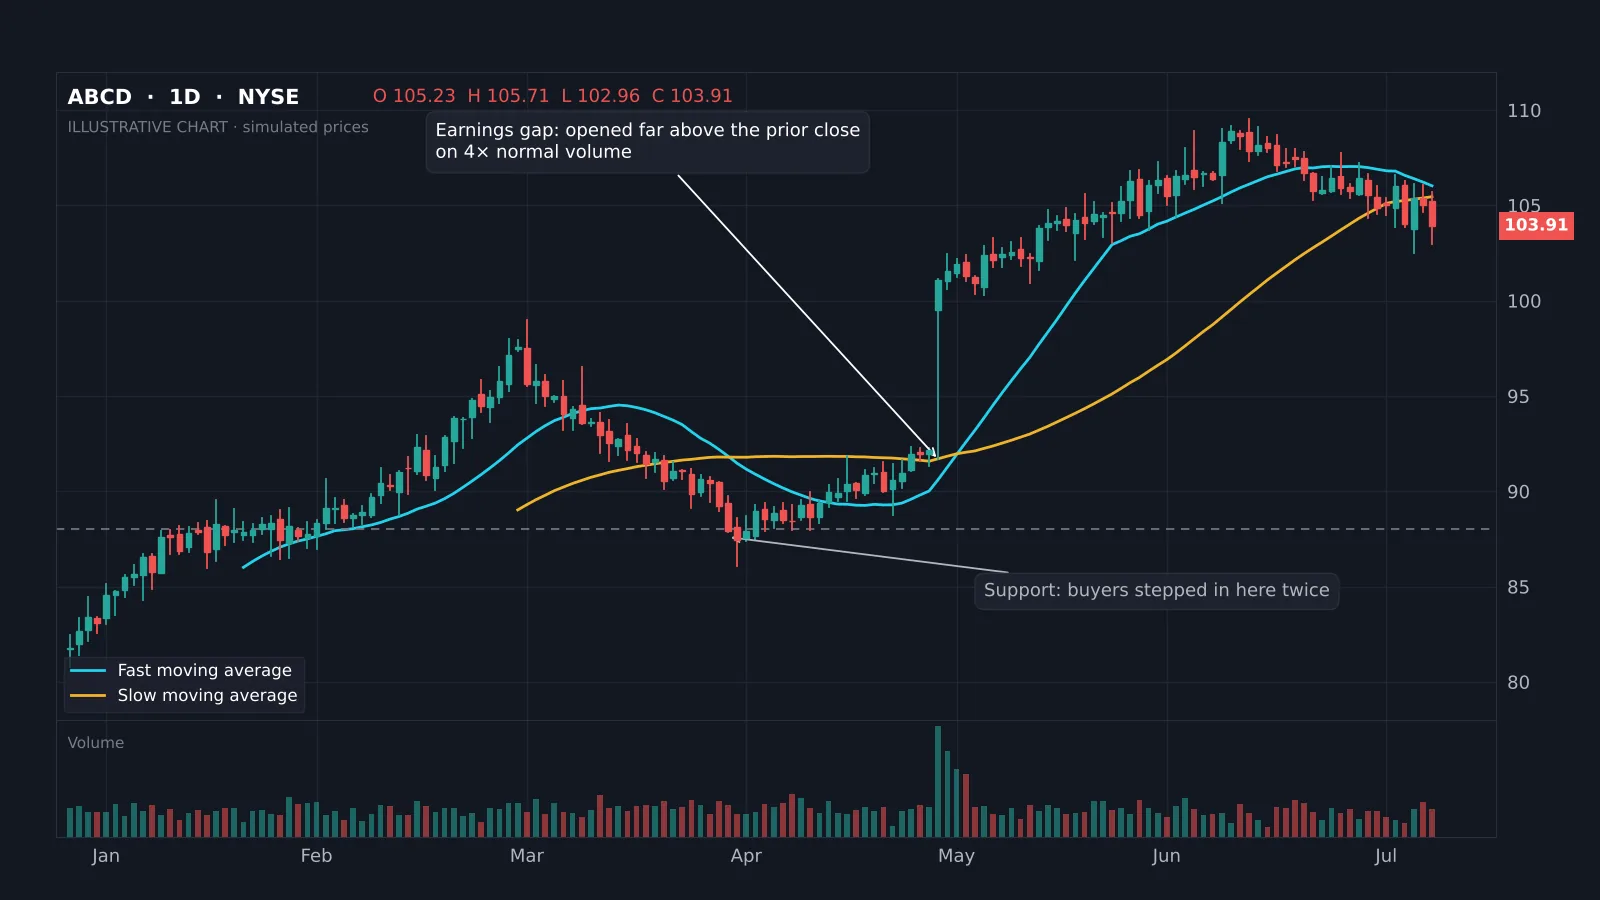
Every charting platform lays the chart out the same way. Learn the parts once and you can read any of them:
| Part | Where | What it tells you |
|---|---|---|
| Ticker and exchange | Top left | Which stock and where it trades, e.g. NYSE or Nasdaq. |
| Timeframe | Top left | How much time each candle covers: 1 minute, 1 day, 1 week. |
| OHLC readout | Top | Open, high, low and close of the candle under your cursor. |
| Price axis | Right | The price scale, linear or logarithmic. |
| Time axis | Bottom | Dates or times for each candle. |
| Volume | Bottom panel | How many shares traded in each period. |
| Overlays | On the price | Moving averages, VWAP or levels you have drawn. |
The header line matters more than people think. A daily chart and a 5-minute chart of the same stock can point in opposite directions, and a chart that is not adjusted for splits will show a crash that never happened.
Line, bar or candlestick: which chart type should you use?
A line chart joins the closing prices. It is clean and good for seeing the long-term picture, but it hides the intraday range. A bar chart (OHLC) shows the open, high, low and close for each period with small ticks. A candlestick chart shows the same four prices with a filled body between open and close, coloured green when the close is higher than the open and red when it is lower.
Most traders use candlesticks because the body and wicks make it easy to see who won each period. A long lower wick says sellers pushed price down and buyers pushed it back. For a full lesson on the anatomy of a candle, see the academy's how to read candlestick charts, then the candlestick patterns guide for the formations worth knowing.
Which timeframe should you read?
Match the chart to how long you plan to hold. A rough guide:
- Weekly: investors and position traders holding for months.
- Daily: swing traders holding days to weeks. This is the best place for beginners to learn.
- 1-hour and 15-minute: short swing trades and timing entries.
- 5-minute and below: day trading, with more noise and more false signals.
The habit that saves the most money is checking one timeframe higher than the one you trade. A breakout on the 15-minute chart is less impressive if the daily chart is sitting right under resistance. The multi-timeframe lesson covers this in detail, and day trading vs swing trading helps you pick a style.
How do you tell the trend on a stock chart?
A trend is a series of swings. In an uptrend each pullback stops above the previous one (higher lows) and each rally goes further (higher highs). A downtrend is the mirror image. When highs and lows overlap with no clear direction, the stock is in a range.
Moving averages make this easier to see. On a daily chart, many traders use a faster average, such as the 50-day, and a slower one, such as the 200-day. Price above both, with the fast average above the slow one, is a healthy uptrend. Price below both, with the fast average under the slow one, is a downtrend. The moving averages guide explains the settings, and the golden cross guide covers what happens when the two lines cross.
The trend tells you which side to favour. Buying pullbacks in an uptrend has the market's momentum behind it; buying dips in a downtrend fights it.
How do you find support and resistance?
Support is a price area where buyers stepped in before; resistance is where sellers did. Look for places where price turned at least twice, where a big gap started, or where a strong move began. On the example chart above, buyers defended the same zone twice in March and April before the stock gapped higher.
Treat levels as zones, not exact prices, and expect them to be tested more than once. When resistance breaks on strong volume, it often becomes support on the next pullback. The support and resistance guide shows how to draw them, and the free Institutional Key Levels indicator marks common ones automatically.
How do you read volume on a stock chart?
Volume is the number of shares traded in each period, shown as bars under the price. It tells you how much conviction sits behind a move.
- Rising price, rising volume: strong demand, the move is more likely to hold.
- Rising price, falling volume: fewer buyers chasing it, the rally may tire.
- Breakout on several times normal volume: institutions are likely involved, as with the earnings gap on the example chart.
- Sharp drop on huge volume: forced selling or bad news; wait for the dust to settle.
Compare each bar with the average of the last 20 or 50 sessions rather than with the bar next to it. The best volume indicators guide covers tools such as OBV and volume profile.
Should you use a log or linear price scale?
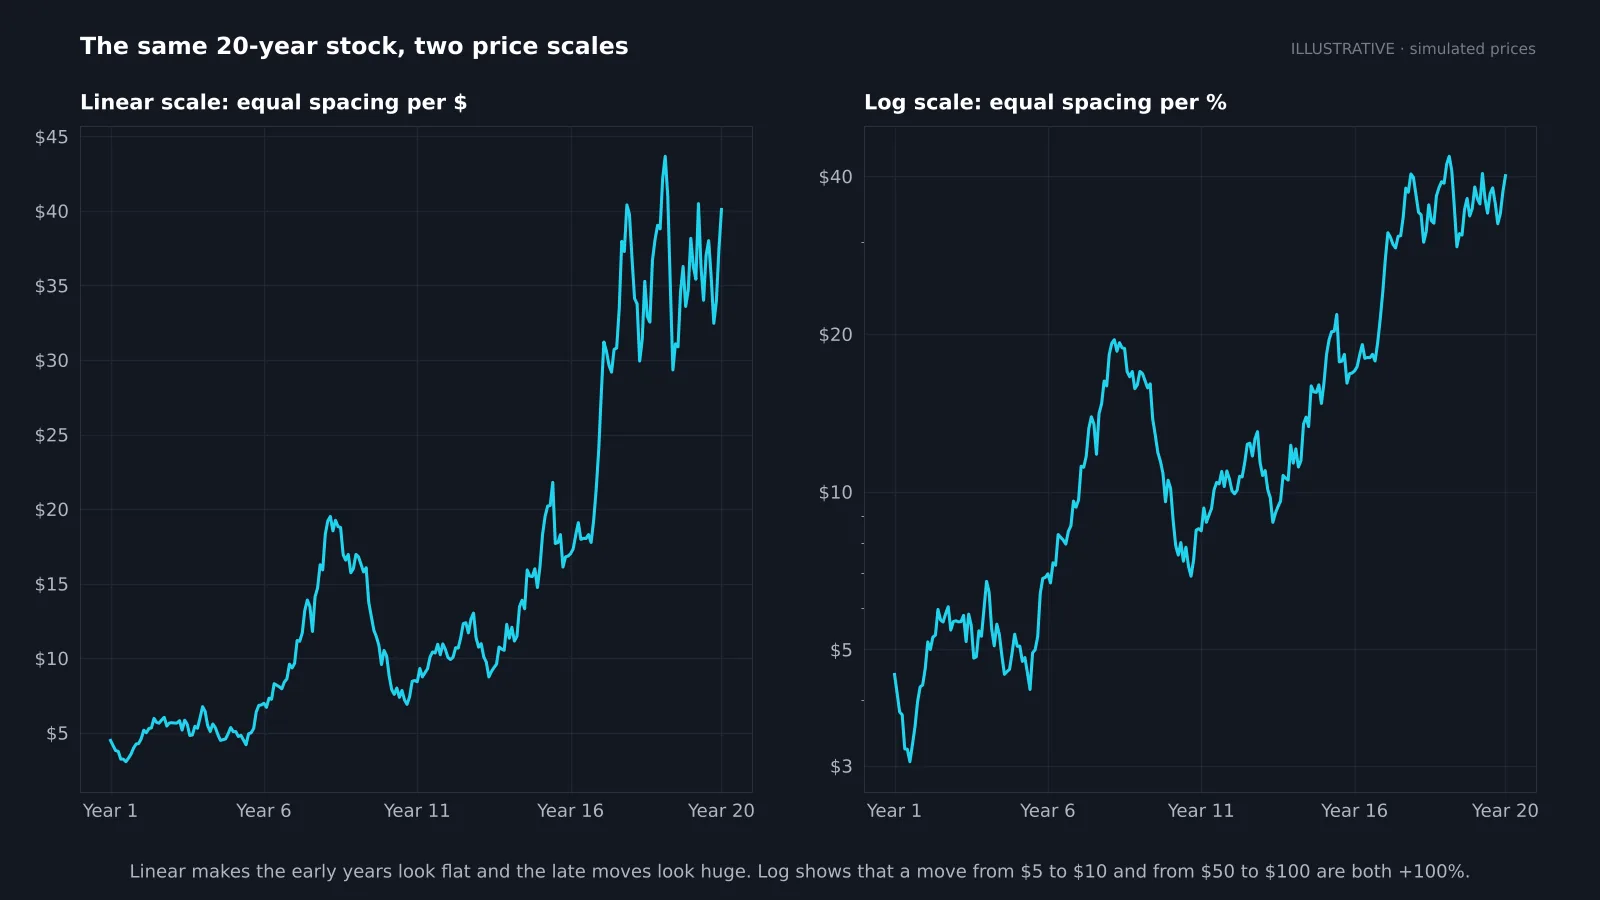
A linear scale spaces prices by dollars: the gap from $10 to $20 is as tall as from $40 to $50. A logarithmic scale spaces prices by percentage: $10 to $20 and $50 to $100 are the same height, because both are +100%.
For short-term charts covering a few weeks the difference is tiny. For long-term charts it changes everything. On a linear scale a stock that has grown for twenty years looks flat for the first decade and wildly volatile at the end. On a log scale you can compare the early moves with the recent ones fairly, and long-term trendlines tend to fit better. Use log for anything covering several years or a large price change. In TradingView, click the L button at the bottom right of the price axis.
How do you check if a stock is beating the market?
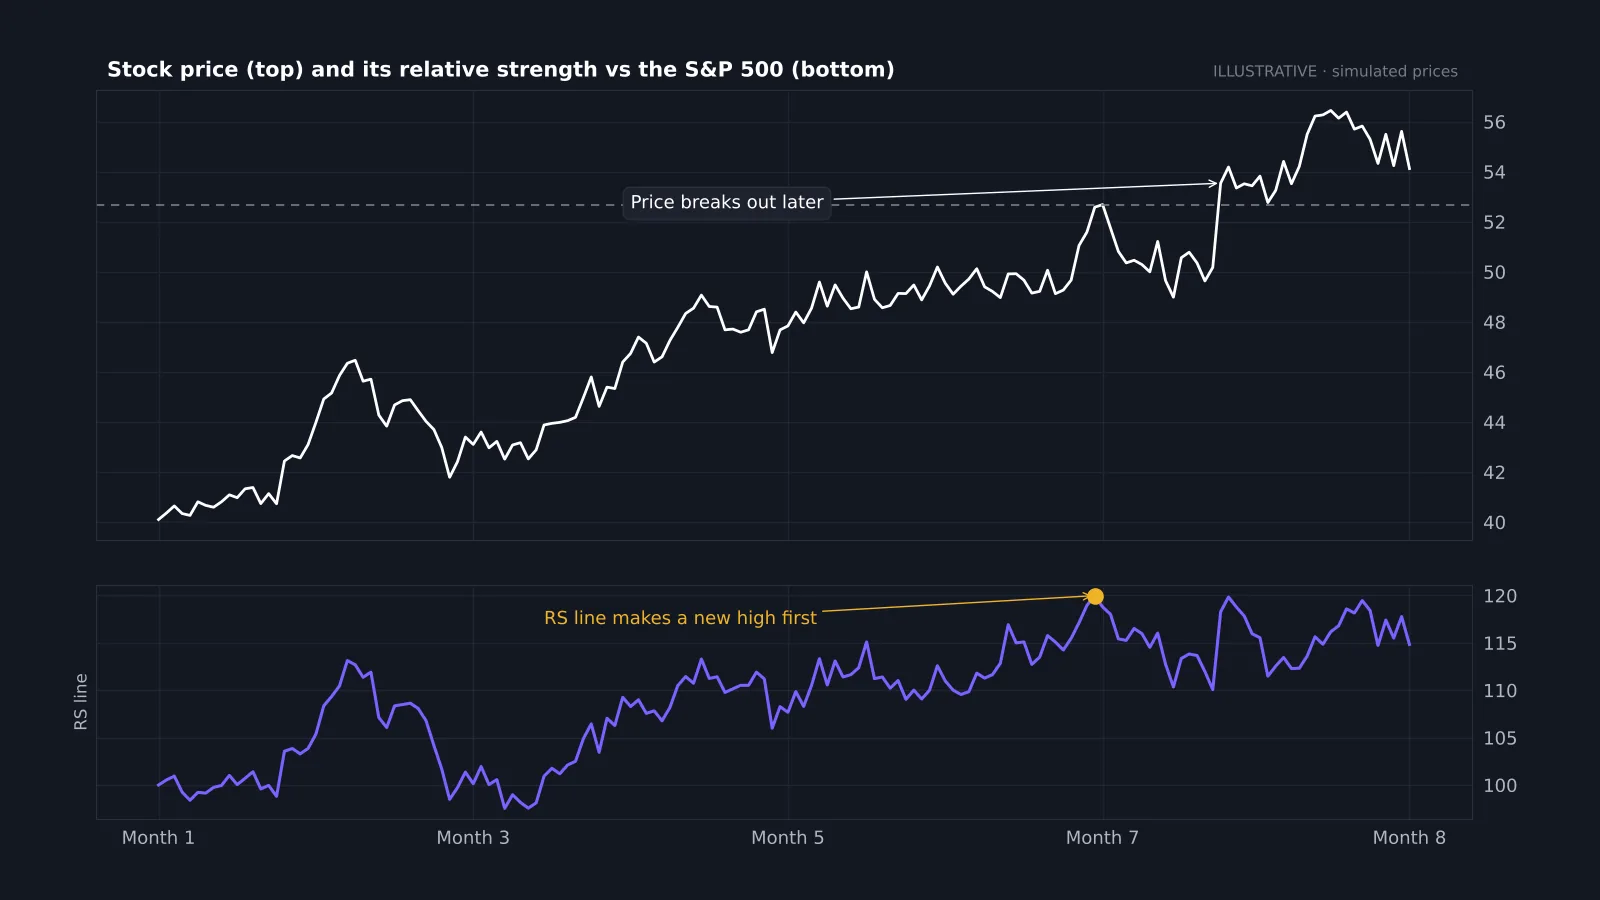
A stock can rise and still be a poor choice if the whole market rose more. Relative strength answers that. Divide the stock's price by an index such as the S&P 500 and plot the result as a line. When the line rises, the stock is outperforming; when it falls, it is lagging.
This is not the RSI indicator; it is a direct comparison with the market. Its most useful signal is a new high in the relative strength line before the price itself makes a new high, as on the example chart. That shows buyers are favouring the stock even while price is still under resistance. Many growth investors filter for stocks with rising relative strength before they look at anything else. The guide to finding stocks uses the same idea for shorter-term trades.
Reference data
| Item | Value |
|---|---|
| Candle colours | Green: close above open · Red: close below open |
| Uptrend | Higher highs and higher lows |
| Common daily averages | 50-day and 200-day |
| Volume benchmark | Compare with the 20- or 50-day average |
| Log scale | Equal space for equal % change |
| Relative strength line | Stock price ÷ index price |
| Beginner timeframe | Daily chart |
Trend and relative strength checker
Enter the latest price, two moving averages and the three-month return for the stock and the S&P 500. The checker labels the trend and tells you whether the stock is leading or lagging the market.
Common mistakes when reading stock charts
- Starting with indicators. Read price, trend and levels first; indicators are a second opinion.
- Ignoring the timeframe. A pattern on a 1-minute chart carries far less weight than the same pattern on a daily chart.
- Using unadjusted data. Splits and large dividends can create fake gaps; use adjusted charts for long-term analysis.
- Seeing patterns everywhere. If you have to squint, it is not there. Our head and shoulders guide shows what a clean one looks like.
- Forgetting earnings dates. A perfect setup can gap through your stop on results day.
- Reading without a plan. Decide entry, stop and target before you trade, and size the position with fixed risk.
Putting it together
Reading a stock chart is a routine, not a talent. Check what you are looking at, read the last few candles, find the trend, mark the levels, confirm with volume, then compare with the market. Do that on twenty charts and you will start spotting the strong ones in seconds. When you are ready to go further, the guide to starting stock trading turns the reading into a plan.
If you chart on TradingView, the free Quantum Algo indicators mark structure, key levels and volume zones so you can focus on the decision instead of the drawing.
Read every stock chart in the same order: ticker, timeframe and scale; the latest candles; the trend from swing highs and lows; support and resistance; then volume. Use a log scale for long-term charts and a relative strength line to see whether the stock beats the market. Patterns and indicators come after these basics, never before.
◆ Interactive check
Can you read a stock chart?
Questions beginners ask about reading stock charts
Start with the ticker, timeframe and price axis, then read the candles, find the trend from swing highs and lows, mark support and resistance, and check volume.
A green candle closed higher than it opened; a red candle closed lower. The wicks show the highest and lowest prices of the period.
The daily chart is the best place to learn. Use weekly for long-term investing and intraday charts only if you day trade.
How many shares traded. Big moves on high volume show strong conviction; moves on low volume are easier to reverse.
Use log for long-term charts or big price changes, because it shows percentage moves fairly. For a few weeks of data, either works.
The stock's price divided by an index such as the S&P 500. A rising line means the stock is beating the market.
No. RSI measures a stock's own momentum on a 0–100 scale; relative strength compares the stock with the market.
The basics take a few days. Reading them well takes a few months of looking at charts daily and reviewing your decisions in a journal.
References & Related Guides
Read next
- How to Read Candlestick Charts
- Candlestick Patterns
- Chart Patterns
- Support and Resistance
- Moving Averages
- Best Volume Indicators
- How to Start Trading Stocks
- Best Indicator for Stocks
- Trend Trading Strategy
- Robinhood and TradingView