Hash Ribbons: The Bitcoin Miner Capitulation Indicator Explained
Hash Ribbons is a Bitcoin indicator created by Charles Edwards of Capriole Investments. It compares the 30-day and 60-day moving averages of the network hash rate. When the 30-day average falls below the 60-day, miners are switching machines off: that is miner capitulation, and it has often coincided with weak prices near cycle lows. When the 30-day average crosses back above the 60-day, capitulation is over, and once price momentum also turns up (the 10-day price average crossing above the 20-day), the indicator gives its buy signal. Historically that signal has appeared near major lows, but it is rare, can be early, and its edge has weakened as mining matured.
Most indicators look at price. Hash Ribbons looks at the machines that secure Bitcoin. When mining stops paying, weaker miners switch off and sell coins to survive, and that stress has repeatedly shown up near the bottom of Bitcoin's cycles. This guide explains how Hash Ribbons measures that stress, what each phase means, how the buy signal has performed, why it is weaker than it used to be and how to use it alongside price. A phase checker below lets you plug in current readings and see where the indicator stands.
Indicators that prove themselves in public.
One engine, four precision tools — the Gold (XAU) Scalper, the institutional Gravity Zone, the Zeno momentum Oscillator, and Zeno Stocks for equities.
What are Hash Ribbons?
Hash Ribbons is an on-chain Bitcoin indicator that tracks the health of the mining industry. It was introduced in 2019 by Charles Edwards, founder of the digital asset fund Capriole Investments, in an article titled "Hash Ribbons & Bitcoin Bottoms". The idea is simple: when mining becomes unprofitable, miners switch off machines and sell coins, and that forced selling has tended to happen close to the bottom of Bitcoin's bear markets.
The indicator is built from the network hash rate, the total computing power miners point at Bitcoin. It plots two moving averages of hash rate, one over 30 days and one over 60 days. These two lines are the "ribbons". When the faster 30-day line drops below the slower 60-day line, hash rate is shrinking and miners are under stress. When it crosses back above, the stress is over.
Hash Ribbons belongs to the same family as cycle tools such as the MVRV Z-Score and the Pi Cycle Top: indicators that look at Bitcoin's long-term structure rather than short-term price action. It is a bottom-finding tool, not a top indicator, and it was designed for Bitcoin only.
How do Hash Ribbons work?
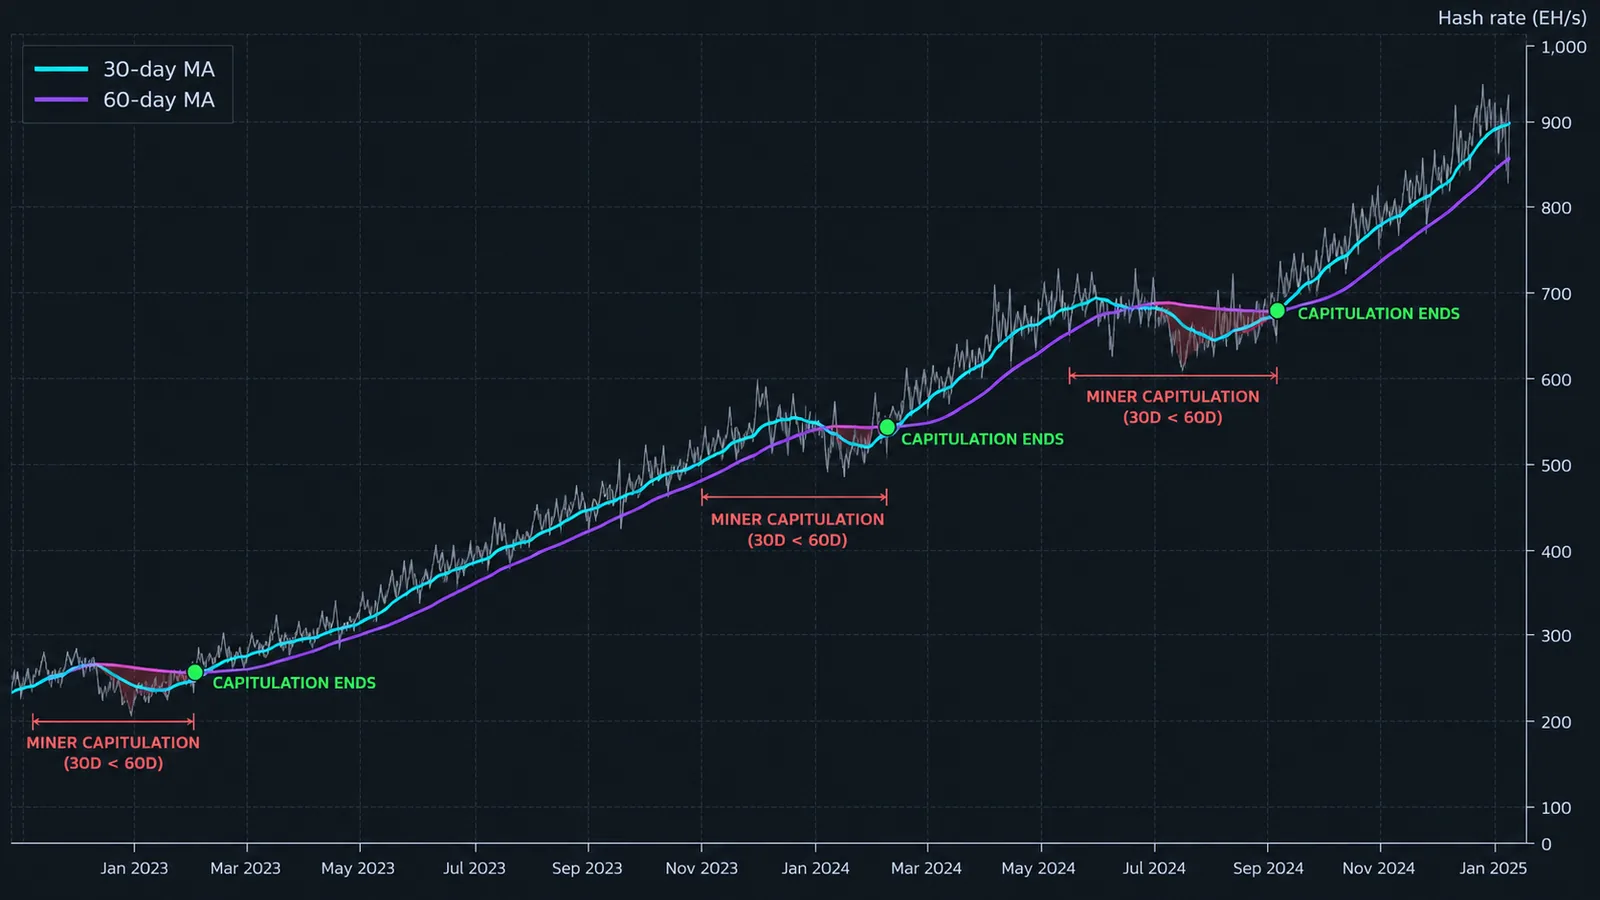
The rules, as Capriole describes them, have three parts:
- Capitulation starts when the 30-day moving average of hash rate crosses below the 60-day moving average. Charts usually shade this period.
- Capitulation ends when the 30-day average crosses back above the 60-day. Miners have stopped switching off and hash rate is growing again.
- The buy signal fires when capitulation has ended and price momentum turns positive. Edwards measures momentum with a 10-day simple moving average of price crossing above the 20-day average. Some sites simplify this to "price is rising" after the recovery cross.
The momentum filter matters. Hash rate can recover while price is still sliding, and buying at the first recovery cross has sometimes meant buying into the last leg down. Waiting for price momentum to confirm costs a little of the move but avoids some of the worst entries.
A capitulation is usually a hash rate decline of roughly 10% to 40% and typically lasts from about a week to two months. Short, shallow dips are common and mean little; long, deep capitulations are the ones that have mattered most.
Why does miner capitulation matter for Bitcoin price?
Miners are the one group of Bitcoin holders who must sell. They earn new coins every day but pay electricity, hosting and debt in dollars. When revenue per unit of hash rate (often called hashprice) falls below their costs, the least efficient miners have two choices: switch machines off or sell coins faster to stay afloat. Usually they do both.
That creates a cycle:
- A falling price or a halving (which cuts the block reward by half roughly every four years) squeezes miner revenue.
- Older machines and high-cost miners switch off, so hash rate falls. That is the capitulation the ribbons detect.
- Struggling miners sell coin reserves, adding supply to a weak market.
- Bitcoin's difficulty adjusts every 2,016 blocks, roughly every two weeks. When hash rate has fallen, difficulty drops, and the surviving miners earn more per machine.
- Once the weakest miners are gone and their selling is done, pressure fades and hash rate starts growing again.
The end of capitulation therefore marks a point where one source of forced selling has been exhausted. It does not mean every seller is done, which is why price confirmation still matters.
How have Hash Ribbons buy signals performed?
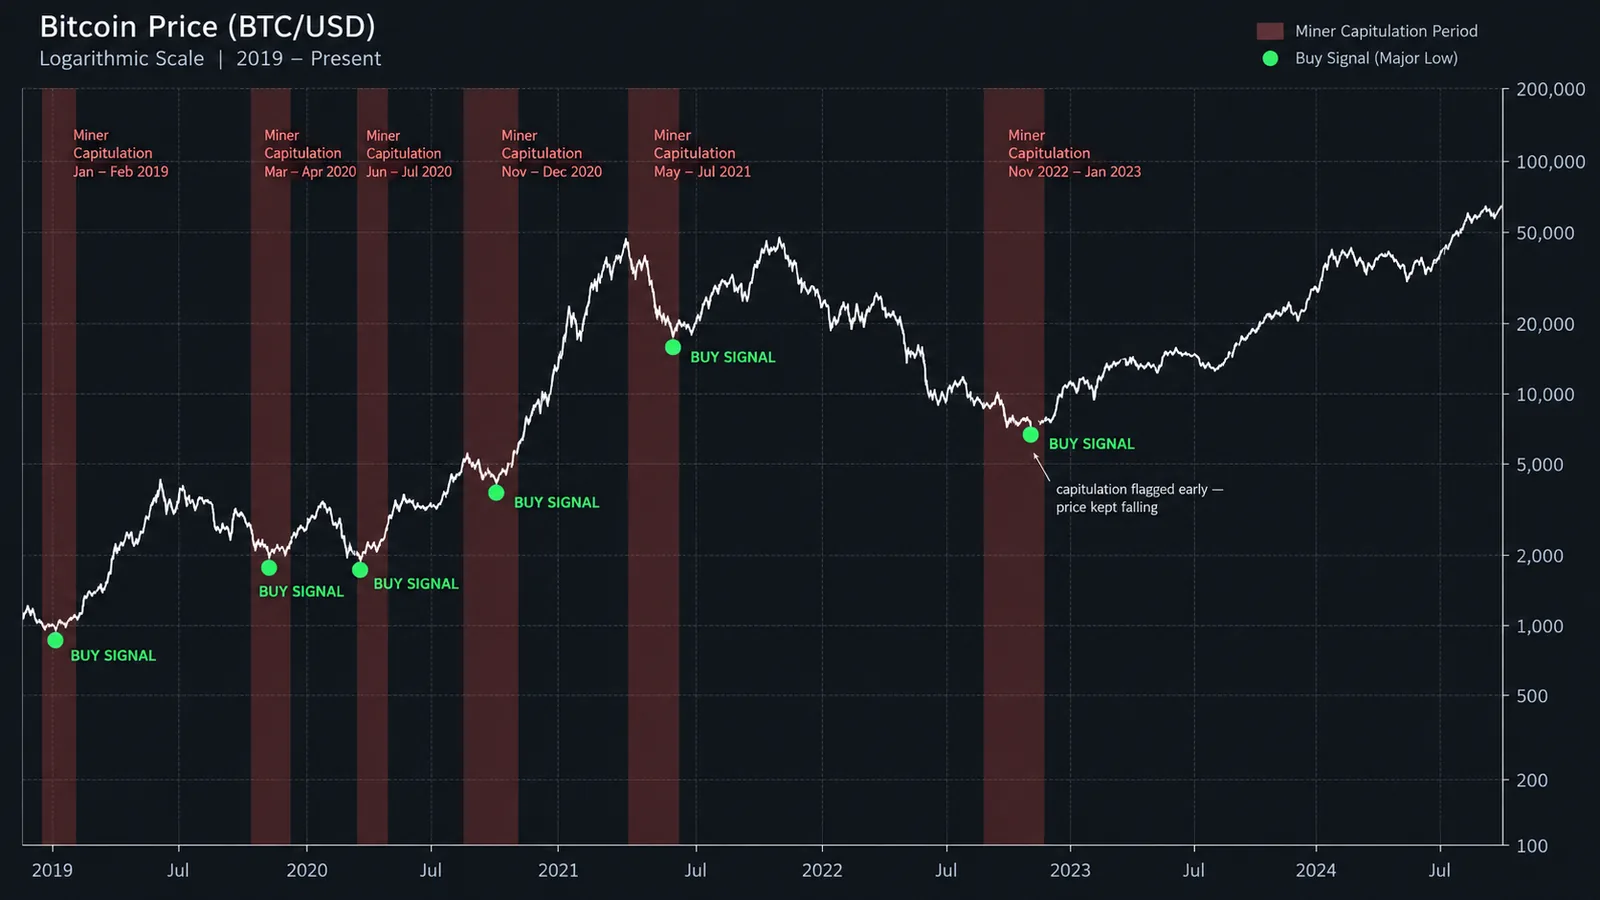
The indicator's reputation comes from a handful of well-timed signals. Approximate dates and prices from public trackers such as LookIntoBitcoin and Capriole:
| Signal | Approximate BTC price | Context |
|---|---|---|
| January 2019 | About $3,600 | Near the bottom of the 2018 bear market |
| April 2020 | About $7,500 | After the March 2020 crash |
| July 2020 | About $9,300 | After the third halving; preceded the move above $10,000 |
| December 2020 | About $19,200 | Early in the bull run that peaked in 2021 |
| August 2021 | About $44,600 | After China's mining ban forced a record capitulation |
| After the 2022 capitulations | Roughly $17,000 to $21,000 | Capitulation was first flagged in June 2022, months before the November low |
Two lessons stand out. First, the signals have often been early rather than exact: in 2022 capitulation was flagged in June, months before the final low in November, and holders who bought the first recovery had to sit through more downside. Second, signals are rare, which makes the sample small. A handful of good calls is encouraging but not statistical proof.
More recently, a capitulation that began in late November 2025 ran into early 2026 and was one of the longest on record, while Bitcoin fell from around $90,000 to a low near $60,000 in early February. That episode is a reminder that a capitulation in progress is not a signal to buy on its own; the end of capitulation and the momentum confirmation are the parts of the rule that matter.
Hash Ribbons phase checker
Enter the current 30-day and 60-day hash rate averages, the same values from a week ago and the 10-day and 20-day moving averages of Bitcoin's price. Hash rate averages are available free from sites such as LookIntoBitcoin, Glassnode and Blockchain.com. The checker tells you which phase the indicator is in and whether the buy signal conditions are met.
Why are Hash Ribbons weaker than they used to be?
Charles Edwards has said himself that the signal's influence fades with each halving, and there are good reasons for that:
- Miners matter less to supply. Each halving cuts the number of new coins miners produce, so their selling is a smaller share of total market activity. ETF flows, long-term holders and derivatives now move price far more than miner reserves.
- Mining is more professional. Large public miners hedge, borrow against equipment and hold coins on their balance sheets. They switch off less and sell more strategically than the small operators of earlier cycles.
- Hash rate has non-price drivers. Weather, energy prices, curtailment deals with power grids and regulation can all move hash rate. The 2021 China ban produced a huge capitulation that had nothing to do with profitability.
- Everyone watches it. A well-known signal tends to be front-run, which spreads its effect over a longer period.
None of this makes the indicator useless. Miner stress is still real information about the state of the market. But it is better treated as one input in a cycle framework than as a stand-alone buy button.
How do you use Hash Ribbons in practice?
A sensible way to use the indicator:
- Treat capitulation as a watch zone, not an entry. Note that the market is under stress and start planning, but do not buy simply because miners are switching off.
- Wait for the recovery cross of the 30-day above the 60-day average.
- Require price confirmation: the 10-day price average above the 20-day, or a structural change on the daily chart such as a higher high and higher low.
- Combine with other cycle tools. A Hash Ribbons buy signal while the MVRV Z-Score is in its low zone and the Fear and Greed Index shows fear is much stronger than any one of them alone.
- Scale in and manage risk. Because signals can be early, many long-term investors spread entries over several weeks after a signal rather than buying all at once.
For short-term traders, Hash Ribbons is too slow to time entries. It works better as a backdrop: during capitulation, be cautious with long setups and expect volatility; after a confirmed buy signal, favour long setups on your normal timeframe.
Hash Ribbons vs other Bitcoin cycle indicators
| Indicator | Data | What it flags | Typical use |
|---|---|---|---|
| Hash Ribbons | Hash rate (30-day and 60-day averages) plus price momentum | End of miner capitulation | Spotting cycle lows |
| MVRV Z-Score | Market value vs realised value | Over- and undervaluation | Both tops and bottoms |
| Pi Cycle Top | 111-day and 2 × 350-day price averages | Overheated price | Cycle tops |
| Puell Multiple | Daily miner revenue vs its 365-day average | Miner revenue extremes | Both tops and bottoms |
| Power law | Price vs time on a log-log scale | Long-term fair value band | Valuation context |
Hash Ribbons and the Puell Multiple both look at miners, but from different angles: Puell looks at revenue, Hash Ribbons looks at how miners react to it. The Bitcoin power law gives a long-term valuation band to put any cycle signal in context.
Where can you see Hash Ribbons?
Free versions of the chart are published by LookIntoBitcoin (Bitcoin Magazine Pro), Capriole and several on-chain data sites. On TradingView, search the community scripts for "Hash Ribbons": several versions pull hash rate data from on-chain feeds, and Capriole's own version is widely used. Check which data source a script uses, because hash rate estimates differ slightly between providers and can shift signal dates by a few days.
Hash rate itself is an estimate. Nobody can count every machine; the network hash rate is inferred from how quickly blocks are found, which is noisy day to day. That is one reason the indicator uses 30-day and 60-day averages rather than raw readings.
Hash Ribbons and Quantum Algo
Hash Ribbons tells you when the miner side of the market has been washed out. It does not tell you where to enter, where to put a stop or when the trend on your chart has actually turned. That still comes from price.
The free Quantum Algo indicators mark market structure, liquidity and trend on TradingView, which is where a Hash Ribbons backdrop becomes a trade plan. Zeno, the premium engine from Quantum Algo (QuantumAlgo), prints signals with an entry, a stop and two targets on Bitcoin, other crypto, gold, indices and stocks, and every call is on the public track record.
Hash Ribbons compares the 30-day and 60-day moving averages of Bitcoin's hash rate. A drop of the 30-day below the 60-day signals miner capitulation; the cross back above ends it, and the buy signal comes when price momentum also turns up. The signal has appeared near several major lows, but it is rare, can be early and has weakened as mining matured. Use it as a cycle backdrop alongside valuation tools and price structure, not as a stand-alone entry.
◆ Interactive check
How well do you know Hash Ribbons?
Questions traders ask about Hash Ribbons
A Bitcoin indicator that compares the 30-day and 60-day moving averages of the network hash rate to spot miner capitulation, and gives a buy signal when capitulation ends and price momentum turns up.
After a capitulation, the 30-day hash rate average crosses back above the 60-day average and the 10-day moving average of price crosses above the 20-day. Both conditions together form the signal.
Historically its buy signals have appeared near several major Bitcoin lows, but the sample is small, signals can come early, and its creator has said its influence fades with each halving. Use it with other tools.
A period when mining becomes unprofitable for weaker operators, who switch off machines and often sell coins. It shows up as falling hash rate and has tended to occur near cycle lows.
Yes, as community scripts. Search for "Hash Ribbons" in the indicators menu and check which hash rate data source the script uses.
Usually from about a week to two months. Longer, deeper capitulations, such as the one after the 2021 China mining ban, have been the most significant.
No. It is built from Bitcoin's hash rate and is designed for Bitcoin only, although altcoins often follow Bitcoin's cycle.
Not on that alone. Capitulation marks stress, and price can keep falling during it. The signal is the end of capitulation plus price confirmation, and even then many investors scale in.
References & Related Guides
Read next
- MVRV Z-Score
- Pi Cycle Top Indicator
- Bitcoin Power Law
- Crypto Fear and Greed Index
- Bitcoin Dominance
- Total Crypto Market Cap
- Crypto Market Breadth
- Best Crypto Indicators
- Crypto Trading for Beginners
- Moving Averages
- Free TradingView indicators
- Zeno — the premium engine