Outside Bar Explained: Bullish and Bearish Setups, Entries, Stops and How It Differs From Engulfing and Inside Bars

An outside bar is a candle whose high is above the previous candle's high and whose low is below the previous candle's low, so it fully covers the prior bar's range. A bullish outside bar closes near its high after sweeping below the prior low; a bearish one closes near its low after poking above the prior high. Traders usually enter on a break of the outside bar's high or low, with the stop beyond the other end, and only take it at a meaningful level.
The outside bar is one of the simplest price-action signals: one bar that takes out both sides of the bar before it. It shows a fight in which one side swept the other's stops and then took control. On its own it is noisy. At support, at resistance or after a stop run, it becomes one of the cleanest reversal triggers on a chart. Here is how to read it, how to trade it and where it fails.
What is an outside bar?
An outside bar (also called an outside day on daily charts) is any bar whose range engulfs the range of the bar before it: the high is higher and the low is lower. It works on every timeframe and in every market, from a 5-minute futures chart to a weekly stock chart.
The shape tells a short story. During the bar, price ran stops on one side of the previous bar, then reversed and ran stops on the other side. Where it closes shows who won. That is why the close matters as much as the shape: an outside bar that closes in the middle of its range says the fight is undecided.
How do you trade a bullish outside bar?
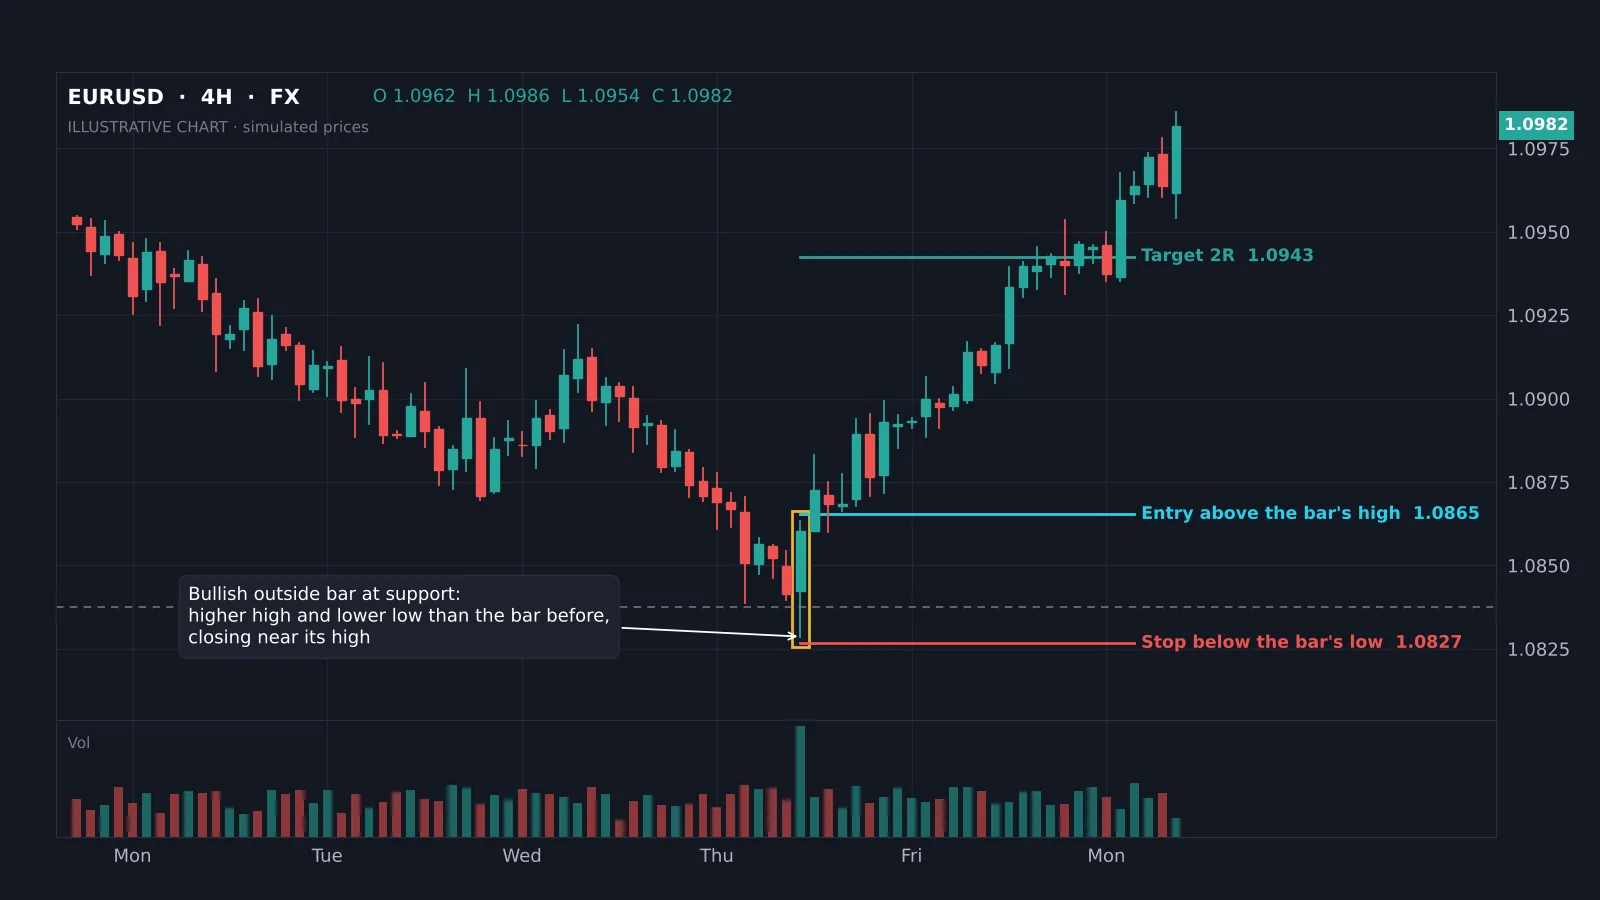
A bullish outside bar dips below the previous bar's low, often taking out the stops of traders who bought there, then rallies and closes near its own high, above the previous bar's high. At support or after a downtrend it signals that sellers were absorbed and buyers have taken over.
The classic entry is a buy stop a little above the outside bar's high, so the trade only triggers if buyers follow through. The stop goes a little below the outside bar's low, and a first target of twice the risk (2R) is common, as in the EURUSD example above. A more aggressive entry is a limit order on a pullback into the bar's upper half, which improves the risk-reward but sometimes misses the move.
How do you trade a bearish outside bar?
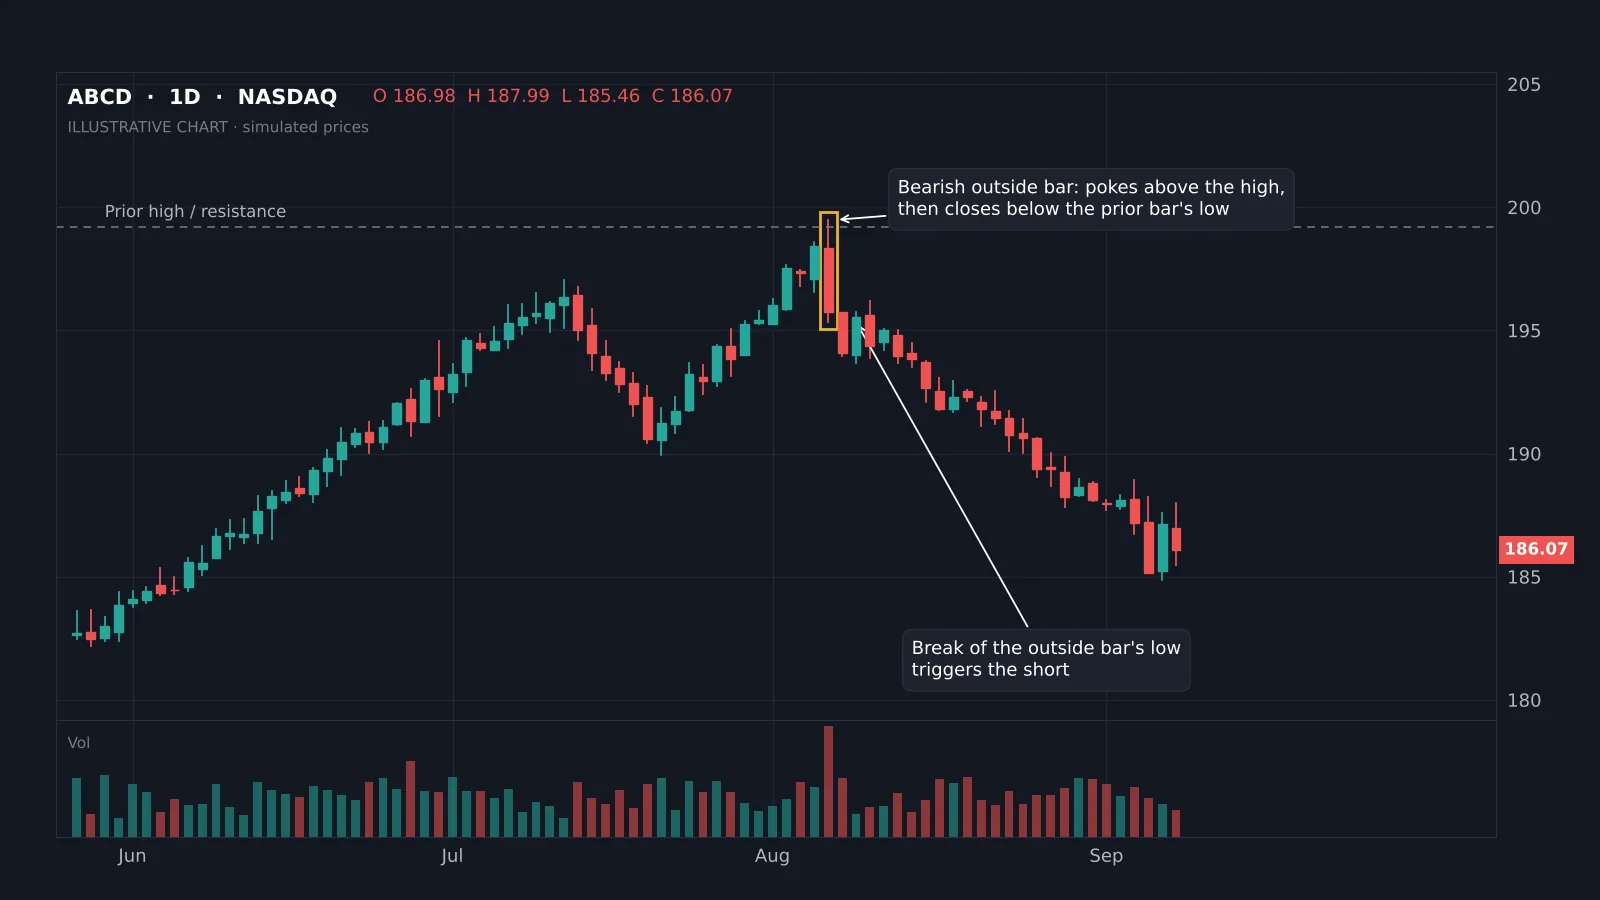
A bearish outside bar is the mirror image. It pushes above the previous high, often above a visible resistance level or prior swing high, triggers breakout buyers and stops, then reverses and closes near its low, below the previous bar's low. It is a common signature of a liquidity sweep.
Enter with a sell stop below the outside bar's low, place the stop above its high, and target the next support or 2R. In strong uptrends many bearish outside bars fail, so it is worth waiting for one that forms at a clear higher-timeframe level or after the trend has already stalled.
Outside bar vs engulfing candle vs inside bar
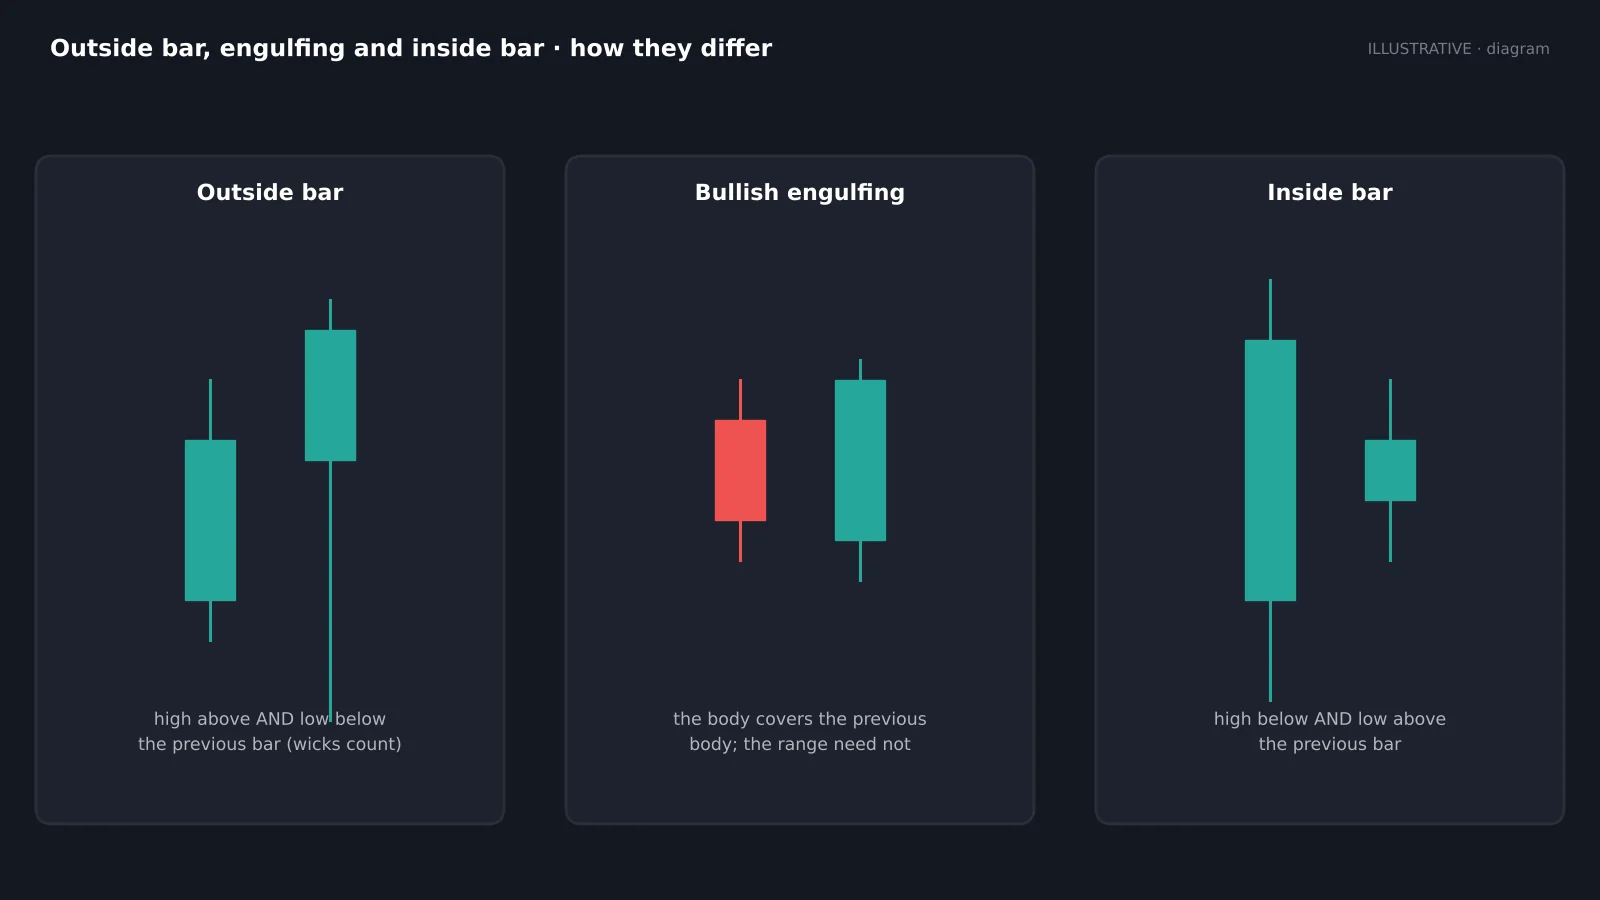
The three are often confused. An outside bar is defined by the high and low, wicks included. An engulfing candle is defined by the bodies: the second body covers the first body, while its wicks may or may not exceed the previous range. An inside bar is the opposite of an outside bar: its whole range sits within the previous bar.
| Outside bar | Engulfing candle | Inside bar | |
|---|---|---|---|
| Compares | High and low (wicks) | Bodies (open and close) | High and low (wicks) |
| Rule | Higher high and lower low | Body covers the prior body | Lower high and higher low |
| What it shows | Both sides' stops run, then a winner | A strong close against the prior bar | Contraction, indecision |
| Typical use | Reversal or continuation trigger | Reversal trigger | Breakout setup |
Many bars are both an outside bar and an engulfing candle. The distinction matters when a bar engulfs the previous body but not its wicks: that is engulfing, not outside, and it shows a weaker stop run.
Where do outside bars work best?
- At support and resistance you drew before the bar formed. The support and resistance guide covers how to find them.
- After a stop run beyond an obvious swing high or low, equal highs or a round number.
- With the higher-timeframe trend: a bullish outside bar on a 1-hour chart in a daily uptrend has a tailwind.
- At the end of a pullback inside a trend, as a continuation signal.
- With expanded volume on stocks and futures, which shows real participation.
In the middle of a range, with no level nearby, outside bars appear constantly and mean little. Most of the edge comes from where the bar forms, not from the bar itself.
Where should you enter and place the stop?
- Breakout entry: buy stop a few ticks above the high (bullish) or sell stop below the low (bearish). Safer, but the stop is the full bar away.
- Retracement entry: limit order at 50% of the outside bar. Better risk-reward, lower fill rate.
- Stop: beyond the opposite end of the outside bar, plus a buffer for the spread. If that makes the stop too wide, skip the trade or reduce size.
- Target: the next level or a fixed 2R, then trail with a trailing stop if it runs.
- Cancel the pending order if it has not triggered within one or two bars.
Outside bars are large by definition, so the stop is often wider than for other patterns. Size the position from the stop distance, not the other way round.
How can you filter out bad outside bars?
Most traders who give up on outside bars took every one they saw. A few filters cut the noise:
- Close location: require the close in the top or bottom quarter of the bar.
- Size: skip bars more than about two times the average true range; the stop becomes too wide. The ATR guide shows how to measure it.
- Level: only trade bars that touch a pre-marked level.
- Trend: trade with the higher timeframe unless the bar is at a major level.
- Session: on intraday charts, ignore outside bars in thin hours and around news releases.
Which timeframes suit the outside bar?
The pattern is most reliable on the 4-hour, daily and weekly charts, where each bar holds a lot of trading and stop runs mean something. A weekly outside bar at a multi-month level is a significant event; a 1-minute outside bar is mostly noise.
A useful approach is to spot the outside bar on a higher timeframe and refine the entry on a lower one, for example a daily outside bar entered on a 1-hour break of structure. Our guide to higher-timeframe bias explains how to stack timeframes.
Outside bar risk calculator
Enter the outside bar's high and low, the direction, your account size and the percentage you are willing to risk. The calculator gives the entry, stop, 2R target and position size in units.
Reference data
| Item | Rule |
|---|---|
| Outside bar | High > prior high and low < prior low |
| Bullish close | Top 25% of the bar's range |
| Bearish close | Bottom 25% of the bar's range |
| Breakout entry | A few ticks beyond the bar's high or low |
| Stop | Beyond the opposite end + spread buffer |
| Size filter | Skip bars over ~2 × ATR |
| Best timeframes | 4-hour, daily, weekly |
When does the outside bar fail?
The most common failure is the trap within the trap: the outside bar sweeps one side, triggers your entry, then reverses again and runs your stop. This happens most in ranges, around news and when the bar is far larger than recent bars.
A second failure is the 'outside bar that never triggers': price drifts back inside the bar and goes nowhere. Cancelling unfilled orders after a bar or two avoids tying up attention. Finally, an outside bar against a strong trend often marks only a pause, not a reversal. Track your own results by context in a trading journal; the numbers usually show clearly which situations are worth trading.
Can indicators help confirm an outside bar?
Indicators are best used as context, not triggers. A bullish outside bar that forms while the RSI shows bullish divergence, or while price sits at a volume node or VWAP, has more behind it than a bar in open space. Volume expansion on the outside bar itself is the simplest confirmation in stocks and futures.
The free Institutional Key Levels indicator marks the levels where outside bars matter most, and the free Smart Money Concepts Engine highlights the liquidity sweeps that outside bars often complete.
Is the outside bar a reliable pattern?
On its own, no pattern is reliable. The outside bar becomes useful when it forms at a level you marked in advance, after a visible stop run, closes strongly in your direction and fits the higher-timeframe picture. In that context it gives a clear entry, a logical stop and an obvious invalidation, which is what a good trigger should do.
Start by marking every outside bar at your levels on past charts, note what happened next, then trade it small and record the results before sizing up.
An outside bar has a higher high and a lower low than the previous bar. Bullish ones close near the high after sweeping the prior low; bearish ones close near the low after poking above the prior high. Enter on a break of the bar's high or low, stop beyond the other end, target the next level or 2R. Trade them at pre-marked levels and after stop runs, filter by close location and size, and skip them in the middle of ranges.
◆ Interactive check
Can you read an outside bar?
Questions traders ask about outside bars
Either. The close decides: near the high is bullish, near the low is bearish, in the middle is neutral.
Not always. An outside bar compares highs and lows; an engulfing candle compares bodies. Many bars are both, but not all.
An outside bar on a daily chart: a day whose high and low exceed the previous day's.
Beyond the opposite end of the outside bar, with a small buffer for the spread.
Yes, especially on 4-hour and daily charts at clear levels. Ignore those formed around high-impact news.
An inside bar, whose high and low are both within the previous bar's range.
It depends heavily on context. At pre-marked levels after a stop run it is a useful trigger; in the middle of a range it is close to random.
Yes. A bullish outside bar at the end of a pullback in an uptrend often restarts the trend.
References & Related Guides
Read next
- Inside Bar Trading
- Engulfing Candle
- Pin Bar Trading
- Liquidity Sweeps
- Support and Resistance
- Candlestick Patterns
- ATR
- Higher-Timeframe Bias
- Trailing Stop Loss
- Swing Failure Pattern