Is Swing Trading Profitable? What the Research Shows, the Math a Winner Needs, and How to Test Yourself
Swing trading can be profitable, but most people who try it lose money or underperform simply holding an index fund. It works when a strategy has positive expectancy after costs: for example, winning 40% of trades with winners 2.2 times the size of losers. Profit then depends on risk per trade, the number of trades and discipline. Before risking real money, prove the edge on at least 100 recorded trades.
Swing trading sits between day trading and investing: you hold positions for a few days to a few weeks and try to catch one move. It needs less screen time than day trading and suits people with a job, which is why it is so popular. Popular is not the same as profitable. This answer looks at what research on retail traders shows, the arithmetic that separates winners from losers, the hidden costs, and a calculator to test your own numbers.
Is swing trading profitable for most people?
For most people, no. There are no large studies that separate swing traders from other active traders, but the studies of retail trading in general point the same way. Barber and Odean's study of 66,465 US brokerage households found the most active traders earned 11.4% a year while the market returned 17.9%. A study of Brazilian futures day traders found 97% of those who persisted for more than 300 days lost money. Work on Taiwan's market found fewer than 1% of day traders were predictably profitable.
Swing trading trades less often than day trading, so costs bite less, and it has more time per decision. That helps. But the same problems apply: no tested edge, too much size, and decisions made on emotion. The honest answer is that swing trading can be profitable for the small group who treat it as a tested process, and usually is not for everyone else. For the trade-offs between the styles, see day trading vs swing trading.
What makes a swing trading strategy profitable?
One number: expectancy, the average result per trade measured in R (one unit of initial risk).
Expectancy = (win rate × average win) − (loss rate × average loss) − costs
A swing trader who wins 40% of trades, makes 2.2R on winners, loses 1R on losers and pays 0.1R in costs per trade has expectancy of 0.4 × 2.2 − 0.6 × 1 − 0.1 = +0.18R. Over 100 trades that is about +18R. Risking 1% per trade, that is roughly +18% before compounding.
| Win rate | Average win | Average loss | Costs | Expectancy per trade |
|---|---|---|---|---|
| 40% | 2.2R | 1R | 0.1R | +0.18R |
| 50% | 1.5R | 1R | 0.1R | +0.15R |
| 60% | 0.8R | 1R | 0.1R | −0.02R |
| 35% | 3R | 1R | 0.1R | +0.30R |
| 45% | 1.2R | 1R | 0.1R | −0.11R |
Notice that win rate alone tells you nothing. A 60% win rate with winners smaller than losers can lose money; a 35% win rate with 3R winners can make plenty. Our swing trading strategies guide shows setups that produce this kind of payoff.
What does a profitable swing trade look like?
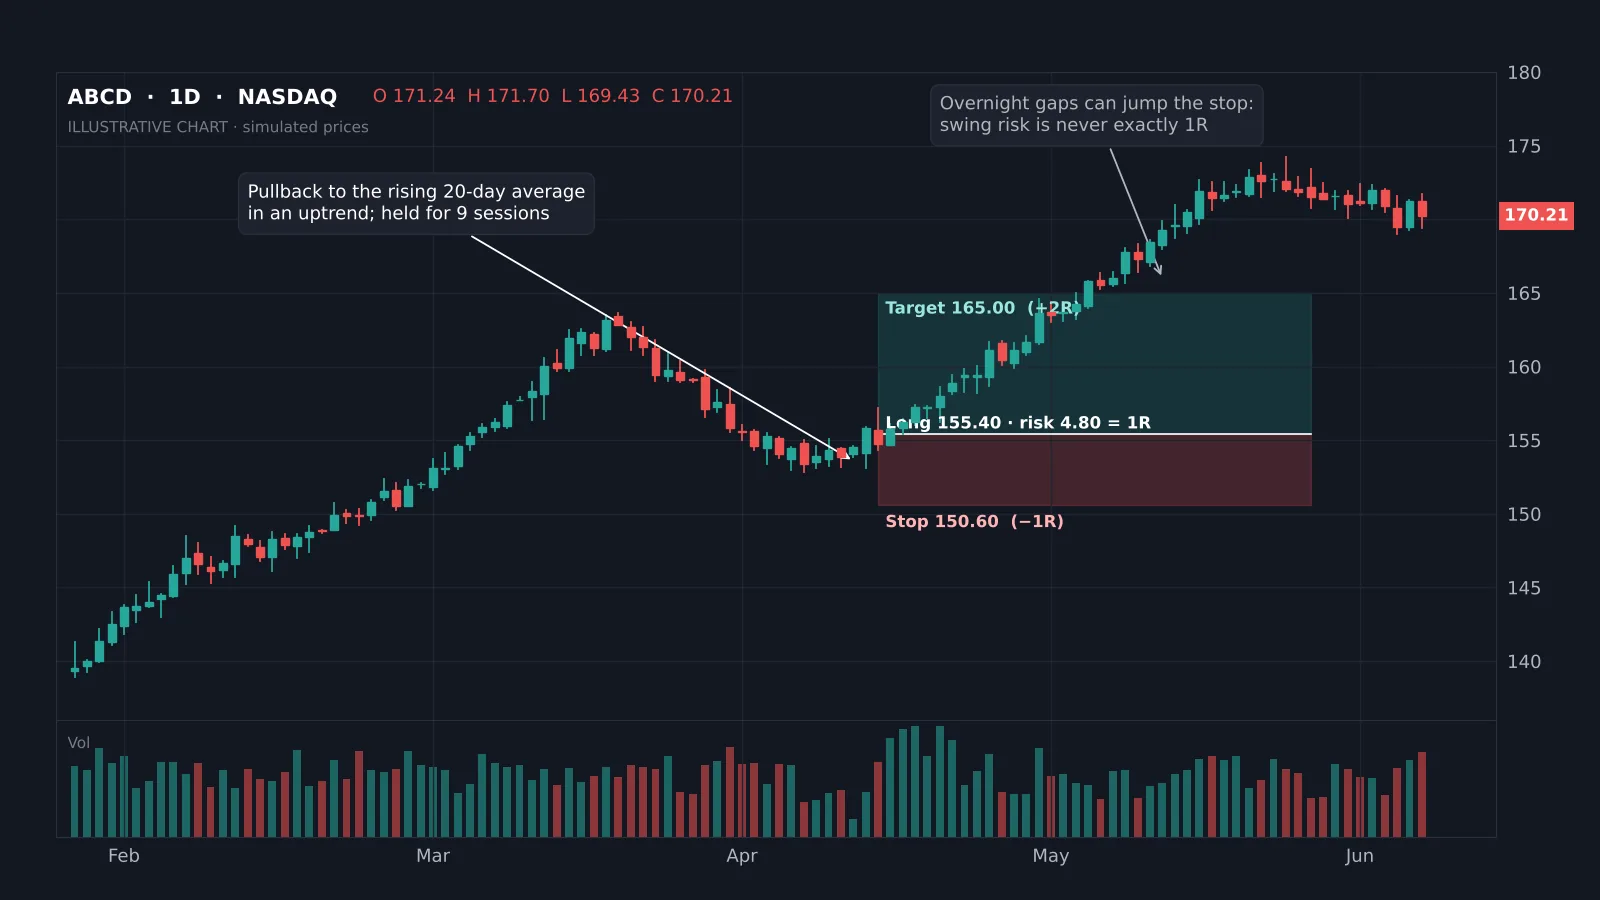
A typical swing setup is a pullback in an uptrend. The stock above makes higher highs and higher lows on the daily chart, pulls back toward a rising moving average and earlier support, then prints a bullish candle. The entry is 155.40, the stop sits below the pullback low at 150.60, and the target is the prior high near 165. That is risk of 4.80 for a potential 9.60: a 2R trade.
No single trade proves anything. This setup will fail often. It earns money only if, across many examples, the winners are large enough to pay for the losers. Indicators can help find these areas; see our guide to the best indicators for swing trading and to swing points.
Indicators that prove themselves in public.
One engine, four precision tools — the Gold (XAU) Scalper, the institutional Gravity Zone, the Zeno momentum Oscillator, and Zeno Stocks for equities.
How much can you make swing trading?
Returns come from three things: expectancy per trade, risk per trade, and how many trades you take. A trader with +0.2R expectancy who risks 1% and takes 80 trades a year expects about +16% a year before compounding. Doubling the risk doubles the expected return, and also doubles the drawdowns.
| Expectancy | Trades a year | Risk per trade | Expected yearly return |
|---|---|---|---|
| +0.10R | 80 | 1% | about +8% |
| +0.20R | 80 | 1% | about +16% |
| +0.20R | 80 | 2% | about +32%, with double the drawdowns |
| +0.30R | 50 | 1% | about +15% |
| −0.05R | 80 | 1% | about −4% |
These are averages. Even with a real edge, results swing widely from year to year, and some years lose money. Compare them with the 7% to 10% a year a broad index has delivered over the long run with almost no effort; our swing trading vs buy and hold guide covers that comparison in detail.
Why can a profitable strategy still lose for months?
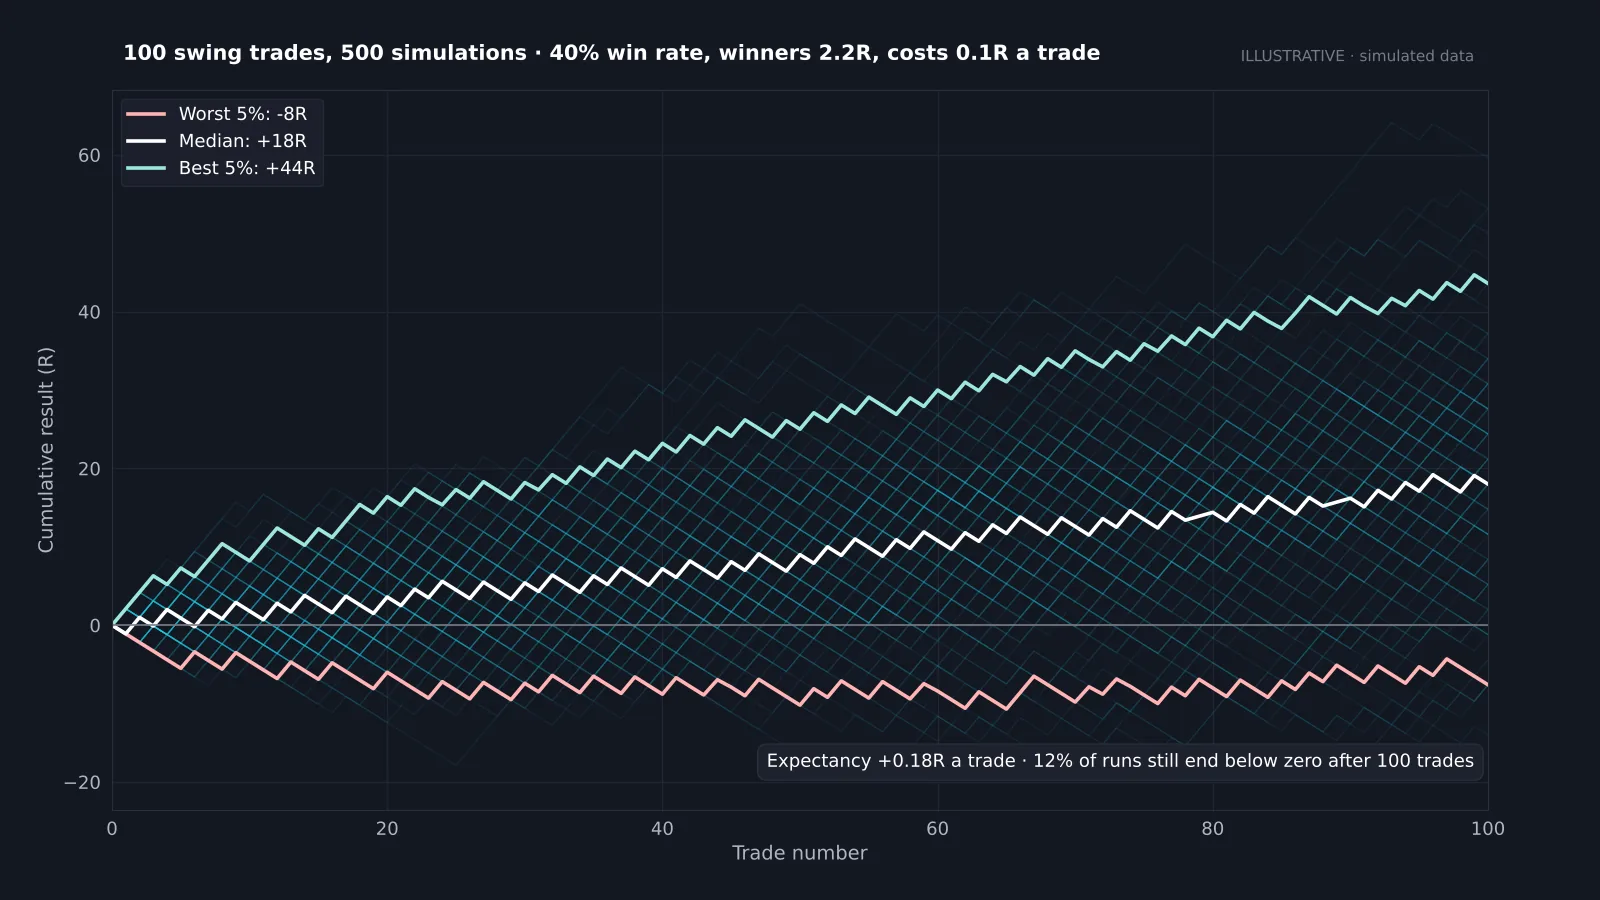
Variance. The chart shows 500 simulated paths of 100 trades from the same strategy: 40% win rate, 2.2R winners, 0.1R costs, +0.18R expectancy. The median path ends near +18R, but the spread is wide, and about 12% of paths are still negative after 100 trades. Losing streaks of eight or more are normal for a 40% win rate.
This is why many traders quit good strategies at the worst time, and keep bad ones after a lucky run. Judge a strategy on a large sample, keep risk per trade fixed so a streak cannot sink you, and avoid sizing systems like the martingale strategy that hide risk until it arrives all at once.
Swing trading expectancy calculator
Enter your win rate, average win and loss in R, costs, risk per trade and trades a year. The calculator shows expectancy, the expected yearly return and the chance of finishing the year below break-even.
The yearly figure is simple (no compounding) and the chance of a losing year uses a normal approximation, so treat both as estimates. Use results from your own trading journal, not hopes.
What costs eat swing trading profits?
- Commissions and spreads. Small per trade, but they come straight off expectancy. On a tight stop, a 0.1R cost is common.
- Slippage on stops. Stops are filled at the next available price, which in fast markets is worse than planned.
- Overnight gaps. Swing trades hold through earnings, news and weekends. A gap can turn a 1R loss into 2R or 3R; read our gap trading guide.
- Financing. Holding CFDs, forex or margin positions overnight costs swap or interest.
- Taxes. In many countries short-term gains are taxed more heavily than long-term investments.
- Time. Scanning, planning and reviewing takes hours a week. It is cheaper than day trading but not free.
Why do most swing traders lose money?
- No measured edge. They trade setups that look good on a few hand-picked charts but were never tested.
- Too much size. Risking 5% to 10% per trade means one normal losing streak halves the account.
- Cutting winners, holding losers. Taking profit at 1R and moving stops away from losers turns a positive payoff into a negative one.
- Trading against the trend. Buying weak stocks because they look cheap.
- Switching systems. Abandoning a strategy after six losses, before its edge can show.
- Ignoring market conditions. Pullback strategies work in trends and struggle in choppy ranges.
Most of these are behaviour, not analysis. A written plan and a fixed risk per trade fix more problems than a new indicator. Our risk management guide covers the rules.
Is swing trading more profitable than day trading?
Not automatically, but it is usually easier to make it work. Swing trades target larger moves, so costs are a smaller share of each trade; there are fewer decisions per week; and it fits around a job. Day trading offers more trades, which lets a real edge compound faster and be measured sooner, but the costs, the noise of intraday charts and the screen time make it harder to sustain.
In the US, the switch from the pattern day trader rule to FINRA's new intraday margin rules changed the account size needed for frequent day trades; see our pattern day trader rule guide. Swing trades held overnight were never affected.
Reference data
| Item | Value |
|---|---|
| Expectancy formula | Win rate × avg win − loss rate × avg loss − costs |
| Example edge | 40% × 2.2R − 60% × 1R − 0.1R = +0.18R |
| Typical holding period | 2 days to several weeks |
| Common risk per trade | 0.5% to 1% of the account |
| Sample size before judging | 100+ trades |
| Barber & Odean: most active traders | 11.4% a year vs 17.9% for the market |
| Brazil day traders persisting 300+ days who lost | 97% |
How do you find out if your swing trading is profitable?
- Write the rules. Market, setup, entry, stop, target, risk per trade. If two people would trade the same chart differently, the rules are not finished.
- Backtest. Run the rules over several years and different market conditions; our backtesting guide explains how to avoid the usual traps.
- Forward-test at small size. Trade it live with 0.25% to 0.5% risk until you have 100 trades.
- Measure. Win rate, average win and loss in R, costs, maximum drawdown and the longest losing streak.
- Compare with buying the index. If the result is not clearly better after costs and time, the index wins.
- Scale slowly. Raise risk only after the live numbers match the backtest.
What tools help swing traders?
You need little: a charting platform with daily and weekly charts, a scanner for setups, a broker with low costs and reliable stop orders, and a journal. TradingView covers charting and alerts for most markets, and is the platform our indicators run on.
Indicators do not create an edge on their own, but they make a rule-based process faster. The free Quantum Algo indicators mark market structure, swing points and liquidity on any timeframe, which helps you apply the same pullback rules the same way every time.
So, is swing trading worth it?
Swing trading is worth it if you enjoy the process, accept that most people lose, and are willing to prove an edge on paper and at small size before scaling. It is not a reliable way to get rich quickly, and for most people a low-cost index fund beats it. The traders who make it work keep risk per trade small and fixed, follow written rules, and measure everything.
Swing trading can be profitable, but research on active retail traders shows most underperform or lose. Profit comes from positive expectancy after costs, not win rate. A 40% win rate with 2.2R winners is about +0.18R per trade. Even a real edge has losing months, so keep risk fixed at about 1% and judge on 100+ trades. Compare your results honestly with simply holding an index.
◆ Interactive check
Could you tell a profitable swing strategy from a losing one?
Questions traders ask about swing trading profits
Rarely at first. Beginners usually lack a tested strategy and size positions too large. Start with paper trading or very small risk while you build and measure a process.
There is no fixed minimum. You need enough that 1% risk per trade still covers commissions and a sensible stop; many people start with $2,000 to $10,000.
There is no single good number. 35% to 55% is common; what matters is that average winners are large enough relative to losers to give positive expectancy after costs.
Yes. That is its main advantage. Most work is done on daily charts in the evening, with orders placed in advance.
It varies enormously. A realistic edge risking 1% per trade might average 10% to 20% a year with large swings between years; most traders make less than an index fund.
Not for most people. Index investing is cheaper, takes little time and has beaten most active traders. Swing trading only makes sense if your measured results are clearly better.
It is gambling when done without a tested edge and fixed risk. With positive expectancy and disciplined sizing it is a business with uncertain results.
Liquid stocks, ETFs, major forex pairs, indices and large crypto coins. Liquidity keeps costs low and makes stops more reliable.
References & Related Guides
Read next
- Swing Trading Strategies
- Day Trading vs Swing Trading
- Swing Trading vs Buy and Hold
- Best Indicators for Swing Trading
- Martingale Strategy
- Backtesting a Trading Strategy
- Trading Journal
- Risk Management
- Pattern Day Trader Rule
- Myfxbook Review