Swing Trading vs Buy-and-Hold: Can Swing Trading Beat the S&P 500? The Honest Arithmetic
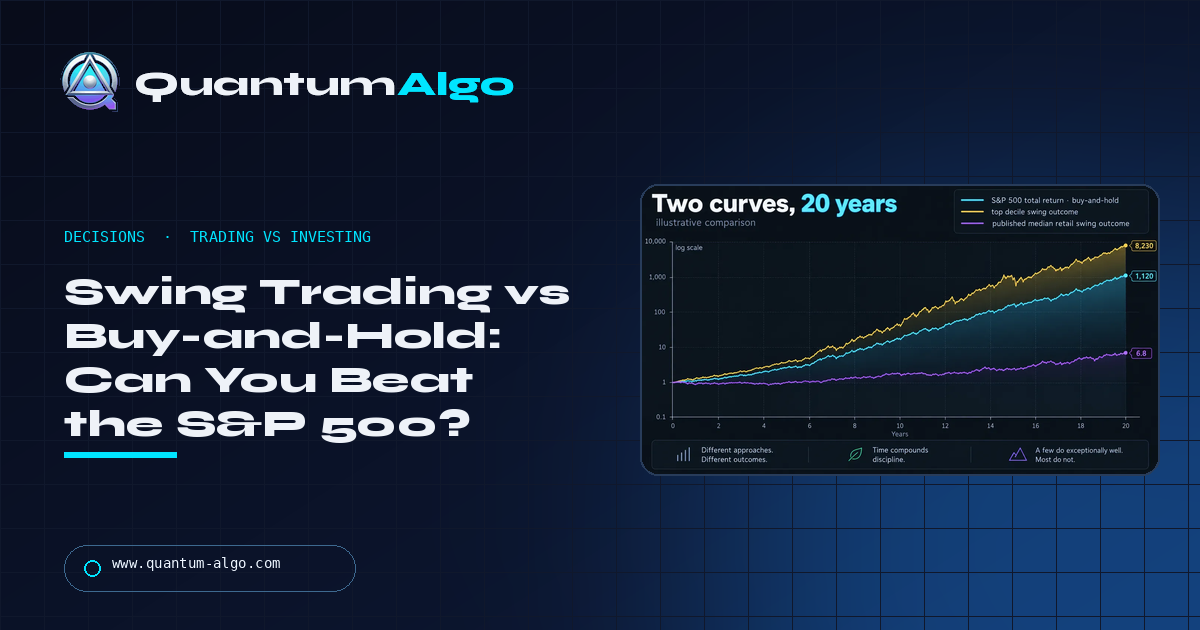
A small minority of swing traders beat the S&P 500 over multi-year periods; the published evidence says most do not, and those who do work far harder than the index does. The index returns about 10% a year with no effort; a swing trader has to beat that after short-term taxes, costs and hours — a hurdle nearer 15% — with an edge that holds across regimes. The honest answer most people reach is both: an index core and a swing slice sized to the edge they have actually proven.
Written by someone who swing trades and holds an index fund at the same time, because that is where the arithmetic leads. This page plots the three paths over twenty years, builds the hurdle a swing trader has to clear, compares the hours and the drawdowns, and puts trading and investing side by side in one table. The calculator below runs your own split — index core plus a swing slice at your measured expectancy — against either path alone.
Indicators that prove themselves in public.
One engine, four precision tools — the Gold (XAU) Scalper, the institutional Gravity Zone, the Zeno momentum Oscillator, and Zeno Stocks for equities.



Can swing trading beat the S&P 500?
A small minority of swing traders beat the S&P 500 over multi-year periods; the published evidence says most do not, and the ones who do work far harder for it than the index does. The index's long-run total return is around 10% a year with no effort and one drawdown you have to sit through per cycle. A swing trader has to beat that after short-term taxes, spreads and commissions, and the hours — a hurdle nearer 15% a year — with a strategy that has a documented edge across regimes. This page runs the arithmetic honestly: the two curves over twenty years, what the swing trader actually has to beat, the time and the drawdown each path demands, and who each path is right for. It is written by someone who swing trades and holds an index fund at the same time, which is the answer most people end up at.
Two curves, twenty years
The curve illustration in this guide plots three paths on a log scale: the S&P 500 total return with dividends reinvested, a swing trader at the top decile of the published distribution, and a swing trader at the published median retail outcome. The index compounds steadily and finishes far above where it started. The top-decile swing trader finishes above the index, with a bumpier ride and years of underperformance inside it. The median swing trader finishes below where they started, because the median retail trading outcome — documented in every broker disclosure and academic dataset we have — is a loss.
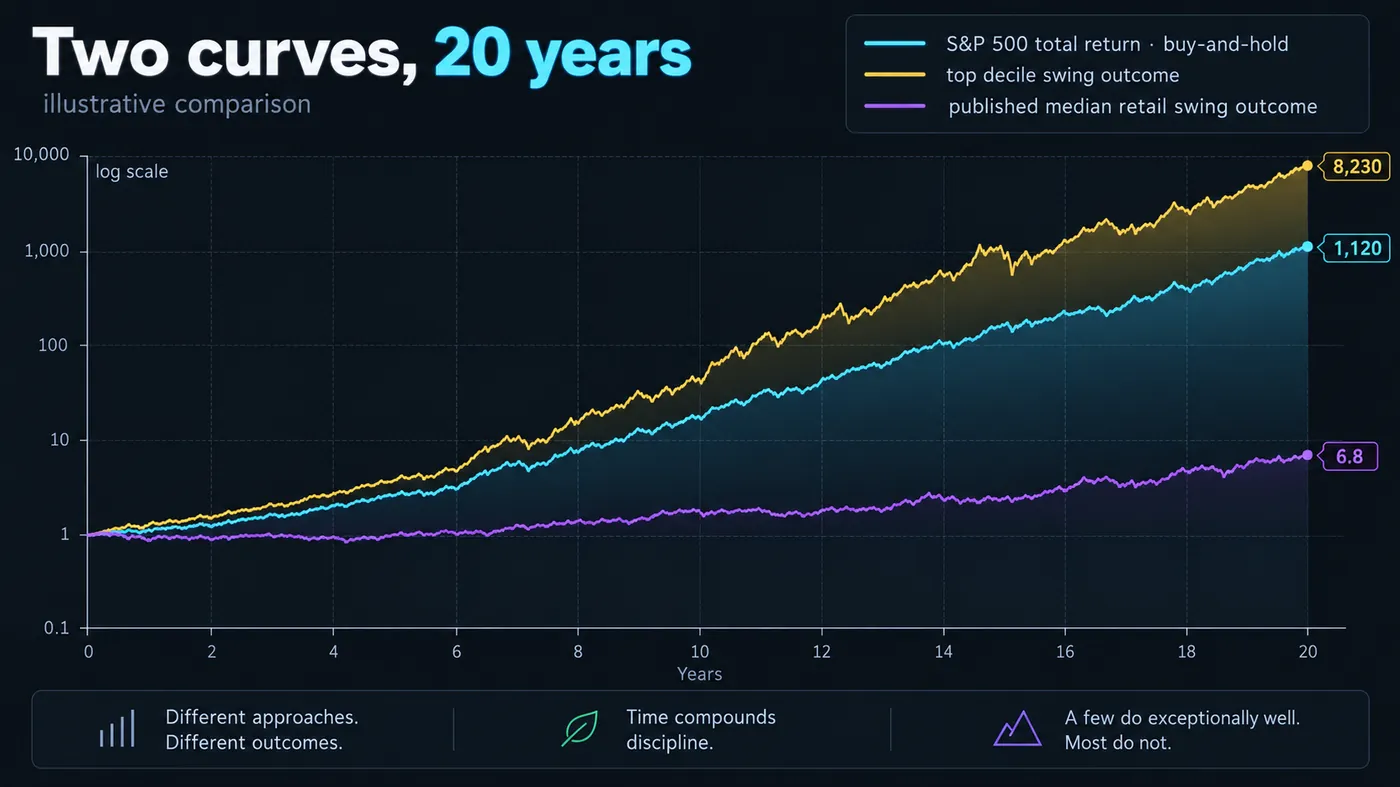
The picture is not "trading is bad and indexing is good". It is that the index is the default the trader has to beat, and the median trader does not; the question is whether you can be in the top decile, and what it costs to find out.
What the swing trader has to beat
The stacked-bar illustration in this guide builds the hurdle. Start with the index's long-run return, roughly 10% a year nominal. Add short-term capital gains tax, which in most jurisdictions taxes trades held under a year at ordinary income rates rather than the lower long-term rate — a 5-point drag at typical brackets. Add spread and commissions — one to two points a year for an active swing trader. Add the time value of the hours: 300 hours a year that could be earning elsewhere, worth a point or two on a small account and nothing on a large one. The hurdle is around 15% a year, every year, on average across bull and bear markets — and the index clears its 10% while you sleep.
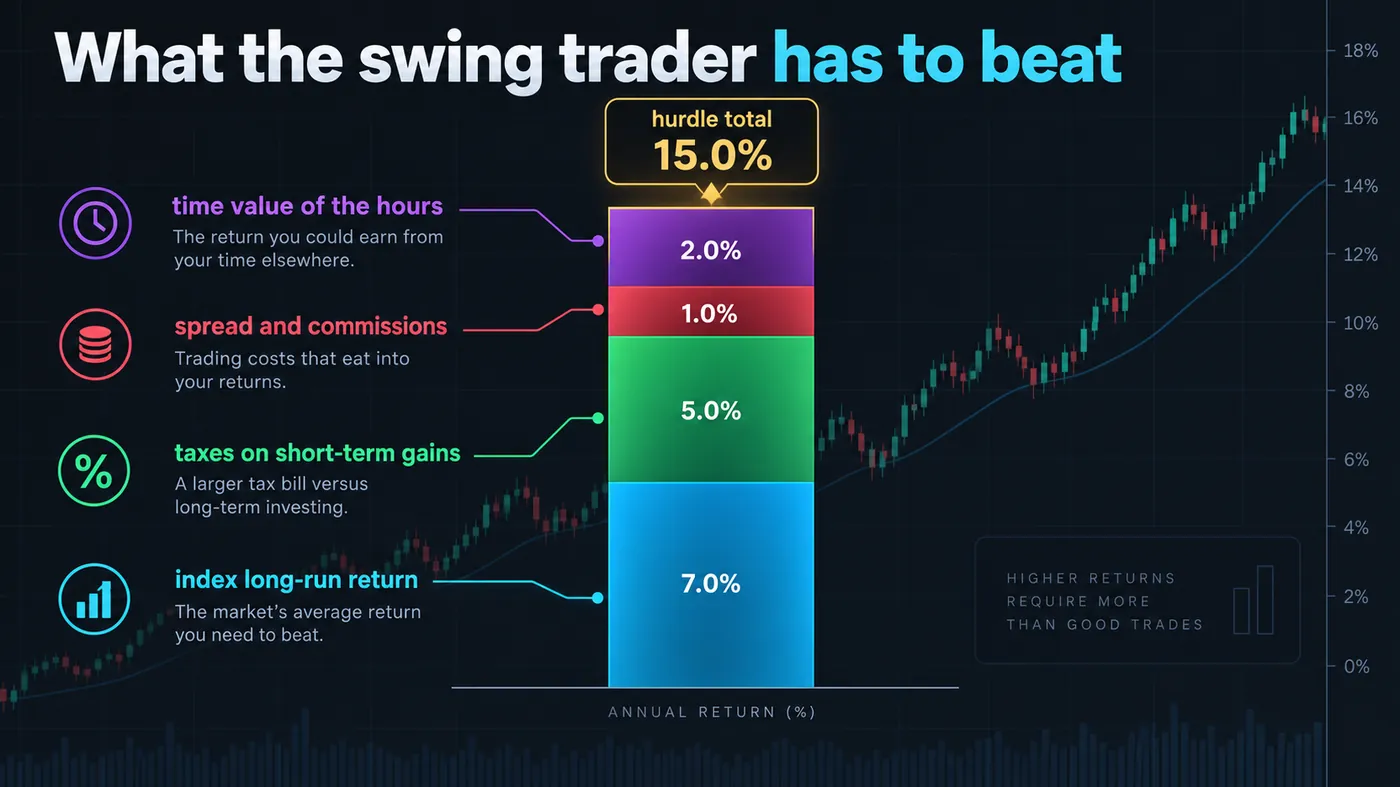
That is the honest bar. A swing strategy with a 0.5R expectancy, 1% risk and three trades a week produces roughly 15–20% a year before costs if the edge holds — so a genuinely good swing trader clears the bar, narrowly, and a merely decent one does not.
Time and drawdown
The two-chart illustration in this guide compares the paths on what they cost besides money. Hours per year: buy-and-hold about five (rebalance, ignore the news), swing trading about 300 (a check at the daily close, weekend review, occasional session), day trading about 1,500. Maximum drawdown: the index has fallen 35–55% in its worst episodes and recovered every time; a swing trader with fixed 1% risk sees 15–25% drawdowns routinely and, unlike the index, has no guarantee of recovery, because the drawdown may mean the edge is gone rather than that the market is temporarily down.
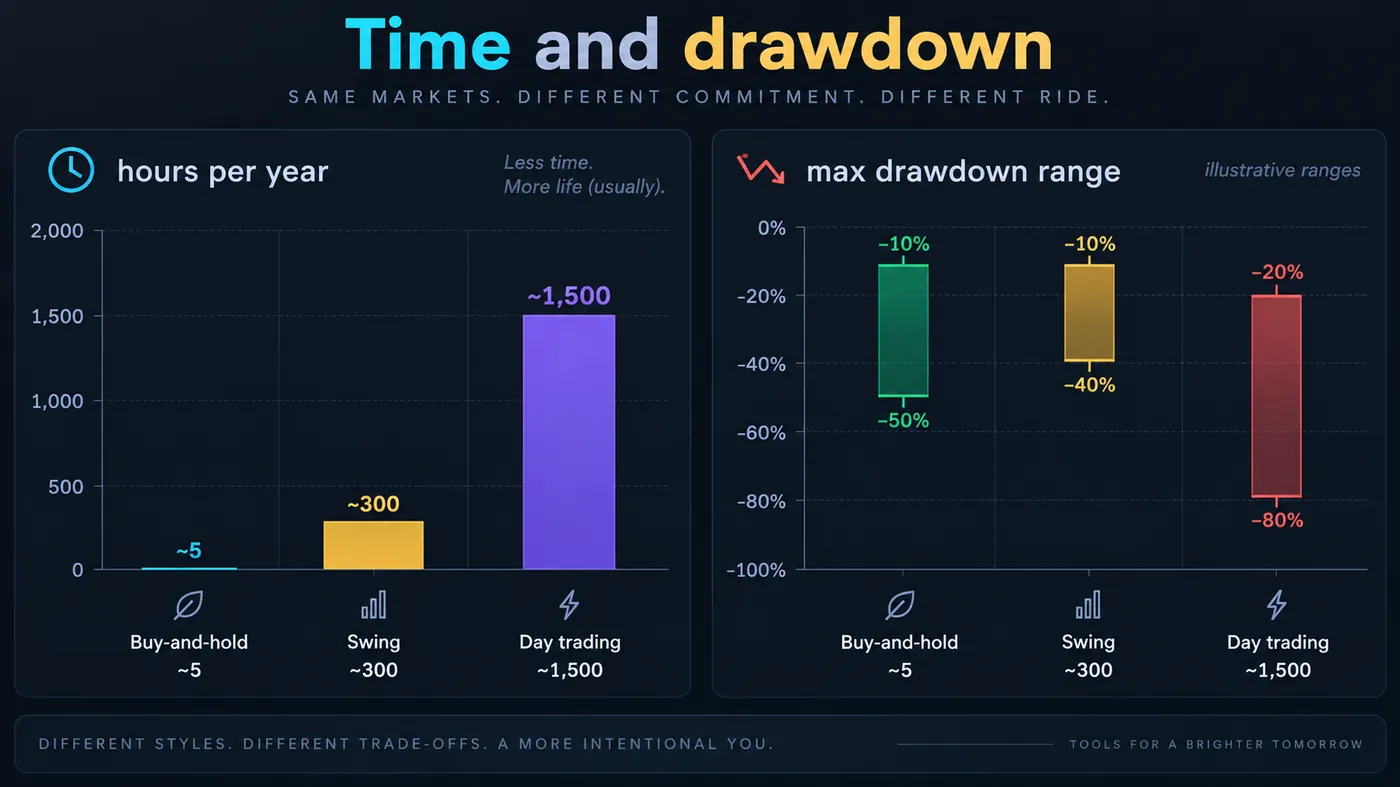
The comparison beginners miss: the index's drawdown is the price of a return that has always come back; the trader's drawdown is a signal that has to be interpreted.

Automate your trades. Let Quantum Algo trade for you.
Every signal executed on your own account — on your account, with the plan you define.
Trading vs investing: the difference in one table
| Buy-and-hold (index) | Swing trading | |
|---|---|---|
| Decision | Once, then stay | Every trade |
| Expected return | ~10% a year, decades of evidence | Unknown until measured; median retail negative |
| Tax | Long-term rates, deferred until sale | Short-term rates, every year |
| Costs | Near zero | Spread, commissions, data, tools |
| Hours | ~5 a year | ~300 a year |
| Drawdown | 35–55% in crises, always recovered so far | 15–25% at fixed risk; recovery depends on the edge |
| Skill required | None | A documented edge, sizing, a journal |
| Failure mode | Selling at the bottom | Losing the edge and not noticing |
Who each path is right for
Buy-and-hold is right for money you will not touch for a decade, for the part of your capital that is not tuition, and for anyone who has not yet proven an edge. Swing trading is right for a trader with fifty logged trades showing a stable expectancy, capital large enough that 15% is worth 300 hours, and the temperament to sit through a 20% drawdown without changing the rules. The two are not exclusive: most profitable retail traders we know hold an index fund with the majority of their capital and swing trade a defined slice — which is also the arrangement that keeps a losing year from being a life event.
The case for doing both
The compounding calculator on this page lets you set the split: what fraction of capital goes to the index, what fraction to a swing account at your measured expectancy, and what the combined curve looks like over twenty years against either path alone. The result most people find is that a 70/30 or 80/20 split with a genuine edge beats the index by a small margin with much lower variance than trading everything — and that with no edge, the split loses only the slice, not the whole.
Where Smart Money swing trading sits
Zeno's regime labels on the 2-hour and 4-hour charts are built for the swing timeframe — holds of days to weeks, managed at candle closes — and the public record of those calls (160 trades, 120 wins, 40 losses at the stated levels) is the kind of evidence a swing trader needs before deciding to allocate a slice away from the index. It is a record of signals, not of your execution, which is why the roadmap asks for fifty of your own logged trades before any of this matters.
The index is the default and the median trader does not beat it. Clearing the hurdle takes a documented edge, capital large enough that 15% is worth 300 hours, and the temperament for a 20% drawdown with no promise of recovery. The honest arrangement is an index core and a swing slice sized to the edge you have actually measured — and the slice is where Zeno's signals belong.
◆ Interactive check
Do you know the hurdle?
Questions people ask about trading versus investing
For most people, no; for a minority with a documented edge, it can beat the index after costs, narrowly, with much more work. The honest arrangement is an index core and a swing slice sized to the edge you have proven.
No clean figure exists; broker disclosures put 65–82% of retail accounts in loss over a year, and studies of active traders put consistent market-beaters in the low single digits to low teens depending on the definition and period.
Harder than with swing trading: more trades, more costs, more hours, the pattern day trader rule, and a worse published distribution. Our "is day trading worth it" guide has the numbers.
A documented 0.5R edge at 1% risk and three trades a week is roughly 15–20% before costs; that is the good case. The median case is a loss. The number scales with capital, not with effort.
Beginners should swing trade the most liquid instruments — index ETFs or futures, major forex pairs, gold — where spreads are tight and structure is clean; individual stocks add earnings gaps and halts.
Yes — Zeno's 2-hour and 4-hour regime labels are the swing timeframe, and the public record is mostly swing setups. The free indicators mark the same structure.
For most people and most of their money, invest; for a proven edge and a slice of capital, trade. The evidence for the index is decades long; the evidence for your edge has to be your own fifty logged trades.
A minority do, with a documented edge, and ETFs are the right instrument to try it on — tight spreads, no earnings gaps, clean structure. The hurdle is still the index plus taxes plus costs.
Trades held under a year are taxed as ordinary income in most jurisdictions, every year, rather than at long-term rates on sale. That alone is a 3–7 point drag at typical brackets and the largest part of the hurdle.
A documented 0.5R edge at 1% risk and three trades a week is roughly 15–20% a year before costs — the good case. The median case is negative. It scales with capital, not effort.
References & Related Guides
Read next
- Is Day Trading Worth It?
- Swing Trading Strategies
- How to Start Trading: 90-Day Roadmap
- Fundamental vs Technical Analysis
- Intraday vs End-of-Day Trading
- What Is Trading?
- Monte Carlo Simulation for Trading
- Quantum Algo Track Record
Authoritative sources
- SEC Investor.gov: investing basics (long-term returns)
- S&P Dow Jones Indices: SPIVA (active vs passive scorecards)
- Chague, De-Losso & Giovannetti: "Day Trading for a Living?" (SSRN)
- ESMA: retail loss-rate disclosures
- IRS: capital gains and losses (short- vs long-term)