Forex Chart Patterns: The Six That Actually Print, and the Structure Behind Them
The forex chart patterns that appear often enough to trade are head and shoulders, double tops and bottoms, flags, triangles, wedges and — on higher timeframes — the cup and handle. They are reliable in forex for the same reason they fail there: liquidity concentrates at the obvious levels a pattern draws, so the neckline or the double top is exactly where stops sit, and the "breakout" a beginner trades is often the sweep that takes them. Trade the structure the pattern is made of — the liquidity, the sweep, the order block — not the shape.
A pattern is a shape; the trade is in what the shape is made of. This page shows the six patterns as they print on real pairs and timeframes, then reads the same charts the Smart Money way — equal highs as liquidity, the breakout as the sweep, the last down-close as the order block — so the entry moves to the retest and the stop moves beyond the sweep. A GBP/USD chart shows the failure everyone has traded, and the translator below converts any classic pattern into its structure, stop and target.
Indicators that prove themselves in public.
One engine, four precision tools — the Gold (XAU) Scalper, the institutional Gravity Zone, the Zeno momentum Oscillator, and Zeno Stocks for equities.



What are the most reliable forex chart patterns?
The forex chart patterns that appear often enough to trade are head and shoulders, double tops and bottoms, flags, triangles, wedges and — on higher timeframes — the cup and handle. They are reliable in forex for the same reason they fail there: the market's liquidity concentrates at the obvious levels a pattern draws, so the neckline, the double top, the flag's boundary are exactly where stops sit, and the "breakout" a beginner trades is often the sweep that takes them. This guide teaches the six patterns as they print on real pairs and timeframes, then shows the Smart Money reading of each — the liquidity, the sweep, the order block — so you trade the structure the pattern is made of rather than the shape.
If you are still learning to read a forex chart at all — candles, timeframes, the session clock — start with the Academy's candlestick lesson and the forex beginners guide; this page assumes you can read a candle and want to know what the shapes mean.
The six patterns that actually print on forex
The 3×2 grid in this guide shows each on a labelled pair and timeframe with the classic entry, stop and target:
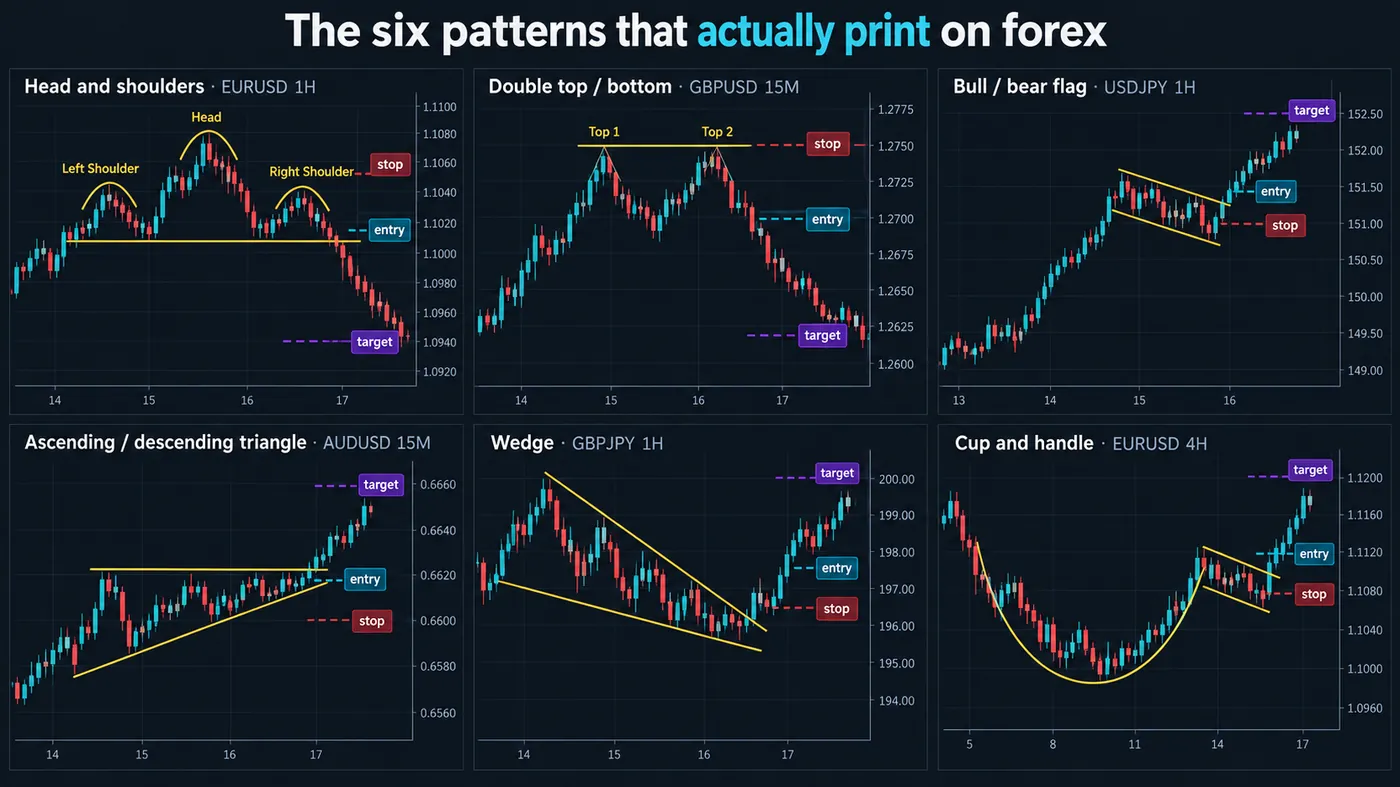
- Head and shoulders (EUR/USD 1H) — three peaks, the middle highest, a neckline joining the troughs. Classic: short the neckline break, stop above the right shoulder, target the head-to-neckline distance. Inverse for bottoms. In forex it prints most cleanly at the end of a London or New York trend.
- Double top / double bottom (GBP/USD 15M) — two touches of the same level with a trough between. Classic: trade the break of the trough, target the pattern height. The most common forex pattern and the one most often swept.
- Bull / bear flag (USD/JPY 1H) — a sharp move (the pole) then a tight counter-trend channel (the flag). Classic: trade the break in the pole's direction, target the pole's length. Continuation; the pole is the displacement.
- Ascending / descending triangle (AUD/USD 4H) — a flat top with rising lows (or the reverse). Classic: trade the flat side's break. The flat side is a row of equal highs — liquidity, in SMC terms.
- Rising / falling wedge (GBP/JPY 1H) — converging lines both sloping the same way; rising wedges break down, falling wedges break up. The convergence is momentum fading.
- Cup and handle (EUR/USD 4H) — a rounded base and a small pullback, then the break. Rarer on forex than on stocks; only meaningful on 4H and above after a prior uptrend. Our cup-and-handle guide covers the rules.
Pattern versus structure: the same chart, two readings
The side-by-side illustration in this guide is the heart of the page. The left panel annotates an EUR/USD 1-hour chart the classic way: neckline, breakout, measured move. The right panel annotates the identical candles the Smart Money way: the two peaks are equal highs — a pool of stops above them; the "breakout" candle is the sweep that took those stops; the bar that follows is the change of character; the last down-close before the drop is the order block that becomes the retest entry; the target is the liquidity below the trough.
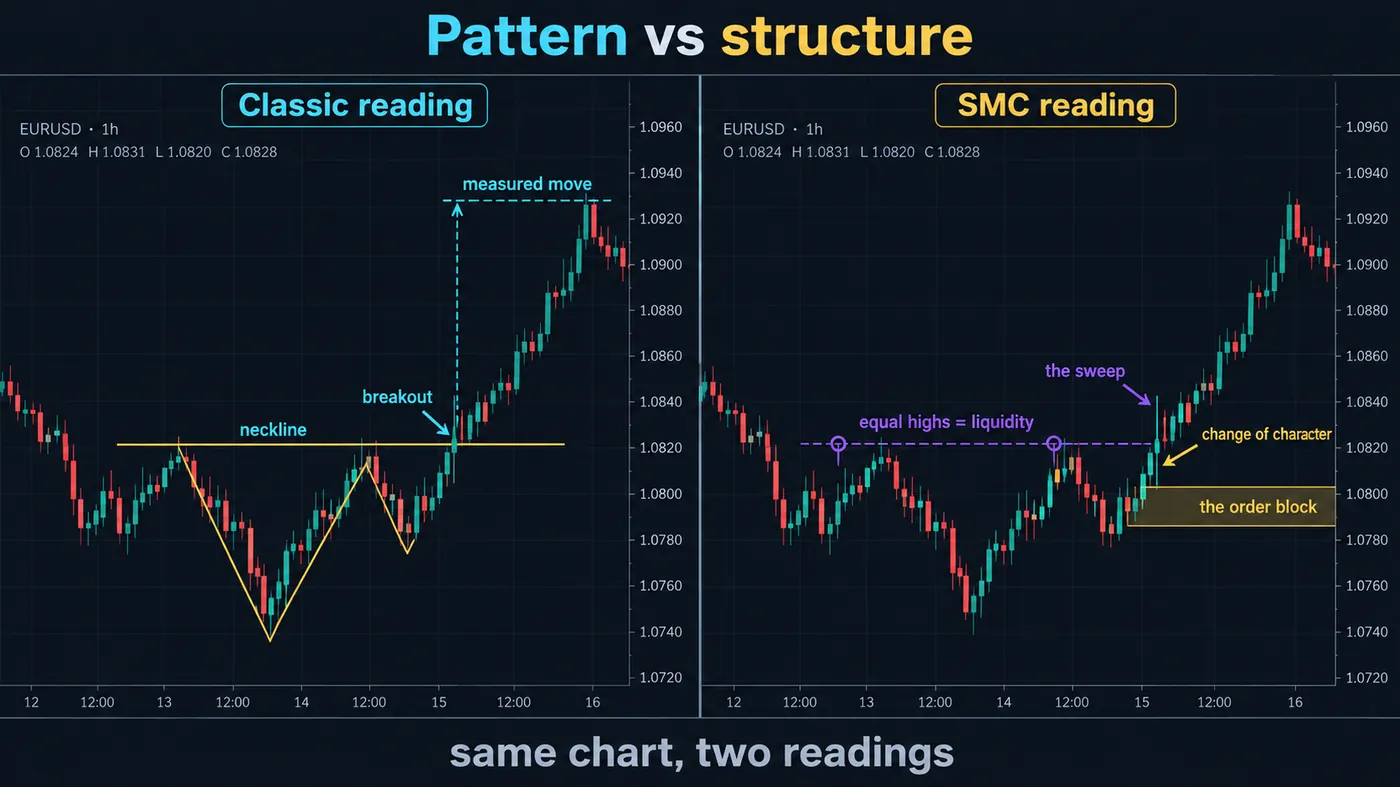
The two readings do not contradict each other — they describe the same institutional behaviour from different angles — but they produce different trades. The classic reading enters on the neckline break with a stop above the shoulder, which puts the stop exactly where the sweep is aimed. The structure reading waits for the sweep, enters on the retest of the order block, and puts the stop beyond the sweep's extreme — a smaller stop, a later entry, a far better fill.

Automate your trades. Let Quantum Algo trade for you.
Every signal executed on your own account — on your account, with the plan you define.
Where patterns fail in forex
The GBP/USD 15-minute chart in this guide is the failure everyone has traded: a textbook double top forms through the Asian session, breaks down at 07:00 UTC, the short is entered on the break — and at the London open the "breakdown" reverses violently, because the double top's neckline was where the Asian-session stops were, and London swept them before the real move. The callout says it: the pattern was the liquidity.
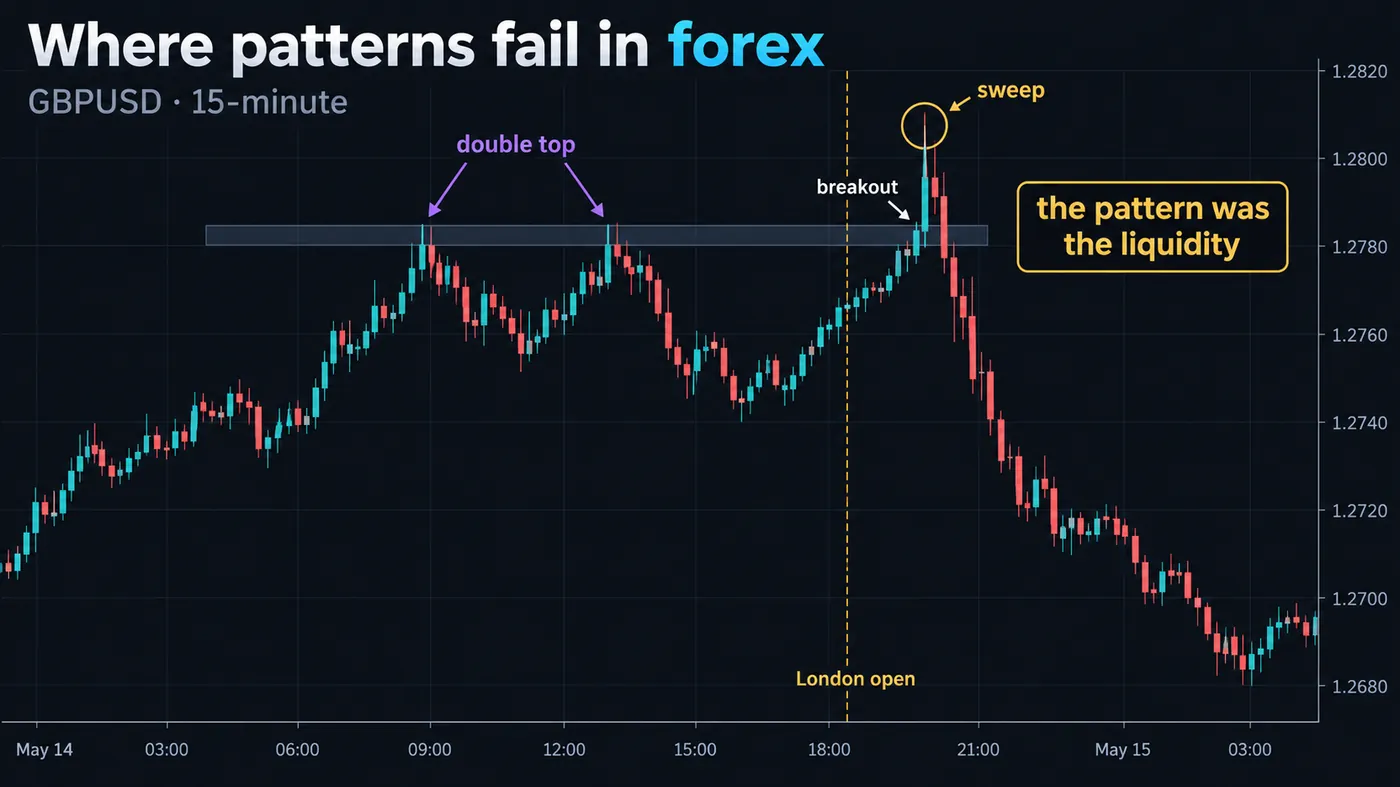
Three rules follow. First, in forex, session context outranks pattern: a pattern completed in Asian hours is a pattern about to be tested by London. Second, the pattern's obvious stop level is the trade's problem, not its solution; if your stop is where everyone's stop is, expect it to be swept. Third, the pattern's break is the beginning of the information, not the end — wait for the retest, or for the sweep-and-reclaim, before committing.
Reading a forex chart: what the patterns sit on
For readers who searched "how to read forex charts", the short version the patterns depend on:
- Candles — open, high, low, close; the body is the session's conviction, the wicks are the rejection. The Academy candlestick lesson covers every pattern of a single bar.
- Timeframes — the 4-hour and daily set the bias; the 1-hour and 15-minute give the entry. A pattern on the 15-minute against the 4-hour trend is a pullback, not a reversal.
- Sessions — the chart's behaviour changes at 08:00 UTC and 13:00 UTC. Mark the Asian range on every intraday chart; most forex patterns are built inside it and resolved outside it.
- Levels — previous day's high and low, session highs and lows, equal highs and lows. These are where patterns form because they are where orders sit.
- Spread — invisible on the chart, real on the ticket: a 15-minute pattern on a pair with a 2-pip spread has a different risk than the same pattern on EUR/USD at 0.2 pips.
Our free indicators mark structure, sessions and liquidity on the chart so that reading is not done by hand; the candlestick patterns PDF is the printable reference for the bar-level shapes.
The translation, pattern by pattern
| Classic pattern | What the structure reader sees | Where the entry moves to | Where the stop moves to |
|---|---|---|---|
| Double top | Equal highs = liquidity; the break is the sweep | Retest of the order block after the change of character | Beyond the sweep's high |
| Head and shoulders | Shoulders = equal-ish highs; head = the sweep of them | Retest of the last down-close before the neckline break | Above the head |
| Bull flag | Pole = displacement; flag = the return to the order block / FVG | The order block at the flag's base | Below the flag's low, not inside it |
| Ascending triangle | Flat top = row of equal highs; rising lows = demand climbing | After the sweep of the flat top and a reclaim, or on the retest | Beyond the sweep |
| Rising wedge | Momentum fading into liquidity above | After the sweep of the wedge's high and a change of character | Above the sweep |
| Cup and handle | Rounded accumulation; handle = the last pullback to demand | Retest of the handle's low (the order block) | Below the handle |
The pattern-to-structure tool on this page returns this translation for any pattern with the stop and target rules.
Trading a forex pattern step by step
- Bias from the 4-hour. Direction first; patterns against it are pullbacks.
- Find the pattern on the 1-hour or 15-minute and mark the obvious level it draws — neckline, flat side, flag boundary.
- Mark the liquidity that level implies: the stops above the double top, below the flag.
- Wait for one of two triggers: a sweep of that liquidity followed by a reclaim, or a clean break followed by a retest of the order block that caused it.
- Enter on the retest, stop beyond the sweep or the block, target at the next liquidity (the measured move is a fair proxy).
- Respect the session: no new pattern trades in the Sydney hours; expect London to test anything built overnight.
- Log it — which pattern, which reading, which trigger — and after fifty, keep the triggers that pay.
Six patterns print on forex often enough to trade, and all six are made of the same three things: liquidity at the obvious level, the sweep that takes it, and the order block that starts the real move. Read them that way — enter on the retest, stop beyond the sweep, respect the session — and the same patterns that stop out the classic trader pay the structure trader.
◆ Interactive check
Shape or structure?
Questions people ask about forex chart patterns
No pattern is profitable on its own; the bull flag and the double top/bottom are the most frequent, and both pay only when traded from the structure reading — retest entries, stops beyond the sweep — rather than on the break.
They describe real institutional behaviour, so yes — but the classic entry and stop rules put the stop where forex liquidity gets swept. Read them as structure and the same patterns work far better.
The 4-hour for bias and the cleanest shapes, the 1-hour and 15-minute for entries. Patterns on the 5-minute chart are noise outside the London and New York sessions.
Our candlestick patterns PDF covers the bar-level shapes; the six chart patterns on this page are on the grid illustration, which you can save. The translation table above is the part worth printing.
Candles, timeframes, sessions, levels and spread — in that order. The Academy's candlestick lesson and the forex beginners guide cover the first two; this page assumes them and adds the patterns.
The indicators mark the structure the patterns are made of — equal highs and lows, sweeps, order blocks, imbalances, changes of character — rather than the named shapes. That is deliberate: the structure is what you trade.
The double top or bottom — two touches of a level, which in forex is usually a row of equal highs or lows with stops behind it. It is also the pattern most often swept, which is why the structure reading matters more here than on any other.
No. Candlestick patterns are one to three bars (doji, engulfing, hammer); chart patterns are shapes across dozens of bars (flags, triangles, head and shoulders). Our candlestick guide and PDF cover the first; this page covers the second.
Candles, then timeframes, then sessions, then levels, then the spread — in that order. The Academy's candlestick lesson and the forex beginners guide teach the first two; this page assumes them and adds the patterns and the structure behind them.
Only inside the London and New York sessions, and only read as structure. Outside those hours a 5-minute pattern is noise built on thin liquidity that London will test.
References & Related Guides
Read next
- How to Read Candlestick Charts (Academy)
- Forex Trading for Beginners
- Candlestick Patterns Cheat Sheet + PDF
- Cup and Handle Pattern
- Liquidity Sweep Trading
- BOS & CHoCH: Market Structure
- Forex Market Hours
- Best Forex Pairs to Trade
Authoritative sources
- Investopedia: introduction to chart patterns
- CME Group: technical analysis education
- CFA Institute: technical analysis (refresher reading)
- BIS: FX turnover by session (why liquidity concentrates)
- Bank of England: London FX market