Island Reversal Pattern: How to Spot and Trade It
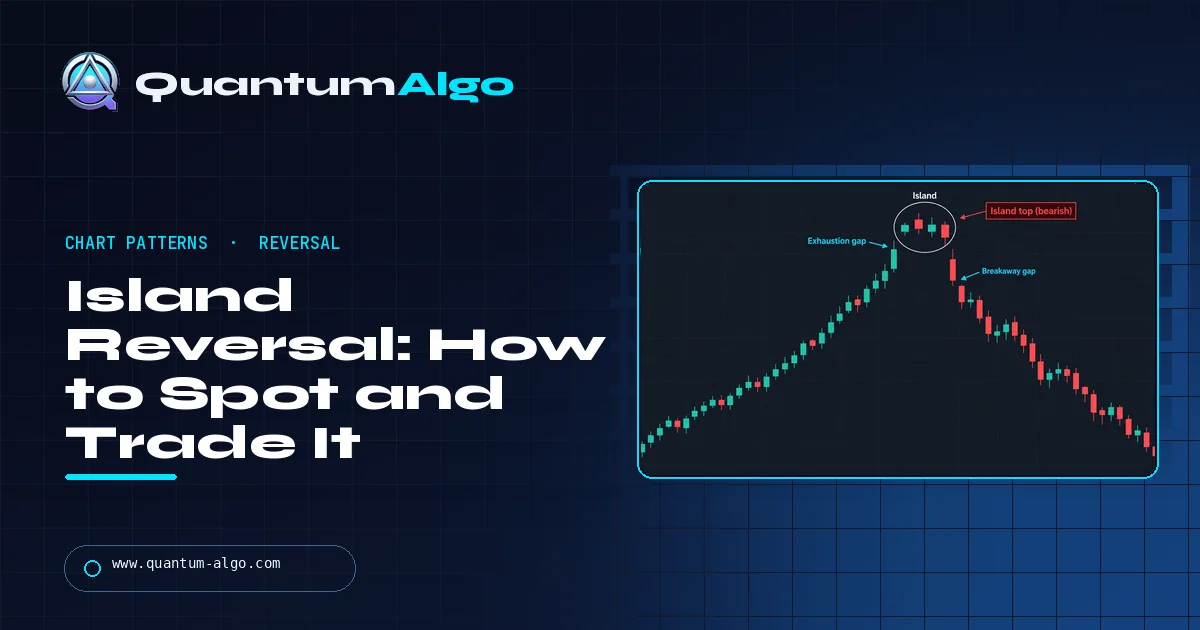
An island reversal is a chart pattern in which price gaps in the direction of the trend, trades for one or more bars in an isolated cluster, then gaps back the other way, leaving that cluster cut off by gaps on both sides like an island. An island top (after an uptrend, with a gap up and then a gap down) is bearish; an island bottom (after a downtrend, with a gap down and then a gap up) is bullish. It signals that traders who chased the first gap are trapped. It is rare and works best on daily stock and index charts with real gaps; traders usually enter after the second gap, place the stop beyond the island and watch whether the gap holds.
Gaps are the loudest thing a chart can do, and an island reversal is two of them back to back. The first gap pulls in the latecomers; the second gap leaves them stranded on the wrong side of the market. This guide shows how island tops and bottoms form, which conditions separate a real island from noise, how traders enter and manage the trade, where the pattern fails and which markets it suits. A checker below tells you whether the prices you see form a valid island.
Indicators that prove themselves in public.
One engine, four precision tools — the Gold (XAU) Scalper, the institutional Gravity Zone, the Zeno momentum Oscillator, and Zeno Stocks for equities.
What is an island reversal?
An island reversal is a price pattern made of three parts: a gap in the direction of the trend, a cluster of one or more bars that trade in isolation, and a gap in the opposite direction. Once the second gap appears, the cluster sits alone on the chart, separated from the bars before and after it by empty space. That isolated cluster is the "island".
It comes in two versions:
- Island top: after an uptrend, price gaps up, trades above the prior bars for a while, then gaps down. It is a bearish reversal pattern.
- Island bottom: after a downtrend, price gaps down, trades below the prior bars, then gaps up. It is a bullish reversal pattern.
The island can be a single bar (sometimes called a one-day island) or a stretch of several days or weeks. What defines it is the gap on each side, not its length. It is one of the classic gap patterns, alongside breakaway, runaway and exhaustion gaps.
How does an island top form?
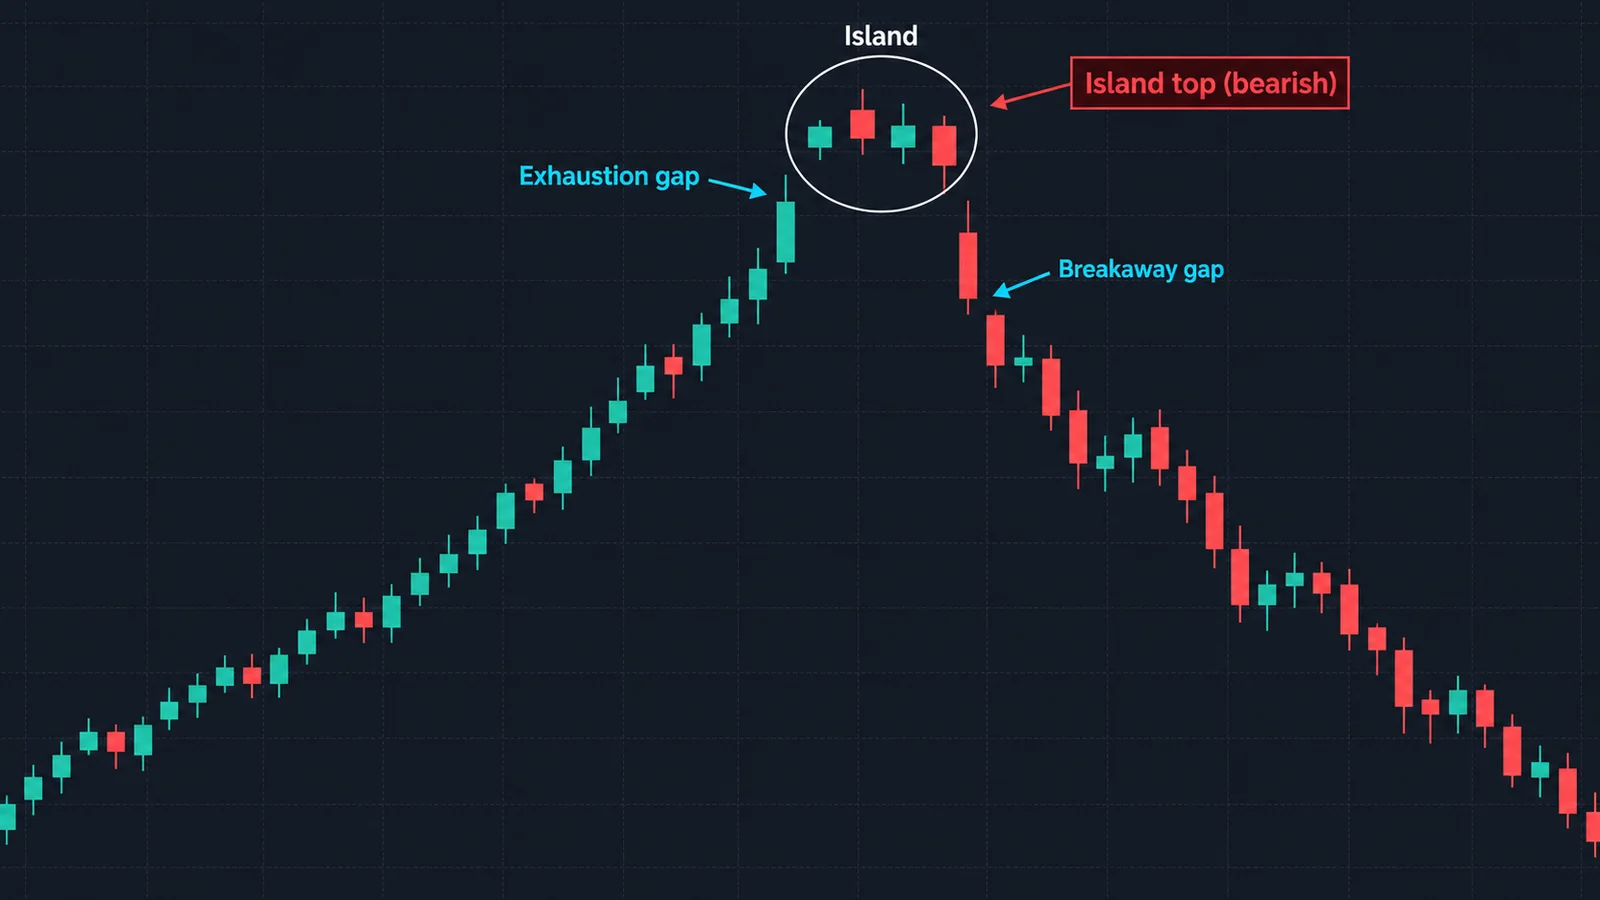
A typical island top develops like this:
- An uptrend matures. Price has risen for weeks and optimism is high.
- An exhaustion gap up. Good news, or simple enthusiasm, makes price open above the previous bar's high. Late buyers pile in.
- The island. Price trades above that gap for a day or more, but makes little progress. Volume is often heavy as early holders sell to the latecomers.
- A breakaway gap down. Price opens below the island's low and does not fill the space. Everyone who bought on the island is now holding a loss, with no trading in between to exit.
That last point is what gives the pattern its force. Trapped buyers become sellers on any bounce back toward the island, which turns the gap area into resistance. The same mechanics, mirrored, drive an island bottom.
How does an island bottom form?
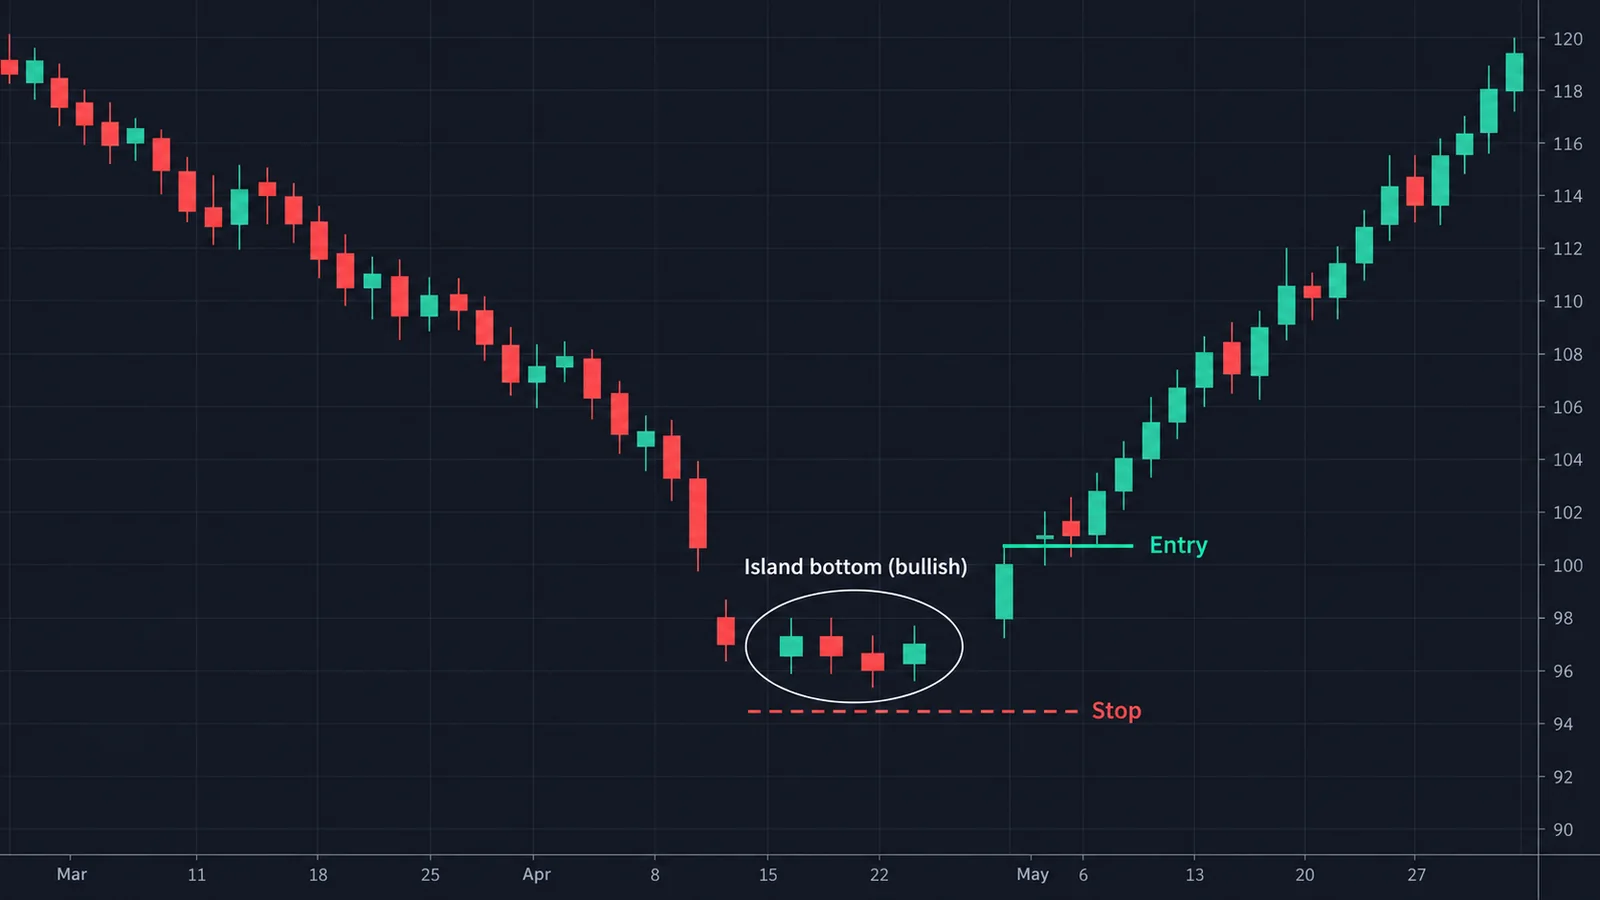
An island bottom is the mirror image:
- A downtrend accelerates into fear.
- A gap down on bad news or capitulation. Late sellers and new shorts enter.
- The island: price trades below the gap, often with high volume as stronger hands absorb the selling, but fails to make much further downside.
- A gap up that leaves the island behind. The shorts and the sellers on the island are now wrong, and their covering adds fuel to the move.
Island bottoms often appear after news-driven sell-offs, such as a bad earnings report that the market quickly decides was overdone.
What makes an island reversal valid?
Many patterns get labelled as islands that are not. Check these conditions:
- Two true gaps. For an island top, the island's lowest low must be above the high of the bar before the first gap, and the bar after the second gap must have its high below the island's low. Any overlap means there is no island. The bottom version is the mirror image.
- A prior trend. A reversal pattern needs something to reverse. An island in a sideways range means little.
- Roughly the same price zone. The two gaps usually occur at similar price levels, which is what makes the island look like an island.
- Volume. Heavy volume on the island and on the second gap adds weight; a second gap on thin volume is easier to fill.
- A real gap market. Gaps only mean something where trading stops overnight: stocks, ETFs and index cash charts. On 24-hour forex or crypto charts, "gaps" usually come from weekends or data quirks, and islands are rare and less meaningful.
Island reversal checker
Enter the high and low of the bar before the first gap, the island's highest high and lowest low, and the high and low of the first bar after the second gap. The checker confirms whether both gaps are real, tells you whether you have an island top or bottom, measures each gap and suggests where a stop would typically go.
How do you trade an island reversal?
Common approaches, from aggressive to conservative:
- Enter on the second gap. Buy (island bottom) or sell (island top) at or soon after the open of the gap bar. This gives the best price but accepts the risk that the gap fills the same day.
- Enter on a retest. Wait for price to pull back toward the gap. If it stalls without filling it, enter in the new direction. Many traders prefer this because the gap edge gives a clear level.
- Enter on a break of structure. Wait for the next swing level to break in the new direction, for example the last higher low after an island top. Later, but more confirmed.
Stops: beyond the island's extreme (above its high for a top, below its low for a bottom) is the textbook placement. A tighter option is the far edge of the second gap: if price trades back into the island, the pattern has failed.
Targets: the pattern has no measured-move rule. Traders use the start of the move into the island (where the prior trend leg began), prior support and resistance, or a multiple of the risk. Trailing a stop behind new swing points lets a strong reversal run.
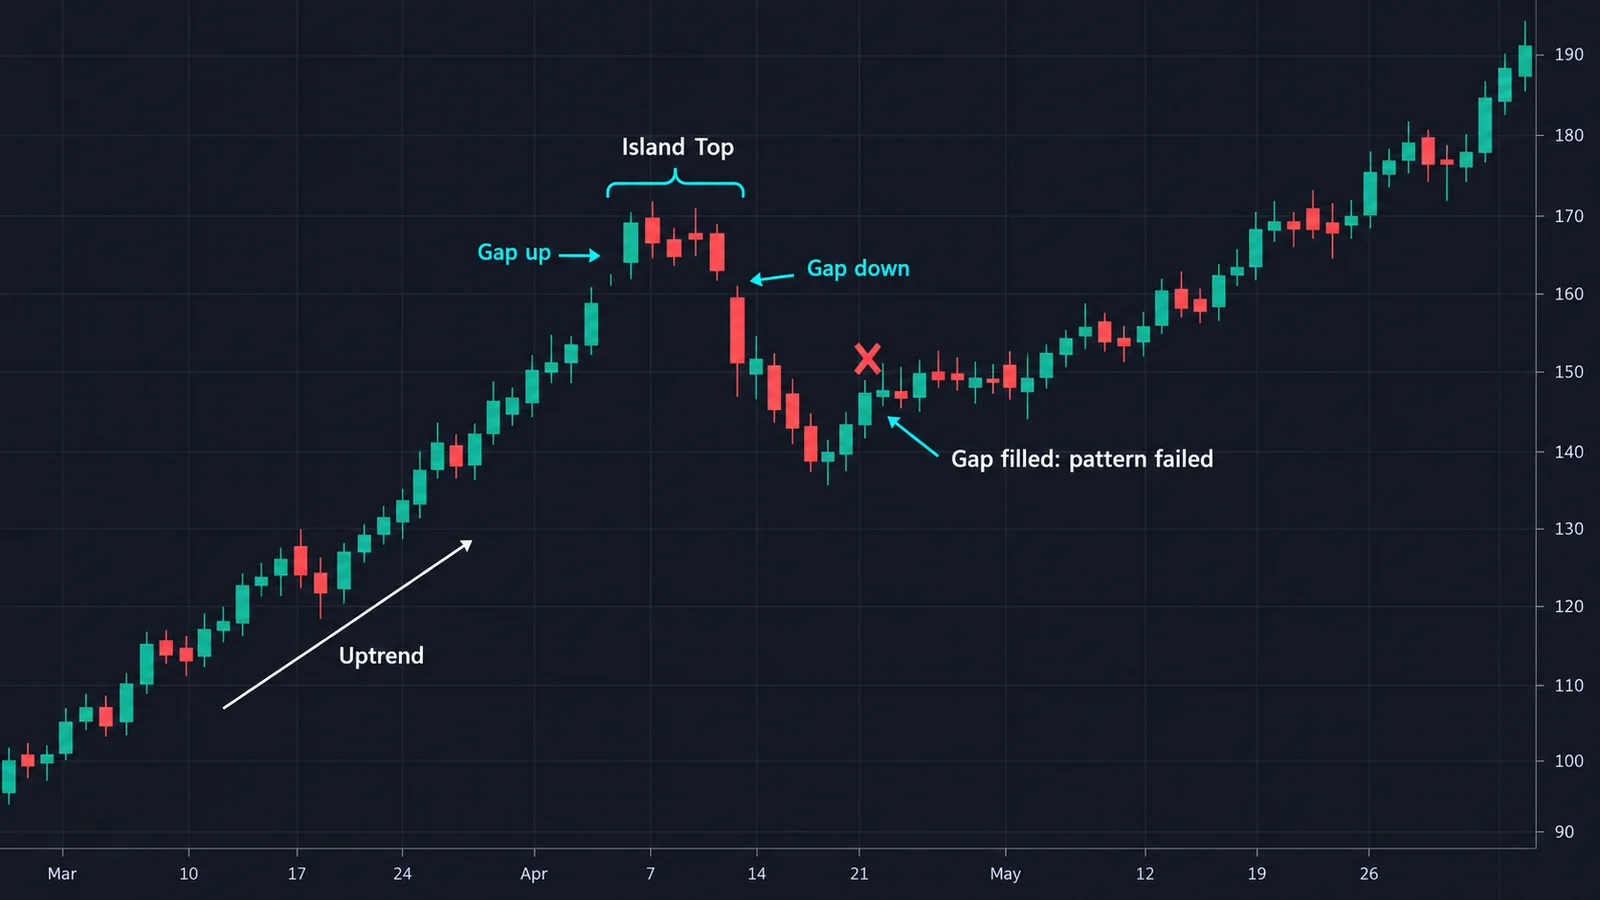
When do island reversals fail?
- The second gap fills quickly. If price trades back into the island within a few bars, the trapped traders are let off the hook and the prior trend often resumes. This is the most common failure.
- It forms inside a range. Without a clear trend before it, there are no exhausted buyers or sellers to trap.
- The gaps are tiny. A gap of a few cents on a volatile stock is noise. Compare the gap with the average daily range or ATR.
- The news changes. Islands built around earnings or macro events can reverse again on the next headline.
Treat the island as evidence, not certainty. It is strongest when it lines up with other signs of a turn: a double top or head and shoulders in progress, a divergence on momentum, or a major level being rejected.

Automate your trades. Let Quantum Algo trade for you.
Every signal executed on your own account — on your account, with the plan you define.
Island reversal vs other reversal patterns
| Pattern | Key feature | Speed | Where it works |
|---|---|---|---|
| Island reversal | A cluster isolated by gaps on both sides | Fast: forms in days | Stocks, ETFs, index cash charts |
| Double top / bottom | Two tests of the same level | Weeks | All markets |
| Head and shoulders | Three peaks, the middle one highest | Weeks to months | All markets |
| Evening / morning star | Three-candle reversal, often with small gaps | Three bars | All markets, best on daily |
| Exhaustion gap | A late gap in a trend that is soon filled | Days | Gap markets |
An island reversal can be seen as an exhaustion gap followed by a breakaway gap. The evening star and morning star share its logic on a three-candle scale: a gap into extreme sentiment, a stall, and a reversal.
Island reversals and Quantum Algo
An island reversal is a clear story of trapped traders, but you still need a precise entry, a stop and a target, and you need to know whether the broader structure supports the turn.
The free Quantum Algo indicators mark market structure, liquidity sweeps and fair value gaps on TradingView, so you can see where the island sits in the bigger picture. Zeno, the premium engine from Quantum Algo (QuantumAlgo), prints signals with an entry, a stop and two targets on stocks, indices, gold, forex and crypto, and every call is on the public track record.
An island reversal is a cluster of bars separated by a gap on each side at the end of a trend: an island top (gap up, then gap down) is bearish and an island bottom (gap down, then gap up) is bullish. It works because traders who chased the first gap are trapped. Check that both gaps are real, that a trend preceded it and that the gaps are meaningful in size, place the stop beyond the island, and treat a quick fill of the second gap as failure.
◆ Interactive check
How well do you know the island reversal?
Questions traders ask about the island reversal
A chart pattern where price gaps in the direction of the trend, trades in an isolated cluster, then gaps back the other way, leaving the cluster separated by gaps on both sides.
Both versions exist. An island top after an uptrend is bearish; an island bottom after a downtrend is bullish.
It is a strong pattern when both gaps are real, a clear trend preceded it and the second gap holds, but it is rare and fails when the second gap is quickly filled. Use it with other evidence.
From a single bar to several weeks. What matters is that it is isolated by a gap on each side, not how long it lasts.
Beyond the island's extreme: above the high for an island top, below the low for an island bottom. Some traders use the far edge of the second gap for a tighter stop.
Rarely in a meaningful way. Those markets trade around the clock, so true gaps mostly appear over weekends. The pattern works best on stocks, ETFs and index cash charts.
An exhaustion gap is a single late gap in a trend that soon gets filled. An island reversal adds a second gap in the opposite direction that isolates the price action between them.
An island made of a single bar: price gaps away, trades for one session and gaps back the other way the next day.
References & Related Guides
Read next
- Gap Trading Strategy
- Double Top Pattern
- Double Bottom Pattern
- Head and Shoulders
- Evening Star
- Morning Star
- Candlestick Patterns
- Support and Resistance
- Bull Trap and Bear Trap
- Fair Value Gaps
- Free TradingView indicators
- Zeno — the premium engine