Is VWAP a Lagging Indicator?
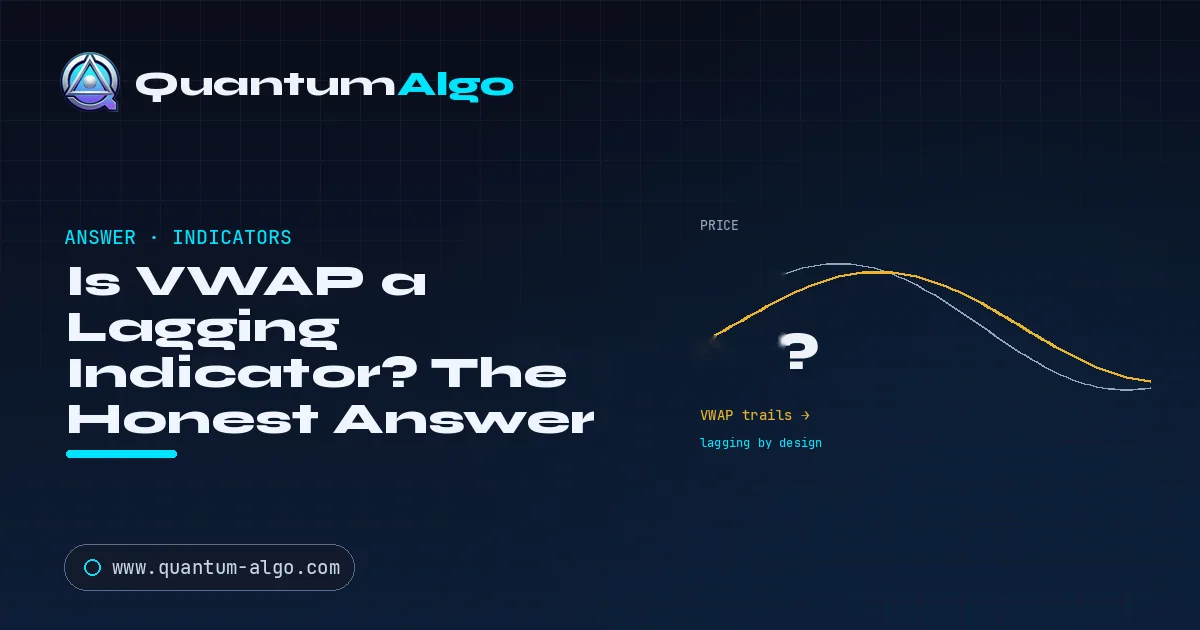
Yes, VWAP is a lagging indicator: it is built cumulatively from price and volume that have already traded, and its lag grows through the session as more data anchors it. But it is used as a real-time benchmark of fair value, not a forecast. Above VWAP, buyers control the session; below, sellers; trade the reaction at the line, not the cross.
The short answer
Yes, VWAP (Volume-Weighted Average Price) is technically a lagging indicator. It is calculated cumulatively from every price and volume print that has already occurred during the session, which means it reflects past activity rather than predicting future price. By the strict definition — an indicator built from historical data that trails current price — VWAP qualifies.
But labelling it "lagging" and dismissing it misunderstands its purpose. VWAP is not designed to be a leading signal generator like some momentum tools claim to be. It is a benchmark — a line showing the volume-weighted average price the market has agreed on so far. Its value comes from comparing current price to that benchmark, which is a very useful, if not predictive, piece of information.
Why does VWAP lag more as the session goes on?
VWAP is a cumulative average. It starts at the session open and, with each new bar, folds in more price-and-volume data. Because it averages everything traded so far, it responds slowly to sudden moves — the more data already baked in, the less a single new bar shifts the line. This is why VWAP's lag actually increases as the session progresses: early in the day the line is nimble (few data points), but by the afternoon a full session of volume anchors it, so it reacts sluggishly to late moves.
This is the same fundamental trade-off every averaging tool faces, and it is why VWAP behaves much like a volume-weighted moving average. It smooths, and smoothing always costs responsiveness. The difference from a normal moving average is that VWAP resets each session and weights by volume, but the lagging nature is shared.
How does VWAP compare with anchored VWAP and a moving average?
| Feature | Session VWAP | Anchored VWAP | Simple moving average |
|---|---|---|---|
| Inputs | Price and volume | Price and volume | Price only |
| Starting point | Session open, resets each session | A bar you choose | Rolling window of the last N bars |
| How the lag behaves | Grows as the session goes on | Grows with every bar since the anchor | Roughly constant, set by the length |
| Closed-bar values | Fixed, no repainting | Fixed, no repainting | Fixed, no repainting |
| Typical use | Intraday fair-value benchmark | Fair value since a chosen event | Trend smoothing across sessions |
◆All three lag by construction; the difference is what they average and when they start.
Lagging vs leading: why sources disagree
You will find reputable sources calling VWAP both "lagging" and "leading," which is understandably confusing. Here is how to reconcile them.
The "lagging" camp is describing the calculation: VWAP is built from data that has already traded, so mathematically it trails price. This is correct and is the technically accurate label.
The "leading" camp is describing the use: because VWAP depends on both price and volume, and because large participants benchmark their executions against it, price often reacts at the VWAP line — bouncing from it or rejecting it — which traders use to anticipate the next move. In that behavioural sense it feels forward-looking.
Both are right about different things. The clean way to hold it: VWAP is a lagging calculation used as a forward-looking reference. The lag is real; the edge comes from how price interacts with the line, much like reading market structure around a key level.
How should you trade VWAP if it lags?
Accepting that VWAP lags leads to using it correctly rather than expecting the wrong thing from it. Three practical consequences:
Don't treat a VWAP cross as a prediction. Price crossing VWAP tells you sentiment has shifted relative to the day's fair value — it does not forecast continuation. In choppy, range-bound sessions price whipsaws across VWAP repeatedly, generating false signals.
Use it as context, not a trigger. Above VWAP = buyers in control on the session; below = sellers. That bias is genuinely useful for filtering trades, but you still need a separate, more precise entry method and sound risk management.
Watch the reaction, not just the level. The highest-value information is how price behaves when it reaches VWAP — a clean rejection or a decisive reclaim says more than the raw position. This is where VWAP's lag stops mattering, because you are trading the live reaction, not the trailing line.

Automate your trades. Let Quantum Algo trade for you.
Every signal executed on your own account — 24/7, hands-off.
◆ Test Your Knowledge
Is VWAP a Lagging Indicator? with Quantum Algo
VWAP tells you where the day's fair value sits, but not where the structure that actually moves price is. Quantum Algo's Smart Money Concepts tools map liquidity, order blocks and market structure, so you can combine VWAP's fair-value context with precise, structure-backed entries — all with a verified public track record.
See the indicator → Verify the track record◇ Frequently Asked Questions
VWAP is technically a lagging indicator, because it is calculated from price and volume that have already traded during the session. Mathematically it trails current price. However, it is used as a real-time benchmark of fair value, and because price often reacts at the VWAP line, some traders describe it as forward-looking in behaviour. The accurate framing is a lagging calculation used as a forward-looking reference.
Because they are describing how it is used rather than how it is calculated. Since VWAP incorporates volume and is watched by large participants who benchmark executions against it, price frequently reacts at the VWAP line — bouncing or rejecting — which traders use to anticipate the next move. That behaviour feels leading, even though the underlying calculation is built from past data and therefore lags.
No. VWAP does not predict future price; it shows the volume-weighted average price the market has traded at so far in the session. Its usefulness is as a benchmark — comparing current price to VWAP and watching how price reacts when it reaches the line. Any forward-looking value comes from interpreting that reaction, not from the line itself forecasting anything.
Because VWAP is a cumulative average that folds in more data with each bar. Early in the session few data points mean the line moves easily; by the afternoon a full day of volume anchors it, so a single new bar barely shifts it. The result is that VWAP becomes progressively slower to react as the session progresses.
They serve different purposes. VWAP weights by volume and resets each session, making it a strong intraday fair-value benchmark, while a moving average is a simpler, continuous price average. Both lag by construction. VWAP is generally preferred for intraday benchmarking because it reflects where volume actually traded, but it is not strictly better — many traders use both for different jobs.
You can use it as context rather than a standalone signal. A VWAP cross indicates a shift relative to the session's fair value, but treating every cross as a trade — especially in choppy markets — produces false signals. The more reliable approach is to use VWAP for directional bias and to trade the reaction when price reaches the line, combined with structure and risk management.
Standard session VWAP does not repaint once a bar has closed — its value for a closed bar is fixed. It does update in real time on the currently forming bar, which is expected behaviour for a cumulative intraday calculation, not repainting. Anchored VWAP similarly fixes its historical values once bars close. As always, verify the specific implementation you use.
When price is above VWAP, the average buyer in the session so far is in profit and buyers are considered in control — a bullish intraday bias. When price is below VWAP, sellers are in control — a bearish bias. This is a useful sentiment filter, but because VWAP lags, the position alone is context rather than a precise entry signal.
VWAP accurately reports what it measures: the volume-weighted average traded price for the session. It is not a prediction, so asking whether it is accurate at forecasting is the wrong question. It is accurate as a benchmark, most reliable on liquid instruments with real volume, and least useful in thin, low-volume conditions where a few large trades can skew the average.
Yes, VWAP is beginner-friendly as a fair-value reference — it is built into most platforms and gives a quick read on intraday sentiment. The key is to understand from the start that it lags and is not a signal generator. Beginners get the most from it by using it for bias and watching reactions at the line, paired with basic risk management, rather than trading every cross.
VWAP works best in liquid markets with meaningful, reliable volume — index futures, large-cap stocks, major pairs. In thin or low-volume conditions it becomes less reliable because a few large trades can skew the volume-weighted average. Because standard VWAP also resets each session, it is fundamentally an intraday tool rather than a multi-day one.
VWAP gives you the session's fair-value context but not the structural levels that move price. Quantum Algo's Smart Money Concepts tools map liquidity, order blocks, and market structure, so you can combine VWAP's benchmark with precise, structure-backed entries and stops. With a verified public track record, it fills exactly the entry-precision gap that a lagging benchmark like VWAP leaves open.
References & Related Guides
More in this topic
- Best VWAP Settings for Intraday Trading: Why the 3 Lines and Bands Matter
- Best TradingView Indicators — Complete Guide
- Divergence Trading: Complete Guide
- Elliott Wave Theory — Complete Trading Guide
- Fisher Transform Indicator: Complete Guide
- Harmonic Patterns: Complete Trading Guide
- Heikin Ashi — Complete Smoothed Candlestick Guide
- Inside Bar Trading: Complete Guide
- Leverage Trading: The Complete Guide
- Machine Learning Trading Indicators (Lorentzian): Complete Guide
- Pin Bar Trading: Complete Guide
- Pivot Points — Complete Intraday Support & Resistance Guide
- Position Trading: Complete Guide
- Can You Use VWAP on a Daily Chart?
- Does VWAP Actually Work?
Core reading
- BOS & CHoCH: Complete Market Structure Guide
- Order Blocks Trading: Complete Guide
- Risk Management in Trading — Complete Guide
- Candlestick Patterns Guide — Engulfing, Pinbar & More
- All Premium Guides
- Quantum Algo on TradingView
- Public Track Record