QQE Mod Indicator: The Complete Smoothed-RSI Momentum Guide
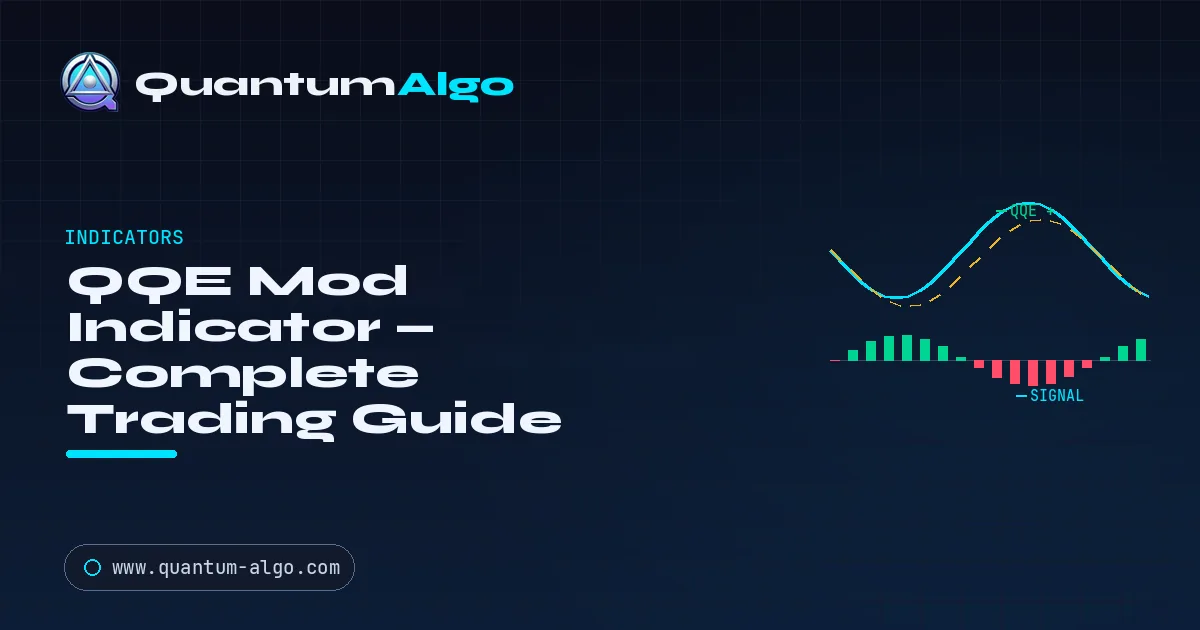
QQE Mod (Quantitative Qualitative Estimation, modified) is a momentum indicator that smooths the RSI and wraps it in a trailing band built from the RSI's average true range, plus a colored histogram and slower second line. The signal is the smoothed RSI crossing the band as the histogram flips color, read as a momentum shift and best filtered by trend.
QQE Mod (Quantitative Qualitative Estimation, modified) is a popular momentum indicator that takes the RSI, smooths it heavily, and wraps it in a volatility-based trailing band to produce clean trend-and-momentum signals. The "Mod" version — widely used on TradingView in confluence systems — adds a coloured histogram and a second, slower QQE line, turning it into an at-a-glance read of whether momentum is bullish or bearish and how strong it is. It is a favourite building block in multi-indicator strategies because its signals are noticeably smoother than raw RSI or MACD.
This guide breaks down what QQE actually calculates, how the "Mod" histogram works, the settings that control its sensitivity, three ways to trade it, and how to combine it with structure so you are not taking every colour change as a signal.

Automate your trades. Let Quantum Algo trade for you.
Every signal executed on your own account — 24/7, hands-off.
What does QQE actually calculate?
The base QQE takes an RSI (usually smoothed with a short EMA), then builds a "trailing stop" line around it using the Average True Range of the RSI itself — essentially a volatility band applied to momentum rather than price. When the smoothed RSI crosses above its trailing line, momentum has turned bullish; when it crosses below, bearish. This ATR-style smoothing is what removes the jitter that makes raw RSI hard to trade.
The "Mod" version adds two things: a coloured histogram (often blue for bullish, red for bearish) built from the difference between the fast QQE line and a zero/threshold level, and a second QQE calculated with a longer length for slower confirmation. Together they let you see momentum direction, strength, and a faster-vs-slower agreement in one panel.
How QQE Mod reads momentum
Which QQE Mod settings matter most?
▸ RSI length
The base momentum period. Shorter = more reactive, more signals; longer = smoother, fewer. The default (around 6-14) is a good starting point; raise it for higher timeframes.
▸ RSI smoothing
The EMA applied to the RSI before the band is built. More smoothing = cleaner but slower signals. This is a big part of why QQE feels less noisy than raw RSI.
▸ QQE factor
The multiplier on the RSI-ATR that sets how far the trailing band sits from the smoothed RSI. Higher factor = wider band = fewer, higher-conviction crosses.
▸ Threshold / Bollinger length (Mod)
The Mod version often adds a Bollinger-style threshold that the fast QQE must exceed to colour the histogram. Tightening it produces more signals; widening it demands stronger momentum.
What are three ways to trade QQE Mod?
① Histogram colour flip
The simplest read: go long when the histogram turns bullish (blue/green), short when it turns bearish (red). Fast but prone to whipsaw in ranges — always filter by trend.
② Cross above/below the midline
Treat crosses of the fast QQE line above or below the zero/50 midline as momentum confirmation. A histogram flip that also clears the midline is stronger than one that does not.
③ QQE + trend confluence
Use QQE Mod purely as a momentum trigger inside a trend defined elsewhere — a moving average, a Supertrend, or market structure. Only take bullish QQE signals when the trend is up. This is how it is used in most serious confluence systems.
How does QQE Mod compare with RSI and MACD?
| Feature | QQE Mod | RSI | MACD |
|---|---|---|---|
| Base | Smoothed RSI + ATR band | Raw momentum oscillator | MA difference |
| Smoothness | Very smooth | Noisy | Moderate |
| Primary signal | RSI/band cross + histogram | OB/OS + divergence | Signal-line cross |
| Best for | Momentum confirmation in trends | Extremes & divergence | Trend momentum |
| Weakness | Whipsaws in ranges | Many false signals | Lags on turns |
Think of QQE Mod as a cleaner-signalling cousin of both. It is smoother than raw RSI and gives clearer momentum shifts than MACD in many conditions — which is exactly why it shows up so often as the momentum layer in multi-indicator "confluence" strategies. It is not better in isolation; it is easier to combine.
Where does QQE Mod fail?
Like every momentum oscillator, QQE Mod's colour changes are meaningful in a trend and meaningless in a range. Traders who take every histogram flip get chopped up. The reliable approach is to treat QQE as a momentum confirmation layer — a green light that timing is right — on top of a directional decision made from trend and structure. Confirming a QQE bullish flip against a genuine institutional-order-flow signal (a swept level, an order block, a break of structure) is what turns it from a noisy oscillator into a precise entry timer. That order-flow read is what the QuantumAlgo indicator is built to provide on TradingView.
• Order block detection — momentum flips that line up with institutional zones
• Liquidity sweep alerts — QQE shifts confirmed by a real stop raid beneath structure
• FVG identification — momentum entries timed by fair value gap fills
• Multi-timeframe context — HTF trend so your histogram flips agree with the move
• Smart alerts — notified when a QQE signal meets SMC confluence
◆ Time your entries where momentum and order flow agree
QuantumAlgo confirms momentum shifts with institutional order flow — liquidity, order blocks, and structure — on TradingView, with a verified public track record.
See the indicator → Verify the track recordFrequently Asked Questions
QQE Mod (Quantitative Qualitative Estimation, modified) is a momentum indicator that takes the RSI, smooths it, and wraps it in a volatility-based trailing band to produce clean momentum signals. The 'Mod' version adds a coloured histogram and a second, slower QQE line, so you can read momentum direction and strength at a glance. It is popular on TradingView as a smoother alternative to raw RSI in confluence systems.
It starts with an RSI, smooths it with a short EMA, then builds a trailing band around it using the Average True Range of the RSI itself — a volatility band applied to momentum. When the smoothed RSI crosses above its trailing band, momentum is bullish; below, bearish. The Mod version adds a histogram from the fast QQE line and a slower QQE for confirmation, shown as colour changes in one panel.
The key inputs are the RSI length, the RSI smoothing, and the QQE factor. Shorter lengths and lower factors give more reactive, more frequent signals suited to intraday; longer lengths and higher factors give smoother, higher-conviction signals suited to swing trading and higher timeframes. Start with the defaults and adjust based on your market and timeframe rather than optimising blindly.
There are three common methods: trade the histogram colour flip (bullish blue/green for long, red for short), trade crosses of the fast QQE line above or below the midline as momentum confirmation, or use QQE purely as a momentum trigger inside a trend defined elsewhere. The third — only taking QQE signals aligned with the trend — is how it is used in most serious confluence strategies.
The QQE calculation confirms on bar close, so a signal that has printed on a closed candle does not repaint. As with any indicator, the current unclosed candle's histogram colour and line position can change until that candle closes, so wait for bar close before acting on a fresh signal to avoid reacting to a flip that later disappears.
QQE Mod is built on RSI but smooths it heavily and adds a volatility trailing band, which removes most of the jitter that makes raw RSI hard to trade. Raw RSI is best for spotting overbought/oversold extremes and divergences, while QQE Mod is better for clean momentum-shift signals via its band crosses and histogram. QQE trades signals; RSI reads conditions.
Both are momentum tools, but MACD is built from the difference of two moving averages while QQE Mod is built from a smoothed RSI with a volatility band. In many conditions QQE gives clearer, earlier momentum shifts than MACD's signal-line cross, which is why it is popular in confluence systems. MACD lags more on turns; QQE whipsaws more in ranges. Neither is strictly better.
Because it is a momentum oscillator, its colour changes are meaningful in a trend but meaningless in a range. When price moves sideways, the histogram flips repeatedly and each cross is a small losing signal. This is inherent to momentum indicators. The fix is to only take QQE signals in the direction of a defined trend and to ignore flips during low-volatility, ranging conditions.
It works on all timeframes. Higher timeframes with longer settings produce smoother, more reliable momentum signals, while lower timeframes with shorter settings generate more signals and more noise. A common approach is to confirm trend on a higher timeframe and use QQE Mod on a lower one to time entries in that direction, keeping the momentum read aligned with the dominant trend.
It can be, using a shorter RSI length on lower timeframes, but the trade-off is more false flips in the noise of small timeframes. Scalpers who use it typically pair it with a fast trend filter and take only histogram flips that agree with short-term structure, rather than trading every colour change, which would produce too many whipsaw losses.
Yes, and it is designed to be. It is smooth enough to layer cleanly with a trend tool like a moving average or Supertrend, and it shows up constantly as the momentum component in multi-indicator confluence strategies. Its best use is as a momentum-confirmation layer on top of a directional decision made from trend and structure, rather than as a standalone signal.
The coloured histogram represents momentum direction and strength, built from the difference between the fast QQE line and a threshold level. A bullish colour (often blue or green) means momentum is positive; a bearish colour (red) means it is negative. Taller bars indicate stronger momentum. A histogram flip that also clears the midline is a stronger signal than one that does not.
References & Related Guides
More in this topic
- ADX Indicator: Complete Trading Guide
- AlphaTrend Indicator: Complete Trading Guide
- ATR (Average True Range): Complete Trading Guide
- Awesome Oscillator: Complete Indicator Guide
- What Are the Best Volume Indicators?
- Bollinger Bands — Complete Trading Indicator Guide
- CCI Indicator: Complete Guide
- Chandelier Exit: Complete Trading Guide
- Donchian Channels: Complete Indicator Guide
- Fibonacci Bollinger Bands: Complete Trading Guide
- Fibonacci Retracement — Complete Trading Guide
- Hull Moving Average (HMA): Complete Trading Guide
Core reading
- BOS & CHoCH: Complete Market Structure Guide
- Order Blocks Trading: Complete Guide
- Best TradingView Indicators — Complete Guide
- Risk Management in Trading — Complete Guide
- Candlestick Patterns Guide — Engulfing, Pinbar & More
- All Premium Guides
- Quantum Algo on TradingView
- Public Track Record