MACD 4C (Four Color): The Complete Momentum-Histogram Guide
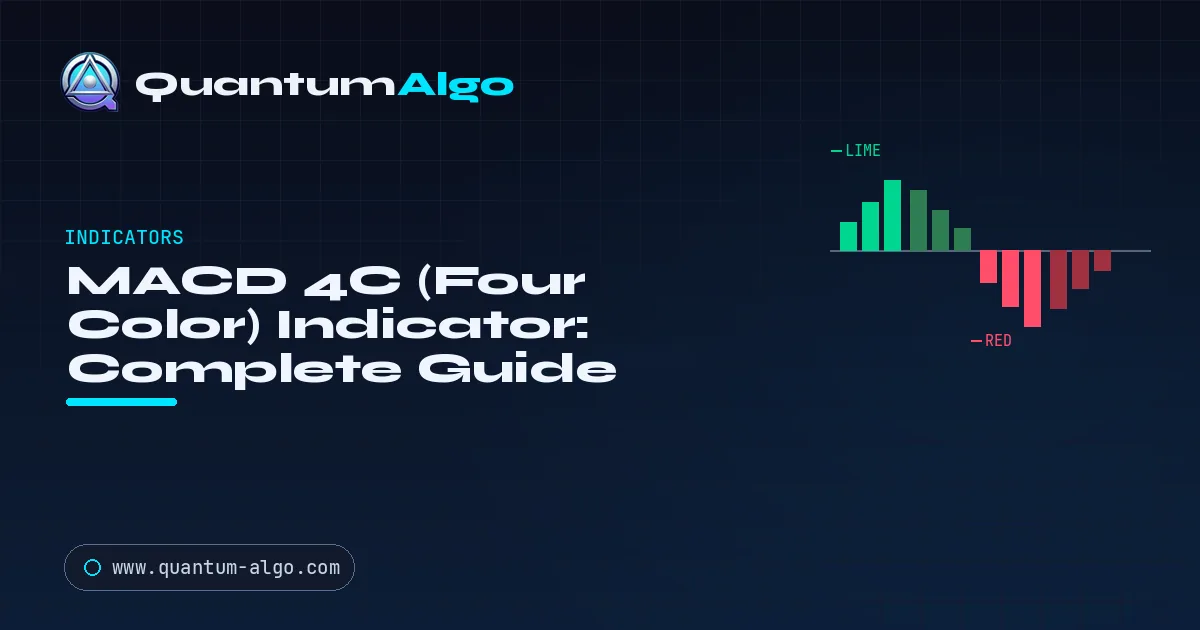
The MACD 4C (Four Color) indicator, by vkno422 on TradingView, colors each MACD histogram bar by momentum's sign and slope: lime is above zero and rising, dark green above zero but falling, red below zero and falling, maroon below zero but rising. Bright colors mean accelerating momentum; dark colors warn of exhaustion before a crossover. Defaults are 12/26/9.
The classic MACD is one of the most-used momentum indicators in the world — but its histogram asks a lot of the eye. Is momentum rising or falling? Above or below zero? Strengthening or fading? You have to read the bars carefully to know. The MACD 4C (Four Color) indicator solves that in the most elegant way possible: it colours every histogram bar according to both its direction and its slope, so a single glance tells you not just whether the market is bullish or bearish, but whether that momentum is building or exhausting.
This guide explains exactly what the four colours mean, how the indicator is calculated, the settings that matter, how to trade momentum phases and exhaustion, and the honest limitations. It is written for traders who already understand the basic MACD and want to turn its histogram into an instant, colour-coded momentum map.

Automate your trades. Let Quantum Algo trade for you.
Every signal executed on your own account — 24/7, hands-off.
Who made MACD 4C, and what does it add?
MACD 4C, originally published on TradingView by the user vkno422, is an enhanced version of the traditional MACD histogram. As its author describes, it enhances the classic Moving Average Convergence Divergence by giving the histogram bars four distinct colours, offering a clearer interpretation of market momentum and potential trend reversals. The underlying maths is the familiar MACD — but the presentation is transformed.
Here is the key idea. A standard MACD histogram only tells you two things through its bars: whether momentum is positive or negative (above or below the zero line) and roughly how large it is. MACD 4C adds a second dimension — slope. By comparing each bar to the one before it, the indicator knows whether momentum is increasing or decreasing, and encodes that in the colour. As the Pineify documentation puts it, the four-color version adds "colour intelligence" that makes market conditions instantly readable, eliminating the need to squint at line positions and bar heights.
Direction + acceleration
Each bar encodes two things at once: whether momentum is bullish or bearish (polarity) and whether it is strengthening or weakening (slope). That is the whole innovation.
Instant readability
No more interpreting subtle bar-height changes. One glance at the colour tells you the momentum phase — building, fading, or reversing.
Non-repainting
Like the classic MACD, once a bar's colour prints on close it stays fixed. This makes it reliable for both live trading and backtesting.
How do you read the four MACD 4C colours?
This is the heart of the indicator, so it is worth committing to memory. The four colours combine two questions — is momentum above or below zero, and is it rising or falling — into a single instant read.
| Colour | Condition | What it means |
|---|---|---|
| Lime / bright green | Above zero and rising | Strong bullish momentum — the trend is accelerating up. The healthiest bullish state. |
| Dark green | Above zero but falling | Weakening bullish momentum — still positive, but decelerating. An early caution in an uptrend. |
| Bright red / maroon-dark | Below zero and falling | Strong bearish momentum — the trend is accelerating down. The healthiest bearish state. |
| Maroon / dark red | Below zero but rising | Weakening bearish momentum — still negative, but decelerating. An early caution in a downtrend. |
The power of this scheme is that it lets you see momentum exhaustion before a crossover happens. As the MT4-style color-coded version notes, the four-colour logic helps you spot weakening trends before a crossover occurs. When bright green fades to dark green, bullish momentum is running out of steam even though the histogram is still positive — a warning that arrives well ahead of the classic zero-line cross. That early read is the entire reason experienced traders reach for MACD 4C over the plain histogram.
The four-colour momentum histogram
Momentum accelerates up (lime), fades while still positive (dark green), crosses below zero and accelerates down (red), then decelerates (maroon) before the next turn.
What decides the colour of each MACD 4C bar?
The calculation is the standard MACD with a colour rule bolted on. First, the classic MACD components: a fast EMA (default 12) and a slow EMA (default 26) of price, whose difference is the MACD line. A signal line (default 9-period EMA of the MACD line) smooths it. The histogram is the distance being visualised — depending on the variant, either the MACD line itself or the MACD-minus-signal difference. (One well-regarded version deliberately uses the true MACD line rather than MACD − signal, to remove the cross-platform ambiguity that confuses traders comparing histograms.)
Then comes the colour logic. For each bar the indicator checks two booleans: is the histogram value above or below zero? and is it greater or less than the previous bar's value? Those two yes/no answers map directly onto the four colours. Above zero and higher than the last bar → lime. Above zero but lower → dark green. Below zero and lower → red. Below zero but higher → maroon. Better implementations add a small symmetric noise filter so tiny wiggles do not cause false colour flips. It is a simple rule, but encoding acceleration as colour is what makes the histogram so much faster to read.
The Settings That Matter
| Setting | What it controls | Practical effect |
|---|---|---|
| Fast Length | The fast EMA period (default 12) | Lower = more sensitive, more colour changes; higher = smoother. |
| Slow Length | The slow EMA period (default 26) | The anchor of the MACD. Rarely changed from 26 except to tune sensitivity. |
| Signal Smoothing | The signal-line EMA period (default 9) | Higher smooths the signal and reduces false flips; lower reacts faster. |
| Divergence detection | Toggles bullish/bearish divergence labels (on variants that include it) | Adds a leading element by flagging price/momentum disagreements. |
The standard 12/26/9 parameters work well for most situations. As Pineify notes, you might use longer periods (16, 35, 10) to filter noise in high-volatility markets, keep the defaults in strong trends, and use shorter periods (10, 21, 7) for quicker reversals in choppy conditions — but there is no universal "best" setting, only the one suited to your market and timeframe.
Three Ways to Trade MACD 4C
Momentum continuation
Enter longs when the histogram turns lime (above zero and rising) and shorts when it turns red (below zero and falling). Exit when the colour shifts to its "weakening" shade — dark green or maroon.
Exhaustion / reversal warning
Watch for maroon in a downtrend (bearish momentum fading — potential bottom) or dark green in an uptrend (bullish momentum fading — potential top). Confirm with price action before acting.
Divergence + structure
Use the divergence variant to flag price/momentum disagreements, then take the trade only where it aligns with an order block, a fair value gap, or a liquidity sweep.
Should you use MACD 4C or the classic MACD?
| Dimension | Classic MACD | MACD 4C |
|---|---|---|
| Histogram info | Direction + magnitude | Direction + magnitude + acceleration (via colour) |
| Reading momentum phase | Requires interpreting bar heights | Instant — the colour tells you |
| Early exhaustion signal | Subtle; easy to miss | Obvious colour shift (bright → dark) |
| Divergence | Manual spotting | Auto-detected on some variants |
| Repainting | No | No |
When does MACD 4C fail?
MACD 4C inherits every weakness of the underlying MACD, and it is important to be honest about them. First, it is a lagging indicator. As the Xuantify analysis states plainly, both the standard MACD and MACD 4C are lagging by nature because they rely on moving averages; they are designed to confirm trends, not predict them. The colour changes help you anticipate exhaustion a little earlier, but the tool is still fundamentally reactive.
Second, in choppy, sideways markets the colours flip rapidly and become noise, exactly as MACD histograms always have. A string of alternating lime and dark green bars in a range is not a signal — it is the indicator reflecting directionless price. Third, the four colours can create a false sense of precision: a shift to dark green is a caution, not a reversal, and traders who short every dark-green bar in a strong uptrend will be repeatedly stopped out. The divergence feature adds a modest leading element, but as its own authors stress, it should always be used with structure and price action for confirmation, never as a standalone signal.
What does a full MACD 4C momentum cycle look like?
Picture a trending market. Price pushes up and the MACD 4C histogram glows lime — momentum is positive and accelerating, so a trend-follower holds their long confidently. After a strong run, the bars shift to dark green: still above zero, but now falling. This is the early caution — bullish momentum is fading. The disciplined trader does not flip short here; instead they tighten their stop and stop adding to the position. Sure enough, the histogram crosses below zero and turns bright red as a downtrend accelerates. Finally, after an extended decline, the bars fade to maroon — still below zero but rising — hinting the selling is exhausting and a bottom may be forming.
Read as a cycle, the four colours narrate the entire momentum story: acceleration up, fade, acceleration down, fade, repeat. A trader who uses the bright colours to hold with the trend and the dark colours to tighten risk — while waiting for price-structure confirmation before reversing — extracts far more from the MACD than someone staring at a single-colour histogram trying to judge bar heights. The colour does the interpretive work that used to happen in your head, freeing your attention for the thing that actually matters: where price is relative to key structure. That is the quiet efficiency gain that makes MACD 4C worth the switch.
Which tools should you pair with MACD 4C?
MACD 4C is at its best as a momentum confirmation layer inside a structure-based system. Let the colours answer "is momentum with me, and is it building or fading?" while Smart Money Concepts answer "where is the high-probability level?" Take a long from a demand order block only when MACD 4C is lime or turning lime; treat a shift to dark green as your cue to take partial profit before price even reaches a fair value gap above. A maroon-to-lime flip that occurs right as price sweeps a low and reclaims it — a liquidity sweep — is a particularly high-quality long trigger, pairing momentum acceleration with an institutional stop-run. That is how a simple colour-coded histogram becomes a genuine edge.
• Order block detection — momentum colours confirmed at institutional demand and supply zones
• Liquidity sweep alerts — maroon-to-lime flips confirmed by a genuine stop raid and reclaim
• FVG identification — partial-profit timing as momentum fades toward a fair value gap
• Multi-timeframe bias — HTF MACD 4C colour aligned with your lower-timeframe entries
• Smart alerts — notified when a momentum-phase shift meets SMC confluence
◆ Read momentum and structure in one system
QuantumAlgo pairs momentum context with Smart Money Concepts — order blocks, fair value gaps, and liquidity sweeps — plus a verified public track record so every signal is accountable.
See the indicator →Verify the track recordFrequently Asked Questions
MACD 4C (Four Color) is an enhanced version of the classic MACD, originally published on TradingView by the user vkno422. It colours each histogram bar one of four colours based on whether momentum is above or below zero and whether it is rising or falling, so you can read both direction and acceleration at a single glance.
Lime (or bright green) means the histogram is above zero and rising — strong bullish momentum. Dark green means above zero but falling — weakening bullish momentum. Red means below zero and falling — strong bearish momentum. Maroon (dark red) means below zero but rising — weakening bearish momentum. Bright colours signal strengthening momentum, dark colours signal fading momentum.
The regular MACD histogram shows only direction and magnitude, forcing you to interpret bar heights to judge momentum. MACD 4C adds a second dimension — slope — by colouring each bar according to whether it is rising or falling relative to the previous bar. This makes momentum acceleration and exhaustion instantly readable without interpreting subtle bar changes.
It uses the standard MACD components — a fast EMA (default 12), a slow EMA (default 26), and a signal-line EMA (default 9). The histogram value is then checked against two conditions: whether it is above or below zero, and whether it is higher or lower than the previous bar. Those two answers map onto the four colours, often with a small noise filter to prevent false colour flips.
The standard 12, 26, 9 parameters work well for most markets. For high-volatility conditions, longer periods such as 16, 35, 10 filter out noise; for choppy or sideways markets, shorter periods such as 10, 21, 7 react faster to reversals. There is no universal best setting — it depends on your market and timeframe.
No. Like the standard MACD, once a histogram bar's colour prints at the close of a bar it stays fixed and does not change on later bars. This non-repainting behaviour makes MACD 4C reliable for both live trading and backtesting.
Watch for the colour shifting from a bright shade to its dark counterpart. When lime fades to dark green, bullish momentum is weakening even though it is still positive; when red fades to maroon, bearish momentum is weakening. These shifts warn of exhaustion before a zero-line crossover occurs, giving an earlier read than the classic histogram.
It is primarily a lagging indicator because it is built on moving averages, so it confirms trends rather than predicting them. The colour changes help you anticipate exhaustion slightly earlier, and the divergence variant adds a modest leading element, but it should still be used as a confirmation tool alongside price action, not a standalone predictor.
Dark green means the histogram is above the zero line but falling — bullish momentum that is still positive but decelerating. It is an early caution that an uptrend is losing steam, and many traders use it as a cue to tighten stops or take partial profit rather than as a signal to short.
Some versions of MACD 4C, including the original by vkno422, include bullish and bearish divergence detection between the histogram and price. This flags when price makes a new extreme that momentum does not confirm, which can precede a reversal — but it should always be confirmed with structure and price action rather than traded on its own.
It works on any timeframe. Higher timeframes give cleaner, more reliable colour signals with fewer false flips, while lower timeframes produce more noise. Many traders use multi-timeframe alignment — for example requiring the higher-timeframe MACD 4C to be the same colour direction before taking a lower-timeframe entry.
Use the colours as a momentum filter for structure-based entries: take a long from a demand order block only when MACD 4C is lime or turning lime, and treat a shift to dark green as a cue to take partial profit. A maroon-to-lime flip that occurs as price sweeps a low and reclaims it pairs momentum acceleration with a liquidity sweep for a high-quality long trigger.
References & Related Guides
Primary and authoritative sources used in this guide:
- ◆ TradingView — MACD 4C scripts (original by vkno422)
Source for the four-colour histogram definition, parameters and divergence variant. - ◆ Investopedia — Moving Average Convergence Divergence (MACD)
Foundational reference on the MACD line, signal line and histogram that MACD 4C is built on. - ◆ Investopedia — Momentum
Background on momentum and acceleration, the concepts the four colours encode. - ◆ Investopedia — Exponential Moving Average (EMA)
Reference on the moving averages behind the MACD calculation and its inherent lag.